The document discusses various dashboard and reporting features available in the SANeFORCE SFE system. Some key advantages include generating reports by campaign, specialty, category, class and territory. It allows for common data maintenance across all divisions and dynamic designation/level creation. Reports can be exported to Excel and PDF formats. It also provides quick implementation, support for head office and field force, mobile apps, business intelligence tools, and other features.
Precision agriculture uses information technology to optimize crop and soil management down to sub-field levels. It relies on precision agriculture technologies like GPS, weather stations, remote sensing, digital elevation models, soil surveys, databases, and GIS to collect and analyze spatial data on variables like soil type, temperature and moisture. This data is used to identify management zones and strategically implement practices that ensure crops and soil receive exactly what they need to maximize health and productivity.
This document discusses agricultural robots and their uses. It begins with introductions to robots and agricultural robotics. Agricultural robots can be used for tasks like harvesting, weed control, forestry work, horticulture, and fruit picking. They allow processes like plowing, seeding, fertilizing, weeding and harvesting to be done with less manual labor, saving time and money. The document then describes a specific robot the author developed that can detect plant diseases using image processing and then spray only the affected plants with pesticide, reducing waste and pollution compared to uniform spraying. It concludes that this targeted treatment can help farmers better control diseases and pesticides in an environmentally friendly manner.
UPL has transformed from a local Indian company into a global agrochemical player over the past 50 years. It has a presence in over 130 countries and revenues of $2.7 billion in FY2018. UPL pursues growth through both organic initiatives such as new product development and strategic acquisitions. It is well positioned in the industry due to its R&D capabilities, global manufacturing and supply chain, extensive registration network, and market access through owned distribution.
The SANeForce platform provides a comprehensive sales and marketing solution with features such as geo-fencing, mobile reporting, eLearning, live insights and analytics, customizable dashboards, and support for both field forces and head offices. The platform offers various sales and marketing dashboards to analyze key performance indicators like sales performance and forecasting, team productivity, campaign effectiveness, product-wise sales, state-wise sales trends, and sample and input distribution. It integrates with other systems and provides data-driven insights through customizable reports to improve sales and marketing strategies.
This document provides information about SANeForce, a company that provides sales force effectiveness (SFE) services to pharmaceutical, FMCG, and healthcare companies. Some key details:
- SANeForce has over 100 employees and provides SFE services to over 100,000 users across 10+ countries.
- They offer a one stop solution for primary and secondary sales, communication, reporting, eDetailing, geo tagging, and sample/gift management.
- Their mobile app and dashboard provide real-time access to reports, analytics, KPIs, and other tools to help managers monitor field activities and performance.
David Stack: Financial Reporting: Building a Strong StructureDavid Stack
David Stack is a chief financial officer with over 20 years of success in leading global financial operations for growing companies, particularly those in the software as a service (SaaS) industry. In this presentation, David shares 6 essential categories of data that every financial advisor should use to identify upcoming trends in their business/organization.
The document summarizes a sales territory information system used by pharmaceutical companies. The system collects, analyzes and distributes sales data among company management. It includes standard tour programs, daily call reports, monthly reports, expense statements and stock and sales statements. These tools help managers monitor sales performance, ensure proper territory coverage, analyze expenses and forecast demand. The case study describes how one company automated reporting to save time, provide insights and drive better decision making.
Marketelligent Capabilities & Offerings for Sales AnalyticsMarketelligent
The document summarizes Marketelligent's capabilities in sales analytics for consumer packaged goods (CPG) companies. It provides examples of how Marketelligent helps clients track sales performance, identify drivers of share loss, and conduct pricing simulations. Marketelligent also offers forecasting, trade promotion optimization, market mix modeling, and SKU rationalization to improve business decisions. The management team descriptions suggest Marketelligent provides data-driven consulting services to consumer industries globally.
Shwetha Manjunath is seeking a challenging role in business operations. She has over 5 years of experience in customer data management, sales operations, and business analysis. Her experience includes supporting sales processes using applications like Siebel, Oracle Fusion CRM, and SFDC. She is proficient in databases, reports, and analyzing customer needs. She also has experience training new employees.
- Over 95,000 customers were invited to take a survey about their satisfaction. As of January 23rd, 2,563 customers had responded, a 3% response rate.
- So far, 63% of respondents provided written feedback totaling 1,445 comments. Several customer groups were excluded from the survey.
- A reminder was sent to non-respondents. Additional responses are still needed from certain business areas to achieve statistically valid scores.
- Customer comments and survey results will be analyzed to identify key themes about areas that need improvement and those performing well. Insights from verbatim comments provide additional context.
This document summarizes FootFall's retail analytics solutions that help businesses increase profitability by providing insights into customer behavior. FootFall collects data from multiple sources to give businesses a 360-degree view of customer activity. Their Site Analytics solution provides intra-day and trends insights to store managers and analysts. Site Analytics Expert provides additional analytics tools and reporting for advanced analysis by head office personnel. Both solutions analyze metrics like foot traffic, sales, staffing levels, and more to help businesses optimize operations and marketing strategies. FootFall also offers consultancy services to help clients uncover insights and action plans from their data to generate business value.
Sales reports provide key insights into a sales team's performance and productivity. Managers should regularly review daily call reports to ensure salespeople are adhering to call schedules, productivity reports to compare performance to benchmarks, pipelines to track prospects through the sales cycle, sales forecasts to set quotas and estimate revenue, and long-range forecasts to prepare for future large deals. Proper analysis of these reports helps managers identify issues, hold team members accountable, and determine necessary adjustments to maximize revenue and cash flow.
The rise of E-Commerce has heightened the need for retail property owners and shopping centre managers to maximise the value of their assets.
Experian FootFall’s Site Analytics for Shopping Centres has been created specifically for the retail property sector, to create greater understanding of consumer behaviour and pinpoint where return on investment is and isn’t being generated.
We recognise that improving asset performance involves a lot more than just footfall and tenant sales. In fact, our platform captures all of your business data, giving you true insight into what is affecting performance – such as footfall, sales, costs, staffing, weather, marketing, car-parking and commercialization.
New Site Analytics interface for mobile – empower centre managers to make actionable real-time decisions that drive centre performance.
The retail sector has never been more competitive, so it’s essential to understand what’s behind every dip or hike in sales within your business.
Experian FootFall’s Site Analytics for Retailers scientifically monitors and accurately analyses in-store customer behaviour to help retail businesses pinpoint areas where profits can be improved.
Our unique retail technology and analysis solutions enable retail businesses to identify and understand customer shopping habits, to drive performance. You can pinpoint profit opportunities in areas such as customer conversions, queue management, sales, marketing and merchandising.
New Site Analytics interface for mobile – empower store managers to make actionable real-time decisions that drive store performance.
SANeForce provides SFE, SFA, CRM, CLM services for pharmaceutical, FMCG and healthcare organizations, our services provides data to access the salesforce performance with regard to attendance complete analyses, sample, input, expenses, sales, and period. Field force can now submit their daily activity, monthly activity, and market feedback to the corporate office through our various tools available on desktop,
mobile, and tablets.
The mobile app marketing plan summarizes SellQuick, a premium sales activity monitoring app. It will be initially launched for free to target businesses and entrepreneurs, with premium features available through a $2 monthly subscription. The plan details the app's features for tracking field visit reports, data storage and analytics to monitor performance against targets. Revenue will be generated from premium upgrades and in-app advertising, while feedback will help improve the app over time. The goal is to become the leading sales monitoring solution for businesses within five years.
The document discusses best practices for using Salesforce to improve sales performance. It recommends defining top metrics for high-performing sales reps, analyzing reps' data to identify strengths and weaknesses, and using reports and dashboards to provide transparency and drive better behaviors. A customer case study shows how one company isolated key metrics, compared reps, and saw improved focus, sales, and cross-selling through increased data-driven management in Salesforce.
Do you know the real story your data is telling you?4Ps Marketing
Do you know the real story your data is telling you, or are you still stuck reading a fairytale? Insights Consultant Emma Haslam spoke about the subject at Brighton SEO 2014.
This document discusses management by metrics (MBM) and provides guidance on developing and using metrics to track business performance. It defines what a metric is and explains that the goal of metrics is to measure performance relative to goals and objectives. It then provides a five-step process for developing appropriate metrics and discusses common business metrics such as sales revenue, customer retention, costs, margins, and productivity. The document emphasizes linking metrics to objectives and identifying the key drivers and processes that impact performance. Finally, it outlines a three-step leadership roadmap for managing with metrics that involves defining objectives, integrating the customer perspective, and identifying performance drivers and processes.
The position of Business Analyst is responsible for tracking business performance and ensuring accurate and timely reports are provided to management and clients to facilitate decision making. Key duties include providing advice on customized insurance quotations and rates, estimating fund projections, preparing various business reports, analyzing healthcare parameters and claims data, and contributing to the development of a data warehouse. The ideal candidate holds a university degree in Actuarial Science, Statistics or Mathematics and has strong analytical skills and experience with statistical modeling to perform in-depth data analysis and establish critical trends.
Sales force automation refers to a system that is designed to automate the sales process like inventory management, KPIs of the sales team, etc. to accelerate your business growth. If you are willing to know more about sales force automation, you can schedule a demo with us.
KPI's you can measure in CRM for Sales and MarketingGary Perkins
The document discusses key performance indicators (KPIs) that can be measured in a customer relationship management (CRM) system to track sales and marketing performance. It identifies common KPIs to measure for leads, sales opportunities, sales and account team activities, and marketing activities. The document emphasizes the importance of consistently measuring KPIs over time, acting on trends, and using CRM systems to track and report on KPIs through reports and dashboards.
Best practices in creating & using sales reports & dashboards csupilowski
This document provides best practices for creating and using sales reports and dashboards. It discusses starting with out-of-the-box reports, understanding the different report and dashboard types, using data to drive behavior and results, knowing what metrics are important to executives, and capturing the right data. It emphasizes limiting the number of reports and dashboards, having a clear naming strategy, and determining appropriate security and access. The document recommends engaging users and including adoption and data quality metrics.
This document discusses the transformation of marketing roles to focus on revenue generation. It notes that roughly 50% of B2B marketers now have direct revenue accountability. Marketers are engaging prospects earlier in the buying process and staying involved through sales and after. As their role changes, marketers need new metrics to demonstrate business impact, moving from measuring activities to measuring revenue results. The document provides examples of key revenue metrics and outlines challenges in accurately calculating marketing ROI across the entire customer lifecycle. It emphasizes the importance of alignment between marketing, sales, finance, and IT to define common definitions, processes, and key performance indicators tied to revenue.
Zoom Company is an Egyptian consulting firm established in 2012. It provides various business consulting services including retail consultation, expansions and franchising support, project management, training, and digital marketing. The company aims to support market development in Egypt and the Middle East. It has expertise in areas such as retail strategy, operations assessment, SOP development, and accountability matrix design. Zoom works with clients to analyze their businesses, identify issues, and develop tailored solutions and implementation plans.
Got leads? Know how they came in? Know where they are in your nurture process? Know how to score them?
If you answered yes, then bravo! But, it’s most likely that you aren’t quite clear on these answers and lead processes. We find, more times than not, that when it comes to lead management marketers face more questions than answers.
So, how do you get clarity on your process and determine where you can improve?
Top Tips include:
- Why lead management stumps marketers and is one of the most complex processes every business faces
- Tricks to uncovering your process based on lessons learned from Digital Pi Client projects
- How an assessment works and why, even if you did answer yes to the above, it’s always a good idea to direct, learn, and improve
Unlocking Productivity: Leveraging the Potential of Copilot in Microsoft 365, a presentation by Christoforos Vlachos, Senior Solutions Manager – Modern Workplace, Uni Systems
For the full video of this presentation, please visit: https://www.edge-ai-vision.com/2024/06/building-and-scaling-ai-applications-with-the-nx-ai-manager-a-presentation-from-network-optix/
Robin van Emden, Senior Director of Data Science at Network Optix, presents the “Building and Scaling AI Applications with the Nx AI Manager,” tutorial at the May 2024 Embedded Vision Summit.
In this presentation, van Emden covers the basics of scaling edge AI solutions using the Nx tool kit. He emphasizes the process of developing AI models and deploying them globally. He also showcases the conversion of AI models and the creation of effective edge AI pipelines, with a focus on pre-processing, model conversion, selecting the appropriate inference engine for the target hardware and post-processing.
van Emden shows how Nx can simplify the developer’s life and facilitate a rapid transition from concept to production-ready applications.He provides valuable insights into developing scalable and efficient edge AI solutions, with a strong focus on practical implementation.
Sudheer Mechineni, Head of Application Frameworks, Standard Chartered Bank
Discover how Standard Chartered Bank harnessed the power of Neo4j to transform complex data access challenges into a dynamic, scalable graph database solution. This keynote will cover their journey from initial adoption to deploying a fully automated, enterprise-grade causal cluster, highlighting key strategies for modelling organisational changes and ensuring robust disaster recovery. Learn how these innovations have not only enhanced Standard Chartered Bank’s data infrastructure but also positioned them as pioneers in the banking sector’s adoption of graph technology.
Driving Business Innovation: Latest Generative AI Advancements & Success StorySafe Software
Are you ready to revolutionize how you handle data? Join us for a webinar where we’ll bring you up to speed with the latest advancements in Generative AI technology and discover how leveraging FME with tools from giants like Google Gemini, Amazon, and Microsoft OpenAI can supercharge your workflow efficiency.
During the hour, we’ll take you through:
Guest Speaker Segment with Hannah Barrington: Dive into the world of dynamic real estate marketing with Hannah, the Marketing Manager at Workspace Group. Hear firsthand how their team generates engaging descriptions for thousands of office units by integrating diverse data sources—from PDF floorplans to web pages—using FME transformers, like OpenAIVisionConnector and AnthropicVisionConnector. This use case will show you how GenAI can streamline content creation for marketing across the board.
Ollama Use Case: Learn how Scenario Specialist Dmitri Bagh has utilized Ollama within FME to input data, create custom models, and enhance security protocols. This segment will include demos to illustrate the full capabilities of FME in AI-driven processes.
Custom AI Models: Discover how to leverage FME to build personalized AI models using your data. Whether it’s populating a model with local data for added security or integrating public AI tools, find out how FME facilitates a versatile and secure approach to AI.
We’ll wrap up with a live Q&A session where you can engage with our experts on your specific use cases, and learn more about optimizing your data workflows with AI.
This webinar is ideal for professionals seeking to harness the power of AI within their data management systems while ensuring high levels of customization and security. Whether you're a novice or an expert, gain actionable insights and strategies to elevate your data processes. Join us to see how FME and AI can revolutionize how you work with data!
Unlock the Future of Search with MongoDB Atlas_ Vector Search Unleashed.pdfMalak Abu Hammad
Discover how MongoDB Atlas and vector search technology can revolutionize your application's search capabilities. This comprehensive presentation covers:
* What is Vector Search?
* Importance and benefits of vector search
* Practical use cases across various industries
* Step-by-step implementation guide
* Live demos with code snippets
* Enhancing LLM capabilities with vector search
* Best practices and optimization strategies
Perfect for developers, AI enthusiasts, and tech leaders. Learn how to leverage MongoDB Atlas to deliver highly relevant, context-aware search results, transforming your data retrieval process. Stay ahead in tech innovation and maximize the potential of your applications.
#MongoDB #VectorSearch #AI #SemanticSearch #TechInnovation #DataScience #LLM #MachineLearning #SearchTechnology
Let's Integrate MuleSoft RPA, COMPOSER, APM with AWS IDP along with Slackshyamraj55
Discover the seamless integration of RPA (Robotic Process Automation), COMPOSER, and APM with AWS IDP enhanced with Slack notifications. Explore how these technologies converge to streamline workflows, optimize performance, and ensure secure access, all while leveraging the power of AWS IDP and real-time communication via Slack notifications.
“An Outlook of the Ongoing and Future Relationship between Blockchain Technologies and Process-aware Information Systems.” Invited talk at the joint workshop on Blockchain for Information Systems (BC4IS) and Blockchain for Trusted Data Sharing (B4TDS), co-located with with the 36th International Conference on Advanced Information Systems Engineering (CAiSE), 3 June 2024, Limassol, Cyprus.
Building Production Ready Search Pipelines with Spark and MilvusZilliz
Spark is the widely used ETL tool for processing, indexing and ingesting data to serving stack for search. Milvus is the production-ready open-source vector database. In this talk we will show how to use Spark to process unstructured data to extract vector representations, and push the vectors to Milvus vector database for search serving.
TrustArc Webinar - 2024 Global Privacy SurveyTrustArc
How does your privacy program stack up against your peers? What challenges are privacy teams tackling and prioritizing in 2024?
In the fifth annual Global Privacy Benchmarks Survey, we asked over 1,800 global privacy professionals and business executives to share their perspectives on the current state of privacy inside and outside of their organizations. This year’s report focused on emerging areas of importance for privacy and compliance professionals, including considerations and implications of Artificial Intelligence (AI) technologies, building brand trust, and different approaches for achieving higher privacy competence scores.
See how organizational priorities and strategic approaches to data security and privacy are evolving around the globe.
This webinar will review:
- The top 10 privacy insights from the fifth annual Global Privacy Benchmarks Survey
- The top challenges for privacy leaders, practitioners, and organizations in 2024
- Key themes to consider in developing and maintaining your privacy program
Dr. Sean Tan, Head of Data Science, Changi Airport Group
Discover how Changi Airport Group (CAG) leverages graph technologies and generative AI to revolutionize their search capabilities. This session delves into the unique search needs of CAG’s diverse passengers and customers, showcasing how graph data structures enhance the accuracy and relevance of AI-generated search results, mitigating the risk of “hallucinations” and improving the overall customer journey.
Observability Concepts EVERY Developer Should Know -- DeveloperWeek Europe.pdfPaige Cruz
Monitoring and observability aren’t traditionally found in software curriculums and many of us cobble this knowledge together from whatever vendor or ecosystem we were first introduced to and whatever is a part of your current company’s observability stack.
While the dev and ops silo continues to crumble….many organizations still relegate monitoring & observability as the purview of ops, infra and SRE teams. This is a mistake - achieving a highly observable system requires collaboration up and down the stack.
I, a former op, would like to extend an invitation to all application developers to join the observability party will share these foundational concepts to build on:
Why You Should Replace Windows 11 with Nitrux Linux 3.5.0 for enhanced perfor...SOFTTECHHUB
The choice of an operating system plays a pivotal role in shaping our computing experience. For decades, Microsoft's Windows has dominated the market, offering a familiar and widely adopted platform for personal and professional use. However, as technological advancements continue to push the boundaries of innovation, alternative operating systems have emerged, challenging the status quo and offering users a fresh perspective on computing.
One such alternative that has garnered significant attention and acclaim is Nitrux Linux 3.5.0, a sleek, powerful, and user-friendly Linux distribution that promises to redefine the way we interact with our devices. With its focus on performance, security, and customization, Nitrux Linux presents a compelling case for those seeking to break free from the constraints of proprietary software and embrace the freedom and flexibility of open-source computing.
GraphSummit Singapore | The Future of Agility: Supercharging Digital Transfor...Neo4j
Leonard Jayamohan, Partner & Generative AI Lead, Deloitte
This keynote will reveal how Deloitte leverages Neo4j’s graph power for groundbreaking digital twin solutions, achieving a staggering 100x performance boost. Discover the essential role knowledge graphs play in successful generative AI implementations. Plus, get an exclusive look at an innovative Neo4j + Generative AI solution Deloitte is developing in-house.
Full-RAG: A modern architecture for hyper-personalizationZilliz
Mike Del Balso, CEO & Co-Founder at Tecton, presents "Full RAG," a novel approach to AI recommendation systems, aiming to push beyond the limitations of traditional models through a deep integration of contextual insights and real-time data, leveraging the Retrieval-Augmented Generation architecture. This talk will outline Full RAG's potential to significantly enhance personalization, address engineering challenges such as data management and model training, and introduce data enrichment with reranking as a key solution. Attendees will gain crucial insights into the importance of hyperpersonalization in AI, the capabilities of Full RAG for advanced personalization, and strategies for managing complex data integrations for deploying cutting-edge AI solutions.
Pushing the limits of ePRTC: 100ns holdover for 100 daysAdtran
At WSTS 2024, Alon Stern explored the topic of parametric holdover and explained how recent research findings can be implemented in real-world PNT networks to achieve 100 nanoseconds of accuracy for up to 100 days.
Essentials of Automations: The Art of Triggers and Actions in FMESafe Software
In this second installment of our Essentials of Automations webinar series, we’ll explore the landscape of triggers and actions, guiding you through the nuances of authoring and adapting workspaces for seamless automations. Gain an understanding of the full spectrum of triggers and actions available in FME, empowering you to enhance your workspaces for efficient automation.
We’ll kick things off by showcasing the most commonly used event-based triggers, introducing you to various automation workflows like manual triggers, schedules, directory watchers, and more. Plus, see how these elements play out in real scenarios.
Whether you’re tweaking your current setup or building from the ground up, this session will arm you with the tools and insights needed to transform your FME usage into a powerhouse of productivity. Join us to discover effective strategies that simplify complex processes, enhancing your productivity and transforming your data management practices with FME. Let’s turn complexity into clarity and make your workspaces work wonders!
Essentials of Automations: The Art of Triggers and Actions in FME
SAN eForce Sample Analysis
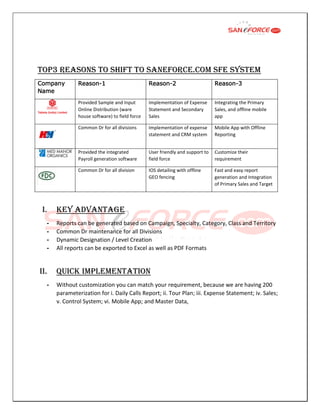
1. Top3 Reasons to shift to SANeFORCE.com SFE system
Company
Name
Reason-1 Reason-2 Reason-3
Provided Sample and Input
Online Distribution (ware
house software) to field force
Implementation of Expense
Statement and Secondary
Sales
Integrating the Primary
Sales, and offline mobile
app
Common Dr for all divisions Implementation of expense
statement and CRM system
Mobile App with Offline
Reporting
Provided the integrated
Payroll generation software
User friendly and support to
field force
Customize their
requirement
Common Dr for all division IOS detailing with offline
GEO fencing
Fast and easy report
generation and Integration
of Primary Sales and Target
i. Key Advantage
- Reports can be generated based on Campaign, Specialty, Category, Class and Territory
- Common Dr maintenance for all Divisions
- Dynamic Designation / Level Creation
- All reports can be exported to Excel as well as PDF Formats
ii. Quick Implementation
- Without customization you can match your requirement, because we are having 200
parameterization for i. Daily Calls Report; ii. Tour Plan; iii. Expense Statement; iv. Sales;
v. Control System; vi. Mobile App; and Master Data,
2. iii. Support to Head Office & Field Force
- Phone support to field force and Head office
- Email support to filed force and Head office
- Live Chat support to Head office
- Multi Lingual support to field force and Head Office Executive
- Whatsapp support to field force and Head office
iv. Mobile App and eDetailing (IOS & Android)
- Mobile App - Offline
- Mobile App – Location Tracking
- Mobile App – GEO Fencing
- E-Detailing – Offline
- E-Detailing – Location Tracking
- E-Detailing – GEO Fencing
v. BI Tool for the following
- Payroll
- Primary Sales
- Sample
- Input
3. Dashboard to Medical Rep
Benefits Of Our Dashboard
• Performance and operations of field activities done by medical reps
can be viewed in real-time through dashboards, analytics, reports.
• This will organize your Medical Rep’s Work to help with his Daily
Activities.
• This will makes the MR to Motivate Themselves.
• This will makes the MR to self analyze themselves without seeing the
reports
4. Here with we are sharing with you few of the sample report formats.
#1 :: Target Vs Sales – Primary Sales
- Primary Sales Integrated with Distribution Software.
- Periodically Primary Sales Data Integrated with SAN SFA.
- This sales information can be displayed in mobile app.
• Having goals that make you to ensure that management and staff’s
are working for a common result. As advantageous as performance
targets can be,
• Measuring your company's success through achievable goals is an
aid in analyzing areas where your business excels and where it can
be improved.
• Identifying the vital indicators of your company's success will help you
to establish the accurate performance targets.
5. #2:: Product wise Sales - Primary
• With this dashboard, you can review your marketing team’s
performance with how your monthly Product Sales is progressing.
• Identify where your sales process is most effective and where it
needs the most help. Stop wondering how you could increase
efficiency; start finding out exactly where you can improve.
6. •
#3::State wise Sales - Primary
• Our State Wise Sales dashboard is used to monitor key performance
indicators pertaining to revenue management like sales. This
Dashboard helps the Management and sales managers to effectively
increase sales & revenue for determine market trends.
• For determining sales & revenue aspect in a retail dashboard the first
requirement is to breakdown data, for seeing how much revenue is
generated from specific states and cities in each month.
7. #4::SFE Dashboard
A SFE KPI solution that is faster than all the existing analytic solutions that
helps the Top Management for the better business Analytics to get an
overall view of rich analytical graphs.
8. #5:: Benchmark Analysis
- Field Work Days
- Call Average
• Benchmarking means identifying the best practices (achieved results)
of industry leaders and then comparing your own business
performance with them.
• Our benchmark helps you in virtually all areas of your business and
be a useful tool in a business's program of continuous improvement.
• Fix the benchmark for various KPI Activities
1. Fieldwork days
2. Call Average
3. Coverage
4. Product Promotions(Priority wise)
5. Call Frequency wise
6. Joint work-call wise
9. #6:: Coverage Analysis
Coverage Analysis View:
This view enables you to examine the status of your Field
Force by displaying the following Things.
• Call Details
• Attendence
• Summary of Call Average
• Joint Work Details
• Repeated calls.
This Reports Plays an Major role in Analysing Your Field Force Activities.
10. #7:: Manager – Coverage Analysis
This Report helps you to see the No of Doctors Visited via territory Wise
#8:: Manager – Field Work Analysis
11. #9:: Joint Work
Analysis
• This Report Helps you to examine the joint work status With a
Medical Rep in Date wise for Multiple Month with many Parameters.
##10:: Visit Analysis - Category
You can create your own category. So that you can see the following things
in the report.
• Doctor call details Category-wise
• Total Dr calls with Morning and Evening calls
• Multiple Visit details such as 1 visit, 2 visit, More than 2 visit.
• Daywise details such as FW days, leave etc.
• Territory Coverage
12. ##11:: Target Vs Sales, Achievement, and Growth
- Field force
- Head Quarters
- State wise
• This report shows you the performance against monthly sales target
at the company, team and individual level.
• It’s easy for sales reps use. Opportunities automatically link to
relevant targets.
• Highly visual information on performance against target.
• Extensive drill down capability from company level performance to
sales team and individual rep.
• Growth based on last year sales for selected Month##11::
14. • Campaign Doctors- Manager wise Visit.
• Campaign Doctors- Sample and Gift Promotion.
• Campaign Doctors- Joint work Visits.
• Campaign Doctors- Business view
• Campaign Doctors-Visit Frequency
• Campaign Doctors- Specialty wise visit
• Missed Campaign Doctors View
• Effective from and to wise-campaign doctor maintenance
• Product visit- Campaign wise
• Product Priority wise- campaign doctor visit view
##12:: Deviation or Exception
• At one click, We can see all the Deviated Field Force Consolidated
For Multiple Month.
• By using Hyperlink, You can view the Exact status of the deviation.
15. ##13:: Visit Fixation by Category, Specialty, Class and
Campaign
• This Report can be generated by Specialty, class wise and campaign
wise also
• Visit can be fixed from Admin Login for specialty, class and campaign
also.
##14:: Patch wise/Clusterwise/Day plan wise/Sub area
wise/Work plan wise Visit
• This Report Helps you to examine the No of Doctors visited Datewise
in a particular territory
16. • Manager’s cluster wise report can be also seen
##15:: Campaign wise Visit
• This Report Helps you to examine the No of Doctors visited Date
wise in a particular Campaign
##16:: Visit Summary by Category / Specialty / Class /
Campaign
17. • This Report helps you to Examine the No of Doctors Visited, Multiple
times visited and Missed calls in category/Speciality/campaingn/listed
Doctor wise.
##16:: Expense statement Consolidated view
• Consolidated Expense statement generated automatically.
• You can view the statement Field Force wise as well as Manager
wise.
18. ##17:: Specialty wise Brand Exposure
• This report helps you to examine the product to the
particular(Specialized) Doctor as per Daily Call Report
##18:: Visit At a Glance
• This Report shows you the consolidated Field Force Activities for
Multiple Month.
• Analytical Report Percentage wise
19. ##19:: Input Issued at Glance
• This Report helps you to Examine about Gift Management Via Field
Force Wise
• Tracking of Gift Input Management
##20:: Sample & Input Status
• This Report helps you to Examine about Sample Dispatched via Field
Force Wise.
• Tracking of Sample Management.
20. ##21:: Coverage Analysis
Coverage Analysis View:
This view enables you to examine the status of your Field
Force by displaying the following things in FF Consalidated view.
1. Coveragewise
2. Categorywise
##22:: Secondary Sales
21. • In This Report, You can examine the Total Value of Sales for Multiple
Month in State wise
• The Above Report helps you to Examine the HQ Wise sales with
Respect to product for Multiple Month
22. • The Above Report helps you to examine the HQ Wise Profit with
respect to MR Wise.
23. The Above Report Helps you to Analyse the Following details
• Quantity and the Value of the Particular Region for Multiple month.
• The Report will be generated on Product wise Manner.
##23:: Leave Status
24. - Leave Application and Approval can be accessed from Mobile App
- Leave application is integrated with Attendance and Daily Calls
Report
##24::Listed Dr Brand wise Visit
• This Report helps you to examine the list of products tagged towards
a Doctor
25. ##25::Coverage Analysis
This report helps you to Examine the following things
• No of Doctors visited via territory type such as HQ, EX and OS.
• Session Coverage such as Morn calls, Evening Calls coverage etc.
• Based on MR
##26::Missed Call Analysis
26. All India Multiple month-missed call view
Zero time visited doctors multiple month MR Wise
Not at all visited doctors for all including MR and managers
Category wise missed doctor view
Specialty wise missed doctor view
Campaign wise missed doctor view
##27:: Tour Plan Consolidated
Advantages of our Tour Plan
• Routewise Master TP
• Monthly TP Approval -Requires Manger Aproval.
• Joint work Alerts
• TP Deviation
27. ##28:: Review Analysis for field force
• The Following Report Shows you the 360 ⁰ view of your Field Force
activities.
• It will help you to administer your entire business for an Individual FF
using just one Report
FieldForce Name: SHIVAKUMAR R - TE - ANDHERI
State: Karnataka Division: Demo Senses Pharmaceuticals Ltd
WORKING INFO MASTER INFO LISTED DR INFO
Total Working Days 25 Listed drs in List 97 Listed drs Met 63
Holiday & Sunday 3 Chemists in the List 51 Listed drs Seen 158
Leave 0 Unlisted drs in the List 98 Coverage 64.95
Fw Days 25 Stockist List 1 Call Average 6.32
Non Field Days 0 Hospital List 1 Missed Calls 34
CHEMIST INFO UNLISTED DR INFO JOINT WORK INFO
Chemist Met 3 Unlisteddr Met 7 Joint Working Days 1
Chemist Seen 3 Unlisteddr Seen 13 Joint Calls Met 1
Call Average 0.12 Call Average 0.52 Joint Calls Seen 1
Missed Calls 48 Missed Calls 91 Joint Call Avg 1
DR CATEGORY INFO SAMPLE INFO INPUT INFO
A drs in List 43 Sample Given Qty 42 Input Given Qty 8
A drs Visit 1 times Sample Given drs 3 Input Given drs 4
VIP drs in List 42 Sample Given Products 7 Input Given Products 3
VIP drs Visit 2 times
PRODUCT INFO DR CATEGORY VISIT INFO
DRS CATEGORY CALL
ADHERENCE
No of Detailing drs 145 A drs Met 38
A drs Met ( 1
times )
38
No of Rx drs A drs Seen 93 A drs Coverage 70.37
Top 5 Products A drs Coverage 70.37 A drs Missed 16
Celebrex 46 VIP drs Met 24
VIP drs Met ( 2
times )
15
28. • This integration of information from different areas helps in making
effective decisions &increases both productivity &efficiency.
##28.Single Doctor Analysis
Diovan 45 VIP drs Seen 62 VIP drs Coverage 35.71
Horlicks 42 VIP drs Coverage 57.14 VIP drs Missed 27
Complan & HI 4 VVIP drs Met 1
VVIP drs Met ( 3
times )
1
BigOut 3 VVIP drs Seen 3 VVIP drs Coverage 100
VVIP drs Coverage 100 VVIP drs Missed 0
DRS VISIT TARGET & SALE INFO OTHER INFO
1 Visit Drs 20 TARGET Total Sample Spent (in Rs/-)
2 Visit Drs 13 SECONDARY SALE 101735 Total Input Spent (in Rs/-)
3 Visit Drs 20 PRIMARY SALE Dr Service Spent (in Rs/-)
More than 3 Visit Drs 11 ACHIEVEMENT(%) Expense Spent (in Rs/-) 11320
SECONDARY SALE INFO TP INFO EXPENSE INFO
Top 5 Products Sale No. of HQ Plan 8 HQ ( - )
Neulasta 22176 No. of HQ Worked 8 EX ( - )
Cerelac 15515 No. of EX Plan 15 OS (11 Days) 3620
Magnate 14976 No. of EX Worked 13 Miscellaneous 7700
Sufrate 14504 No. of OS Plan 5 Total 11320
BigOut 9425 No. of OS Worked 5
29. This report helps you to see the entire Business Relationship between an
Individual MR and a Doctor by providing them with continuous and
personalized information and services.
Continuously engage to Doctors with
• Visit details,
• Product detailed and Sampled
• Input Given
• Listed Doctors Remarks/Feedback
• Listed Doctors Visit- Product wise
• Supportive Chemist
• RCPA Details
• CRM Details
• Business Details
30.
31. ##28:: RCPA Analysis & View
- RCPA Analysis
RCPA View
1. Ready Reckoner for competitor details.
2. Record Competitor product at doctor level with mapped chemist.
3. Gather more information about competitor knowledge.
32. 4. Add local competitor via Field Force to capture Geographical
variances.
##27::MODULES COVERED IN SANeFORCE.com
Tour Plan Daily Call
Report
Expense
Statement
RCPA Entry Secondary
Sales
Input Tracking Sample
Tracking
Leave
Application
Customer CRM Target
eLearning
Online Test
Integrate
Payslip
Integrate
Sample
Integrate Input Integrate
Primary Sales
Campaign
Analysis
Brand
Exposure
Internal
Communication
Location
Tracking
GEO fencing
Live Tracking Information
Upload
Master Upload Customer
Business
Control System