Assessment the Limit of Steel Core Area in the Encased Composite Column

This study has been carried out to evaluate the method of design of the composite column of reinforced concrete and steel structural sections in the international Codes. Studying and verifying the limit of the ratio of steel section area to total gross section area is the important aim of this research. AISC, 2005 was specifying this limit by 1.0%. Various ratios of steel core area to total gross section area were studied along with rang of concrete strength by the help of finite element software. The results show that the ratio of the steel core area to the total gross section area (As/Ag) should be replaced by the ratio of the ultimate capacity of the steel core to the total ultimate capacity of the complete composite section (Pys/P0). The new ratio takes into account the effect of relative strength between steel and concrete. The proposed limit for (Pys/P0) is between (25%) to (30%).

Recommended
Recommended
More Related Content
What's hot
What's hot (18)
Viewers also liked
Viewers also liked (17)
Similar to Assessment the Limit of Steel Core Area in the Encased Composite Column
Similar to Assessment the Limit of Steel Core Area in the Encased Composite Column (20)
Recently uploaded
Recently uploaded (20)
Assessment the Limit of Steel Core Area in the Encased Composite Column
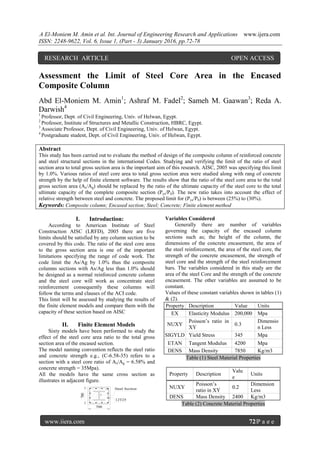
- 1. A El-Moniem M. Amin et al. Int. Journal of Engineering Research and Applications www.ijera.com ISSN: 2248-9622, Vol. 6, Issue 1, (Part - 3) January 2016, pp.72-78 www.ijera.com 72|P a g e Assessment the Limit of Steel Core Area in the Encased Composite Column Abd El-Moniem M. Amin1 ; Ashraf M. Fadel2 ; Sameh M. Gaawan3 ; Reda A. Darwish4 1 Professor, Dept. of Civil Engineering, Univ. of Helwan, Egypt. 2 Professor, Institute of Structures and Metallic Construction, HBRC, Egypt. 3 Associate Professor, Dept. of Civil Engineering, Univ. of Helwan, Egypt. 4 Postgraduate student, Dept. of Civil Engineering, Univ. of Helwan, Egypt. Abstract This study has been carried out to evaluate the method of design of the composite column of reinforced concrete and steel structural sections in the international Codes. Studying and verifying the limit of the ratio of steel section area to total gross section area is the important aim of this research. AISC, 2005 was specifying this limit by 1.0%. Various ratios of steel core area to total gross section area were studied along with rang of concrete strength by the help of finite element software. The results show that the ratio of the steel core area to the total gross section area (As/Ag) should be replaced by the ratio of the ultimate capacity of the steel core to the total ultimate capacity of the complete composite section (Pys/P0). The new ratio takes into account the effect of relative strength between steel and concrete. The proposed limit for (Pys/P0) is between (25%) to (30%). Keywords: Composite column; Encased section; Steel; Concrete; Finite element method I. Introduction: According to American Institute of Steel Construction AISC (LRFD), 2005 there are five limits should be satisfied by any column section to be covered by this code. The ratio of the steel core area to the gross section area is one of the important limitations specifying the range of code work. The code limit the As/Ag by 1.0% thus the composite columns sections with As/Ag less than 1.0% should be designed as a normal reinforced concrete column and the steel core will work as concentrate steel reinforcement consequently these columns will follow the terms and clauses of the ACI code. This limit will be assessed by studying the results of the finite element models and compare them with the capacity of these section based on AISC II. Finite Element Models Sixty models have been performed to study the effect of the steel core area ratio to the total gross section area of the encased section. The model naming convention reflects the steel ratio and concrete strength e.g., (C-6.58-35) refers to a section with a steel core ratio of As/Ag = 6.58% and concrete strength = 35Mpa). All the models have the same cross section as illustrates in adjacent figure. Variables Considered Generally there are number of variables governing the capacity of the encased column sections such as; the height of the column, the dimensions of the concrete encasement, the area of the steel reinforcement, the area of the steel core, the strength of the concrete encasement, the strength of steel core and the strength of the steel reinforcement bars. The variables considered in this study are the area of the steel Core and the strength of the concrete encasement. The other variables are assumed to be constant. Values of these constant variables shown in tables (1) & (2). Property Description Value Units EX Elasticity Modulus 200,000 Mpa NUXY Poisson’s ratio in XY 0.3 Dimensio n Less SIGYLD Yield Stress 345 Mpa ETAN Tangent Modulus 4200 Mpa DENS Mass Density 7850 Kg/m3 Table (1) Steel Material Properties Property Description Valu e Units NUXY Poisson’s ratio in XY 0.2 Dimension Less DENS Mass Density 2400 Kg/m3 Table (2) Concrete Material Properties Figure (4-2): Model Cross Section 700 700 Steel Section 12T25 RESEARCH ARTICLE OPEN ACCESS
- 2. A El-Moniem M. Amin et al. Int. Journal of Engineering Research and Applications www.ijera.com ISSN: 2248-9622, Vol. 6, Issue 1, (Part - 3) January 2016, pp.72-78 www.ijera.com 73|P a g e The values of the stress-strain curve of concrete material are based on smeared crack approach. We can summarize the curve for each group as shown in tables (3) & (4) and figure (1) and the smeared crack approach as illustrate in table (6). Group (1) fc' = 25 (Mpa) Group (2) fc' = 30 (Mpa) Group (3) fc' = 35 (Mpa) x 10-3 Mpa x 10-3 Mpa x 10-3 Mpa -0.13 -3.2 -0.13 -3.5 -0.13 -3.7 0.32 7.5 0.35 9.0 0.38 10.5 0.77 16.0 0.84 19.2 0.91 22.4 1.22 21.6 1.33 25.9 1.44 30.2 1.66 24.3 1.82 29.2 1.97 34.0 2.11 25.0 2.32 30.0 2.50 35.0 Table (3) Concrete Stress-Strain Values for (Groups 1, 2 & 3) Group (4) fc' = 40 (Mpa) Group (5) fc' = 45 (Mpa) Group (6) fc' = 50 (Mpa) x 10-3 Mpa x 10-3 Mpa x 10-3 Mpa -0.13 -4.0 -0.13 -4.2 -0.13 -4.5 0.40 12.0 0.43 13.5 0.45 15.0 0.97 25.6 1.03 28.8 1.08 32.0 1.54 34.6 1.63 38.9 1.72 43.2 2.11 38.9 2.23 43.7 2.35 48.6 2.67 40.0 2.84 45.0 2.99 50.0 Table (4-4) Concrete Stress-Strain Values for (Groups 4, 5 & 6) The models have been divided to six groups each group have different concrete strength (25, 30, 35, 40, 45, and 50 Mpa). Each group has ten specimens with different steel section profiles to produce a range of As/Ag from 0.57% to 9.76 as shown in tables (5). Model Name Steel Section As As/Ag mm2 % 1 C-0.57-25 W10x15 2800 0.58 2 C-0.86-25 W10x22 4200 0.85 3 C-1.00-25 W10x26 4900 1.00 4 C-1.16-25 W10x30 5700 1.16 5 C-2.55-25 W10x66 12500 2.55 6 C-3.35-25 W10x89 16900 3.45 7 C-5.24-25 W12x136 25700 5.25 8 C-6.59-25 W12x170 32300 6.58 9 C-8.14-25 W12x210 39900 8.14 10 C-9.76-25 W12x252 47800 9.76 Table (5) As/Ag for specimens of each groups Figure (1) shows the stress-strain curves for all groups.
- 3. A El-Moniem M. Amin et al. Int. Journal of Engineering Research and Applications www.ijera.com ISSN: 2248-9622, Vol. 6, Issue 1, (Part - 3) January 2016, pp.72-78 www.ijera.com 74|P a g e The Strain The Stress () T = fT/Ec = 1.32 e-4 fT = 0.632 fc ’ E = fE/Ec = 6.34 e-5 ( fc ’ ) fE = 0.3 fc ’ 1 = E + ¼ (0 - E) f1 = (Ec.1)/(1+(1/0)2 ) 2 = E + ½ (0 - E) f2 = (Ec.2)/(1+(2/0)2 ) 3 = E + ¾ (0 - E) f3 = (Ec.3)/(1+(3/0)2 ) 0 = 2.fc ’ /Ec = 4.23 e-4 ( fc ’ ) fc ’ Since, Ec fc ’ Table (6) Stress-Strain equations based on the smeared crack approach III. Results and Discussions A nonlinear analysis had been performed for all the models to get the failure load (P, FE Model), and in same time the maximum capacity load according to AISC-LRFD, 2005 (Pn, AISC) had been calculated. The results of both (P, FE Model) & (Pn, AISC) for each group are tabulating against two reference values as shown in tables (7) & (8) and figures from (2) to (14): 1. The ratio of the steel core area to the total gross section area (As/Ag) 2. The ratio of the ultimate capacity of the steel core to the total ultimate capacity of the complete composite section (Pys/P0) (Where; Pys = As. Fy and P0 = As . Fy + Asr . Fyr + 0.85fc’.Ac) For each group the range of (As/Ag) values will be the same (0.57, 0.86, 1.00, 1.16, 2.55, 3.35, 5.24, 6.59, 8.14 & 9.76%). However, the range of (Pys/P0) values for each group will be function of the concrete strength, which differs from group to group. As / Ag Group (1) Group (2) Group (3) Group (4) Group (5) Group (6) Pn,AISC (KN) P,FE Model (KN) Pn,AISC (KN) P,FE Model (KN) Pn,AISC (KN) P,FE Model (KN) Pn,AISC (KN) P,FE Model (KN) Pn,AISC (KN) P,FE Model (KN) Pn,AISC (KN) P,FE Model (KN) 0.57% 9,721 11,763 10,902 13,455 11,935 14,890 12,993 16,484 13,812 17,573 14,633 18,713 0.86% 9,860 11,685 11,043 13,347 12,069 14,728 13,074 16,145 13,999 17,443 14,928 18,824 1.00% 10,008 11,829 11,202 13,505 12,258 14,946 13,125 16,006 13,939 17,011 14,745 18,063 1.16% 10,171 11,992 11,375 13,680 12,336 14,873 13,313 16,185 14,166 17,264 14,954 18,249 2.55% 11,304 12,378 12,563 14,031 13,930 16,006 14,993 17,351 15,943 18,492 16,922 19,751 3.45% 12,099 12,922 13,396 14,593 14,582 16,084 15,566 17,182 16,859 19,015 17,804 20,117 5.24% 14,579 15,541 16,019 17,418 17,165 18,708 18,295 20,006 19,568 21,658 20,591 22,796 6.59% 16,339 17,499 17,877 19,530 19,074 20,887 20,279 22,291 21,478 23,718 22,572 24,949 8.14% 18,221 19,405 19,827 21,538 21,086 22,967 22,344 24,431 23,541 25,796 24,672 27,046 9.76% 20,310 21,651 22,000 23,921 23,183 25,140 24,514 26,715 25,782 28,188 26,975 29,521 Table (7) The Results of all groups (1 of 2) As / Ag Group (1) Group (2) Group (3) Group (4) Group (5) Group (6) Pys / P,FE Model / Pys / P,FE Model / Pys / P,FE Model / Pys / P,FE Model / Pys / P,FE Model / Pys / P,FE Model / P0 Pn,AISC P0 Pn,AISC P0 Pn,AISC P0 Pn,AISC P0 Pn,AISC P0 Pn,AISC 0.57% 0.071 1.210 0.062 1.234 0.055 1.248 0.049 1.269 0.044 1.272 0.040 1.279 0.86% 0.103 1.185 0.090 1.209 0.080 1.220 0.072 1.235 0.065 1.246 0.060 1.261 1.00% 0.118 1.182 0.103 1.206 0.092 1.219 0.083 1.220 0.075 1.220 0.069 1.225 1.16% 0.135 1.179 0.118 1.203 0.106 1.206 0.095 1.216 0.087 1.219 0.079 1.220 2.55% 0.257 1.095 0.230 1.117 0.208 1.149 0.189 1.157 0.174 1.160 0.161 1.167 3.45% 0.320 1.068 0.289 1.089 0.263 1.103 0.241 1.104 0.223 1.128 0.207 1.130 5.24% 0.421 1.066 0.386 1.087 0.355 1.090 0.330 1.094 0.307 1.107 0.288 1.107 6.59% 0.481 1.071 0.444 1.092 0.412 1.095 0.385 1.099 0.361 1.104 0.340 1.105 8.14% 0.537 1.065 0.500 1.086 0.468 1.089 0.440 1.093 0.415 1.096 0.392 1.096 9.76% 0.585 1.066 0.549 1.087 0.517 1.084 0.488 1.090 0.463 1.093 0.440 1.094 Table (8) The Results of all groups (2 of 2)
- 4. A El-Moniem M. Amin et al. Int. Journal of Engineering Research and Applications www.ijera.com ISSN: 2248-9622, Vol. 6, Issue 1, (Part - 3) January 2016, pp.72-78 www.ijera.com 75|P a g e Figure (2) shows the result of study (As/Ag) for Group (1) Figure (3) shows the result of study (As/Ag) for Group (2) Figure (4) shows the result of study (As/Ag) for Group (3) Figure (5) shows the result of study (As/Ag) for Group (4) Figure (6) shows the result of study (As/Ag) for Group (5) Figure (7) shows the result of study (As/Ag) for Group (6)
- 5. A El-Moniem M. Amin et al. Int. Journal of Engineering Research and Applications www.ijera.com ISSN: 2248-9622, Vol. 6, Issue 1, (Part - 3) January 2016, pp.72-78 www.ijera.com 76|P a g e Figure (8) shows the result of study (Pys/P0) for Group (1) Figure (9) shows the result of study (Pys/P0) for Group (2) Figure (10) shows the result of study (Pys/P0) for Group (3) Figure (11) shows the result of study (Pys/P0) for Group (4) Figure (12) shows the result of study (Pys/P0) for Group (5) Figure (13) shows the result of study (Pys/P0) for Group (6)
- 6. A El-Moniem M. Amin et al. Int. Journal of Engineering Research and Applications www.ijera.com ISSN: 2248-9622, Vol. 6, Issue 1, (Part - 3) January 2016, pp.72-78 www.ijera.com 77|P a g e Figure (14) shows the result of study (Pys/P0) for all Groups in one graph According to the figures of (As/Ag) against (P, FE Model) & (Pn,AISC) it is observed that for all values of (As/Ag) more than certain limit, the curves of (Pn, AISC) were spaced constantly from the curves of (P, FE Model). For the values of (As/Ag) less than this limit, the curves of the (Pn, AISC) were deviated from the curves of (P, FE Model). This limit is specifying the borderline for the range of application of the code. For the values of (As/Ag) more than this limit, the code results were matching with finite element results. However, for (As/Ag) values less than this limit the results of code were not matching with the finite element results. The limit of (As/Ag) ranges from (1.9%) for group (1) to (4.2%) for group (6). Which means that limit differs from a group to another and the change in concrete strength and consequently the relative strength between steel core and concrete encasement will lead to change in the limit value. The results of the figures (Pys/P0) against (P, FE Model) & (Pn,AISC) is showing that there is a limit of (Pys/P0), For the values of (Pys/P0) more than this limit the results of the code are matching with the finite element results and beyond this limit the results of the code are not matching with finite element results. The limit of (Pys/P0) was the same for all groups and its value ranged between (0.25) to (0.3). Figure (4- 16) illustrates the relations between (Pys/P0) and the normalized curves for (P, FE Model / Pn, AISC) and was leading to the same limit. According to the AISC code this limit are specifying by the ratio of (As/Ag) and equals 1.0%. The results obtained from the finite element analysis were showing that the ratio of (As/Ag) are ignoring the effect of the relative strength of the steel core with respect to the strength of the concrete and steel reinforcement. For more explanation, if there are two encased columns with the same (As/Ag) ratio and the steel core of the first column has a poor steel strength and the other column has a steel core with high steel strength and all the other parameters are the same. It is not accurate to assume that both columns will have the same classification against code limit of application regardless the effects of the relative strength. If we use the ratio of (Pys/P0) to specify the limit of codes application, it will consider the relative strength for the components of the encased sections. IV. CONCLUSION AND RECOMMENDATIONS From The results obtained, we can conclude the following: Specifying the limit on which the composite actions between the steel and concrete will start to be significant, cannot be accurate enough if we use a ratio of steel core area to the gross section area (As/Ag) as a reference. The ratio of the ultimate capacity of the steel core to the total ultimate capacity of the complete composite section (Pys/P0) will be efficiently representing this limit. It is suggested to change the limit of the ratio of steel core area to the gross section area (As/Ag) to be the ratio of the ultimate capacity of the
- 7. A El-Moniem M. Amin et al. Int. Journal of Engineering Research and Applications www.ijera.com ISSN: 2248-9622, Vol. 6, Issue 1, (Part - 3) January 2016, pp.72-78 www.ijera.com 78|P a g e steel core to the total ultimate capacity of the complete composite section (Pys/P0). The limit for the ratio of (Pys/P0) can be specified with a value between (25 to 30%). References [1.] American Institute of Steel Construction (AISC-LRFD). (2005). Load and resistance factor design specification for steel building. [2.] Dong Keon Kim, “A Database for composite columns”, School of Civil and Environmental Engineering Georgia Institute of Technology, (2005). [3.] Enrico Spacone and Sherif El-Tawil, "Nonlinear analysis of steel-concrete composite structures: State of the Art", Journal of Structural Engineering, 2004. [4.] Joao Batista Marques de Sousa Jr. and Rodrigo Barreto Caldas, “Numerical Analysis of composite Steel-Concrete Columns of Arbitrary Section”, Journal of Structural Engineering, 2005. [5.] K. M. Yee, Dr H. Shakir-Khalil and R. Taylor, “Design Expressions for a New Type of Composite Column”, Department of civil engineering, Simon Engineering laboratories, university of Manchester, 1982. [6.] Min-Lang Lin and Keh-Chyuan Tsai, "Mechanical Behavior of Double-Skinned Composite Steel Tubular Columns", National center for research on earthquake engineering, Taipei, Taiwan, 2002. [7.] Roberto t. Leon and Jerome f. Hajjar, “Limit State Response of Composite Columns and Beam-Columns", Journal of Structural Engineering, 2008. [8.] S. A. Mirza, F. and E. A. Lacroix, “Comparative Strength Analyses of Concrete-Encased Steel Composite Columns”, Journal of Structural Engineering, 2004. [9.] S.F. Chen, J. G. Teng, and S. L. Chen, "Design of Biaxially Loaded Short Composite Columns of Arbitrary Section," Journal of Structural Engineering, 2001. [10.] Sherif El-Tawil, and Gregory G. Deierlein, "Strength and Ductility of Concrete Encased Composite Columns", Journal of Structural Engineering, 1999.