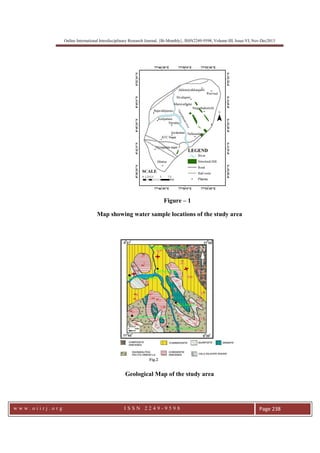
Online International Interdisciplinary Research Journal, {Bi-Monthly}, ISSN2249-9598, Volume-III, Issue-VI, Nov-Dec2013
w w w . o i i r j . o r g I S S N 2 2 4 9 - 9 5 9 8 Page 230
Arsenic Contamination of Groundwater in Vallanadu Region of
Tuticorin District, Tamilnadu, India
a
Manimaran D, a
Manimaran G
a
Department of Geology, V.O.Chidambaram College, Thoothukudi-628008, Tamilnadu,
India
The study area covers downstream of Thambraparani River about 400 Km2
of Tuticorin
and Tirunelveli districts of Tamilnadu. Thirty six groundwater samples have been
collected and analysed for major ions, iron and arsenic. The arsenic concentration varies
between 0.003 to 0.017 mg/l. The slightly high concentration of arsenic is found at
Kilpattam and northern Vallanadu located near Thambraparani river sites and at
Akanayakkanpatti, Melpuvani and kilpuvani located away from Thambraparani, but
connected with lineaments which may facilitated the migration of arsenic from pre-
monsoon. Kilpattam site to other isolated sites located at lithological boundaries. At
present the main source of arsenic is identified from pesticides used for agriculture
activities and automobile diesel wastage materials directly discharged into the course of
Thambraparani especially at the upstream side. Though the arsenic content of
groundwater is slightly higher >0.01 mg/l, it is recommended to curtail the used arsenic
bearing pesticides for agriculture activities and usage of arsenic filters at the sites of
pumping stations of Thambraparani drinking water system and at effluents sites of
automobile and industrial sites at upstream area of Thambraparani river.
KEYWORDS: Groundwater quality, Arsenic contamination, Tuticorin Thambraparani
river, Pesticides, Automobile wastage.
Introduction
Over exposure to arsenic is one of the most widespread Medical geology problems
affecting more than one hundred million people in Bangladesh, India, China, Europe,
Africa and North and South America. Arsenic, a metalloid, occurs naturally, being the
twentieth most abundant element in earth’s crust and is a component of more than 245
minerals. The inorganic forms consisting mostly of arsenite and arsenate compounds are
toxic to human health. Humans are exposed to arsenic primarily from air, food and water.
Arsenic is a minor constituent of some common minerals, and dissolved arsenic
concentrations greater than 1 µg/L are common in groundwater. In some aquifers and
under certain conditions, much greater arsenic concentrations can be found, and
concentrations above 10 µg/L are not uncommon. However, elevated arsenic level in
drinking water is the major cause of arsenic toxicity in the world. Reports of arsenic
contamination in water are available from more than 30 countries in the world. In India,
though cases of arsenic toxicity including liver fibrosis due to drinking of arsenic
contaminated water were reported from Chandigarh in early 1978, occurrence of large
number of cases of arsenic induced skin lesions were reported from Kolkata, West
Bengal in 1984. Oxidation technologies that effectively convert arsenite to arsenate
include the use of ozone, chlorine, and hydrogen peroxide (U.S. EPA, 1999). Oxidation
Abstract
Online International Interdisciplinary Research Journal, {Bi-Monthly}, ISSN2249-9598, Volume-III, Issue-VI, Nov-Dec2013
w w w . o i i r j . o r g I S S N 2 2 4 9 - 9 5 9 8 Page 231
of arsenite into arsenate has also proven effective in the presence of manganese oxide and
iron oxide (Bajpai and Chaudhuri, 1999; Wang et al., 2000). Vallanadu is a major
panchayat in the Tuticorin District of Tamilnadu. The study area (Fig.1) is comprised of
the toposheet no. 58H/13 and 58H/14 of 1: 50,000 scales published by the Survey of
India in the year 1969. Vallanadu lies about 30Km west of Tuticorin, which has both rail
and Airbase connections. The district receives the rain under the influence of both
southwest and northeast monsoons. The rainfall was gradually increases towards south,
west and north and attains a maximum around Kayattar (722.5 mm) and Kovilpatti (734.8
mm) in the northwestern part. The district enjoys a hot tropical climate. The high relative
humidity prevails throughout the year between 60 and 75%. The annual mean minimum
and maximum temperature are 23°C and 40°C respectively.
Geology of the study area
Rocks of the Proterozoic to Archaean age are extensively exposed in the various parts of
the State. The sediments ranging in age from the Gondwanas to Recent are mostly
confined to the eastern coast. The crystalline rocks exposed in this part of the peninsular
shield include the rocks of the Charnockite Group, the Khondalite Group and gneisses
and schists, traversed by ultramafic, basic, granite and syenite intrusives. About 90% of
the district is made up of crystalline rocks of Proterozoic group comprising of
Charnockites, Garnetiferous biotite gneiss, Quartzite etc., Kurumalai and Vallanadu
hillocks are structural features. Few inselbergs are seen in the plain. Pediments, rocky
pediments, buried pediments and valley fills are the other landforms in the district. The
Vallanadu area is a high grade metamorphic terrain of almandine amphibolite to granulite
facies. The area is essentially comprised of different lithotypes i.e., quartzites, calc-
silicate rocks, Khondalites, Composite gneisses, Cordierite gneiesses, charnockites, Grey
granites and pink granites and veins of pyroxene granulites and amphibolites.
Khondalites of vallanadu area of Kerala Khondalite Belt (KKB) are represented by
pelitic, Semipelitic, psammitic and calcareous members. The distribution of various
lithotypes of the area is shown in (Fig.2). Arsenic content is not reported from the
lithounits of the study area or it is below detectable limit.
METHODOLOGY
Thirty six groundwater samples were collected from various locations in pre-monsoon
and post monsoon of each. The water samples were collected in 200 ml plastic bottles for
trace elements analysed and another1000 ml for major cation and anion study, which
were corked immediately to make them airtight. Samples were acidified with
concentrated nitric acid (HNO3) for determination of trace elements to prevent any
reaction. The physical parameters such as pH, EC, TDS and temperature were measured
in the field. The major cations and anions were analysed at Spic Research Centre,
Tuticorin and Trace elements analysed at NGRI, Hyderabad, using ICP-MS.
Water resource in the study area
Surface water
Online International Interdisciplinary Research Journal, {Bi-Monthly}, ISSN2249-9598, Volume-III, Issue-VI, Nov-Dec2013
w w w . o i i r j . o r g I S S N 2 2 4 9 - 9 5 9 8 Page 232
The river originating from the Western Ghats of Tamil Nadu is a major river draining the
study area. It is perennial in nature and flooding is generated in heavy rainfall period
only. The Chittar river, a tributary of Tambraparani river joint at Sivalaperi.
Groundwater potential Scenario of the study area
The geology of the area is mainly composed of hard rocks and the fractured and well
jointed nature of the rocks provide good amount of groundwater. Comparatively the
gneissic rocks are with high groundwater potential owing to the weathering and
fracturing for a considerable depth. Charnockites are low in water potential but well
jointed, sheared Charnockites are good for groundwater potential. Quartzites are mostly
granular, well jointed, cracked and fissured and these properties are reasons behind
Groundwater potential of quartzites. The open wells of the area vary in depth from 10 to
40 meters. The important aquifer systems in the district are constituted by (i)
unconsolidated and semi-consolidated formations and (ii) weathered and fractured
crystalline rocks. The porous formations in the district include sandstones and clays of
recent to sub-recent and tertiary age (quaternary). The recent formations comprising
mainly sands, clays and gravels are confined to major drainage courses in the district. The
maximum thickness of alluvium is 45.0m bgl; whereas the average thickness is about
25.0m. Ground water occurs under water table and confined conditions in these
formations and is being developed by means of dug wells and filter points11, 12. The
productive zones are encountered in the depth range of 29.5 to 62m bgl. Alluvium,
which forms a good aquifer system along the Tambraparani river bed which is one of the
major sources of water supply to the villages. The water bearing properties of crystalline
formations which lack primary porosity depend on the extent of development of
secondary intergranular porosity. The occurrence and movement of ground water in these
rocks are under unconfined conditions in the joints and fissures and dependent on the
nature and extent of pores and interconnection of fractures zones. The yield
characteristics of wells vary considerably depending on the topographic set-up, lithology
and nature of weathering.
Hydrogeochemistry
Hydrogeochemistry of groundwater is a dynamic process, which undergoes a constant
change with reference to time and space. The geochemical quality of groundwater is also
related to the nature of host rock as well as the overlying rock types. Geochemical
character of groundwater is an essential component of scientific management of existing
groundwater resources. In the present study an attempt has been made to identify the
suitability of existing groundwater with reference to drinking, domestic, industrial and
irrigational needs. The quality of groundwater is as important as its quantity. All
groundwater contains dissolved solids in solution that are derived from the location due
to movement of the water. In order to carry out the objectives water samples collected
from different locations are analysed to evaluate groundwater quality. The collection and
testing of water samples is a very important operation in any water quality study. To
analyse the groundwater quality, the groundwater should be collected in one liter capacity
polythene bottles after rinsing the bottle with the water, which is to be sampled and the
sample collected and sealed tightly. Sample should be collected from a well, only after it
Online International Interdisciplinary Research Journal, {Bi-Monthly}, ISSN2249-9598, Volume-III, Issue-VI, Nov-Dec2013
w w w . o i i r j . o r g I S S N 2 2 4 9 - 9 5 9 8 Page 233
has been pumped for sometimes, otherwise non-representative samples of stagnant or
contaminated water may be obtained. Water samples have been collected from the
existing bore wells and open well sources in 36 locations of the study area. Water
samples have been analysed for major cations such as Ca, Mg, Na, and K and anions –
CO3, HCO3, SO4 and Cl and TDS, pH etc.
Results and Discussion
Total Dissolved Solids
Total dissolved solids of the ground water estimated for following locations are above
1000mg/l, namely Vallanadu south (Loc. no.1), Vallanadu north (Loc.no.2), Ariyakulam
(Loc.no.3), Thiyagarayanagar (Loc.no.5), Kilpattam (Loc.no.10), Papayapuram
(Loc.no.12), Melapalamadai (Loc.no.13), Sivalaperi (Loc.no.15), Maruvathalai
(Loc.no.17&18), Savalaperi (Loc.no.19&20), Puliyampatti (Loc.no.21&22),
Lakshmipuram (Loc.no.24&25), Akanayakkanpatti (Loc.no.28) and Kilpuvani
(Loc.no.32). While TDS is below 1000 mg/l, in other areas like KTC nagar (Loc.no.4),
Rajagopalapuram (Loc.no.6), Muthur (Loc.no.7&), Thiruthu (Loc.no.9), Melpattam
(Loc.no.11), Rajavallipuram (Loc.no.14), Sivalaperi (Loc.no.16), Puliyampatti
(Loc.no.23), Akanayakkanpatti (Loc.no.26&27), Melpuvani (Loc.no.29,30&31),
Kilpuvani (Loc.no.33), Singathakurichi (Loc.no.35) and Kasilingapuram (Loc.no.36), all
above water indicate their suitable nature for drinking and domestic purposes.
Groundwater Hardness
If the hardness is too low the water can be quite corrosive leaching copper and lead out
of plumbing pipes. With very low hardness there would also be low levels of beneficial
ions in the water, especially calcium and magnesium. If hardness is too high it can have
an unpleasant taste, can dry out skin and cause scaling on fixtures and throughout the
water distribution system. This scaling is undesirable because it begins to decrease the
efficiency of plumbing systems, which results in greater power consumption and
increased costs. With reference to BIS, Indian Standards (IS 10500:1991) desirable limit
up to 300 mg/l, permissible limit up to 600 mg/l. (Table 1).
Arsenic concentration at Kilpattam in the pre-monsoon (Fig.3) and five places at
Vallanadu north, Kilpattam, Akanayakkanpatti, Melpuvani and Kilpuvani in the post
monsoon (Fig.4), where its concentration exceeded permissible limit of 0.01 mg/l (Table
3). In rest of places the concentration of arsenic is in the range from 0.03 to 0.009 mg/l in
the pre-monsoon and 0.003 to 0.007 mg/l in the post monsoon. The Arsenic compounds
are found both in tri and pentavalent forms in ground water, of which trivalent is more
hazardous than the latter. The permissible limit of arsenic in drinking water is 0.01 mg/l
(10 ppb/l) and if consumption exceeds this limit and exposed for a long period, it may
lead to many health hazards like gastro intestinal tract ulcers, various skin ulcers and
tumors. Arsenic is a naturally occurring trace element found in rocks, soils and the water
in contact with them. It has been recognized as a toxic element and is considered a human
health hazard. As per the BIS Standard for drinking water the maximum permissible limit
of Arsenic concentration in ground water is 0.01 mg/l. In 2010, the jointFAO/WHO
committee on food additives (WHO, 2010) withdrew the previous established provisional
Online International Interdisciplinary Research Journal, {Bi-Monthly}, ISSN2249-9598, Volume-III, Issue-VI, Nov-Dec2013
w w w . o i i r j . o r g I S S N 2 2 4 9 - 9 5 9 8 Page 234
tolerable weekly intake (PTWI) of Arsenic, i.e. 15 µg/kg body weights (equivalent to 2.1 µg/kg
body weight/per day). This was becausethe benchmark dose for a 0.5 % increased
incidence of lung cancer (BMDL 0.5 )w a s d e t e r mi n e d t o b e 3 . 0 µ g
A r s e n i c / k g b o d y w e i g h t / d a y ( 2 – 7 µ g/ k g bodyweight/day), based on the
range of estimated total dietary exposure. Iron concentration is widely distributed with
various proportions in the study area. In about 100% of samples Fe concentration is
exceeded the permissible limit of 0.3 mg/l in pre-monsoon and post monsoon (Table 2)
(Fig.5 and 6 respectively). Iron, the second most abundant element by weight in the
earth’s crust, is normally present in ground water in the ferrous form (Fe++), which is a
soluble state and easily oxidized to trivalent ferric iron (Fe+++). Aeration of iron can
affect the quality of both ground water and surface water. Iron rich ground water would
affect the soil drainage with the deposition of ferric hydroxide on the surface. Dissolution
of iron occurs as a result of oxidation and decrease of pH.
The high content of the arsenic in groundwater may be attributed to the common
occurrence of pyrite, pyrhotite, magnatite and ilmenite-iron bearing minerals in gneisses
and charnockites of the study area. The relative low values of dissolved iron (<0.7 mg/l)
in the middle Ganga plains (i.e. Uttarpradesh and Bihar) compared to higher values in the
West Bengal (upto 36 mg/l) and Bangladesh (upto 30 mg/l0 indicate that the middle
Ganga plain environment may not be sufficiently reducing to mobile iron and arsenic in
groundwater (nickson et al. 1998). In the study area the weathering and large limestone
quarry activities might have released the iron in the groundwater so as to form the
reducing water environment which the facilitated releasing of arsenic content in
groundwater. In general, As and Fe concentration is decreasing from top to bottom in
sediment samples of diesel locomotive works hole ranges with a mean of 4-8 mg/kg and
mean of 361 mg/kg respectively are reported from Varanasi environs of Ganga river
basin (Janardhan Raju, 2012). On considering environs of the study area, the source of
arsenic there is four possibilities.
1. Arsenic containing pesticides (sodium arsenite or lead arsenate.
2. Arsenic dusts and gases, released during cement manufacture and mining waste dusts.
3. Paper manufacturing unit and textile unit, pH-mediated industrial effluents and tailing
ponds (Swapna
Mukherjee, 2011).
4. Arsenic bearing automobile diesel wastage materials normally fed into the
Thambraparani river, since it is a
lowest contour of the area.
The above source areas are situated in the upstream side of the study area. During the
pre-monsoon period, arsenic concentration is located at Kilpattam site where
Thambraparani river is showing meandering site and join with Chithar river. But during
the post monsoon the arsenic concentration are located at five locations of lithological
contact boundaries of granite/gneisses; gneiss and charnockite and also along
Thambraparani river course. The concentration of arsenic seems to be migrated from
Kilpattam area to the other areas like northern Vallanadu, Kilpuvani, Melpuvani and
akanayakkanpatti during the rainy season through the lineaments during the post
monsoon period.
Online International Interdisciplinary Research Journal, {Bi-Monthly}, ISSN2249-9598, Volume-III, Issue-VI, Nov-Dec2013
w w w . o i i r j . o r g I S S N 2 2 4 9 - 9 5 9 8 Page 235
Conclusion:
The slightly high arsenic content of groundwater in isolated locations are mainly due to
migration of arsenic along Thambraparani river and along the lineaments so as to
concentrate at lithological contacts. The arsenic main sources are usage of pesticides in
the upland agricultural activity and from automobile diesel waste effluent discharge into
the Thambraparani river course. Since arsenic content of lithology of the study area and
surrounding environs are below detectable limits, not reported in earlier rocks analyses.
It seems mining activities and cement industries are not causative factors for arsenic
contaminants of Thambraparani river sites and adjoining sites connected with lineaments.
Since textile and paper industries in the upstream site of Thambraparani are very few,
their contributions to arsenic contamination are very less. All types of arsenic exposure
can cause kidney and liver damage and in most severe exposure there is erythrocyte
hemolysis (Swapna mukherjee, 2011). One sign of acute exposure is edema of the
eyelids and gastrointestinal irritation and both central and peripheral neuropathies
frequently occur. During chronic intoxication “garlic breath”, skin sensitivity, dermatitis
and keratitus frequently occur. It is recommended to invest in an arsenic water filter or
low cost chemical pockets for reducing arsenic content can be used. If drinking water
contains arsenic, looks for an alternative source of water, which has no arsenic
contaminants. It is also recommended to educate the farmers not to use arsenic bearing
pesticides for agriculture activities and also to execute arsenic filters at effluent discharge
sites of industrial and automobile activities and at the sites of pumping stations for
Thambraparani drinking water system.
Acknowledgement
The authors are thankful to Shri.A.P.C.V.Chockalingam, Secretary, Dr.C.Veerabahu,
Principal, V.O.Chidambaram College, Tuticorin, Mr.Rajendran, SPIC Research Centre,
Tuticorin and Dr.B.Sathyanarayanan, Scientist, NGRI, Hyderabad, South India.
References
1. Bajpai, S. and Chaudhuri, M. 1999. Removal of arsenic from ground water by
manganese dioxide-coated sand. J. Environ. Eng. 125(8): 782-784.
2. Carrol A., Rain water as a chemical agent of ologic process –A review, U.S
Geologicalsurvey water-supply, 97-
104 (1962).
3. Chakraborti D, Rahman MM, Paul K, Sengupta MK, Chowdhury UK, Lodh D, et al.
Arsenic calamity
in India and Bangladesh sub-continent-whom to blame? Talanta 2002; 58 : 3-22.
4. Datta DV, Mitra SK, Chhuttani PN, Chakravarti RN. Chronic oral arsenic intoxication
as a possible
aetiological factor in idiopathic portal hypertension (non-cirrhotic portal fibrosis) in
India. Gut 1979; 20 : 378-84.
Online International Interdisciplinary Research Journal, {Bi-Monthly}, ISSN2249-9598, Volume-III, Issue-VI, Nov-Dec2013
w w w . o i i r j . o r g I S S N 2 2 4 9 - 9 5 9 8 Page 236
5. FAO/WHO. 2011. Codex committee on contaminants in foods. Joint
FAO/WHO
foodstandards programme. Food and Agriculture Organization of the United Nations
andthe World Health Organization, Rome. 28 pp.
6. Garai R, Chakraborty AK, Dey SB, Saha KC. Chronic arsenic poisoning from
tubewell water. J Indian
Med Assoc 1984; 82 : 34-5.
7. Gibbs R.J., Mechanisms controlling world water chemistry. Science 170, 1088–1090
(1970)
8. Janardhan Raju, N. (2012) Arsenic exposure through groundwater in the middle
Ganga plain in the Varanasi
environs, India: A future threat, Jur. Geol. Soc. India, V.79, pp 302-314.
9. Nickson, R.T., McArthur, J., Burgess, W., Ahmed, K.M., Ravenscroft, P and
Rahman, M (1998) Arsenic
poisoning of Bangladesh groundwater. Nature V.395, pp 338.
10. Ridchards, C.A.,Diagnosis and improvement of saline alkali soils, USDA handbook,
60, 160p (1954).
11. Ryzner, J.W A new index for determining amount of calcium carbonate scale formed
by water , J.Amer ,
W.W.Assn., 36,472 – 486p (1944).
12. Sawyer, C.N Chemistry for sanitoary engineers, and P.L. Mc CARTY 2nd., Mc Graw
Hill,New York, 518p
(1987).
13. Todd., Ground water hydrology, John Wiley,535p (1980).
14. Stuyfzand P.J(1989) A new hydro chemical Classification of water types,
proc.IAHS 3, Science
association,Baltimore,USA,p.33-42 (1989).
15. Swapna Mukherjee (2011) Applied mineralogy: Applications in Industry and
Environment. Capital
publishing company, New Delhi, 575p.
16. U.S. EPA, MSE Technology Applications, Inc. 1999. Final report- arsenic oxidation
demonstration project,
mine waste technology program, activity III, Project 7. MWTP- 84. United States
Environmental Protection
Online International Interdisciplinary Research Journal, {Bi-Monthly}, ISSN2249-9598, Volume-III, Issue-VI, Nov-Dec2013
w w w . o i i r j . o r g I S S N 2 2 4 9 - 9 5 9 8 Page 237
Agency, National Risk Manaagement Research Laboratory, Office of Research and
Development, Cincinnati,
Ohio.
17. Wang, L., Chen, A., Fields, K. 2000. Arsenic removal from drinking water by ion
exchange and activated
alumina plants. EPA/600/R-00/088. United States Environmental Protection Agency,
Water Supply and Water Resources Division, National Risk Management Research
Laboratory, Cincinnati, Ohio.
Table -1 Groundwater hardness classification of the study area
Hardness (mg/l) Water Class Sample location nos.
0 - 75 Soft 6,7, 11,27, 30, 34, 35, 36
75 – 150 Moderately hard 8, 14, 16, 31, 33
150 – 300 Hard 9, 23, 29
>300 Very hard
1, 2, 3, 4, 5, 10, 12, 13, 15, 17,
18, 19, 20, 21, 22, 24, 25, 26,
28, 32
Table- 2. Distribution of Iron concentration in groundwater (mg/l)
Table- 3. Distribution of Arsenic concentration in groundwater (mg/l)
Sl.
No.
Iron concentration range
Pre-monsoon Post monsoon
No. of
samples
Percentage No. of
samples
Percentage
1 <0.3 Nil - Nil -
2 >0.3 36 100 36 100
Sl.
No.
Iron concentration range
Pre-monsoon Post monsoon
No. of
samples
Percentage No. of
samples
Percentage
1 <0.01 34 97.22 31 86.11
2 >0.01 1 2.78 5 13.89
Online International Interdisciplinary Research Journal, {Bi-Monthly}, ISSN2249-9598, Volume-III, Issue-VI, Nov-Dec2013
w w w . o i i r j . o r g I S S N 2 2 4 9 - 9 5 9 8 Page 238
Figure – 1
Map showing water sample locations of the study area
Geological Map of the study area
Online International Interdisciplinary Research Journal, {Bi-Monthly}, ISSN2249-9598, Volume-III, Issue-VI, Nov-Dec2013
w w w . o i i r j . o r g I S S N 2 2 4 9 - 9 5 9 8 Page 239
Figure-3. Arsenic distribution in groundwater sample (Pre-monsoon)
Online International Interdisciplinary Research Journal, {Bi-Monthly}, ISSN2249-9598, Volume-III, Issue-VI, Nov-Dec2013
w w w . o i i r j . o r g I S S N 2 2 4 9 - 9 5 9 8 Page 240
Figure-4. Arsenic distribution in groundwater sample (Post monsoon)
Online International Interdisciplinary Research Journal, {Bi-Monthly}, ISSN2249-9598, Volume-III, Issue-VI, Nov-Dec2013
w w w . o i i r j . o r g I S S N 2 2 4 9 - 9 5 9 8 Page 241
Figure-5. Iron distribution in groundwater sample (Pre-monsoon)
Online International Interdisciplinary Research Journal, {Bi-Monthly}, ISSN2249-9598, Volume-III, Issue-VI, Nov-Dec2013
w w w . o i i r j . o r g I S S N 2 2 4 9 - 9 5 9 8 Page 242
Figure-6. Iron distribution in groundwater sample (Post monsoon)

Arsenic

  • 1.
    Online International InterdisciplinaryResearch Journal, {Bi-Monthly}, ISSN2249-9598, Volume-III, Issue-VI, Nov-Dec2013 w w w . o i i r j . o r g I S S N 2 2 4 9 - 9 5 9 8 Page 230 Arsenic Contamination of Groundwater in Vallanadu Region of Tuticorin District, Tamilnadu, India a Manimaran D, a Manimaran G a Department of Geology, V.O.Chidambaram College, Thoothukudi-628008, Tamilnadu, India The study area covers downstream of Thambraparani River about 400 Km2 of Tuticorin and Tirunelveli districts of Tamilnadu. Thirty six groundwater samples have been collected and analysed for major ions, iron and arsenic. The arsenic concentration varies between 0.003 to 0.017 mg/l. The slightly high concentration of arsenic is found at Kilpattam and northern Vallanadu located near Thambraparani river sites and at Akanayakkanpatti, Melpuvani and kilpuvani located away from Thambraparani, but connected with lineaments which may facilitated the migration of arsenic from pre- monsoon. Kilpattam site to other isolated sites located at lithological boundaries. At present the main source of arsenic is identified from pesticides used for agriculture activities and automobile diesel wastage materials directly discharged into the course of Thambraparani especially at the upstream side. Though the arsenic content of groundwater is slightly higher >0.01 mg/l, it is recommended to curtail the used arsenic bearing pesticides for agriculture activities and usage of arsenic filters at the sites of pumping stations of Thambraparani drinking water system and at effluents sites of automobile and industrial sites at upstream area of Thambraparani river. KEYWORDS: Groundwater quality, Arsenic contamination, Tuticorin Thambraparani river, Pesticides, Automobile wastage. Introduction Over exposure to arsenic is one of the most widespread Medical geology problems affecting more than one hundred million people in Bangladesh, India, China, Europe, Africa and North and South America. Arsenic, a metalloid, occurs naturally, being the twentieth most abundant element in earth’s crust and is a component of more than 245 minerals. The inorganic forms consisting mostly of arsenite and arsenate compounds are toxic to human health. Humans are exposed to arsenic primarily from air, food and water. Arsenic is a minor constituent of some common minerals, and dissolved arsenic concentrations greater than 1 µg/L are common in groundwater. In some aquifers and under certain conditions, much greater arsenic concentrations can be found, and concentrations above 10 µg/L are not uncommon. However, elevated arsenic level in drinking water is the major cause of arsenic toxicity in the world. Reports of arsenic contamination in water are available from more than 30 countries in the world. In India, though cases of arsenic toxicity including liver fibrosis due to drinking of arsenic contaminated water were reported from Chandigarh in early 1978, occurrence of large number of cases of arsenic induced skin lesions were reported from Kolkata, West Bengal in 1984. Oxidation technologies that effectively convert arsenite to arsenate include the use of ozone, chlorine, and hydrogen peroxide (U.S. EPA, 1999). Oxidation Abstract
  • 2.
    Online International InterdisciplinaryResearch Journal, {Bi-Monthly}, ISSN2249-9598, Volume-III, Issue-VI, Nov-Dec2013 w w w . o i i r j . o r g I S S N 2 2 4 9 - 9 5 9 8 Page 231 of arsenite into arsenate has also proven effective in the presence of manganese oxide and iron oxide (Bajpai and Chaudhuri, 1999; Wang et al., 2000). Vallanadu is a major panchayat in the Tuticorin District of Tamilnadu. The study area (Fig.1) is comprised of the toposheet no. 58H/13 and 58H/14 of 1: 50,000 scales published by the Survey of India in the year 1969. Vallanadu lies about 30Km west of Tuticorin, which has both rail and Airbase connections. The district receives the rain under the influence of both southwest and northeast monsoons. The rainfall was gradually increases towards south, west and north and attains a maximum around Kayattar (722.5 mm) and Kovilpatti (734.8 mm) in the northwestern part. The district enjoys a hot tropical climate. The high relative humidity prevails throughout the year between 60 and 75%. The annual mean minimum and maximum temperature are 23°C and 40°C respectively. Geology of the study area Rocks of the Proterozoic to Archaean age are extensively exposed in the various parts of the State. The sediments ranging in age from the Gondwanas to Recent are mostly confined to the eastern coast. The crystalline rocks exposed in this part of the peninsular shield include the rocks of the Charnockite Group, the Khondalite Group and gneisses and schists, traversed by ultramafic, basic, granite and syenite intrusives. About 90% of the district is made up of crystalline rocks of Proterozoic group comprising of Charnockites, Garnetiferous biotite gneiss, Quartzite etc., Kurumalai and Vallanadu hillocks are structural features. Few inselbergs are seen in the plain. Pediments, rocky pediments, buried pediments and valley fills are the other landforms in the district. The Vallanadu area is a high grade metamorphic terrain of almandine amphibolite to granulite facies. The area is essentially comprised of different lithotypes i.e., quartzites, calc- silicate rocks, Khondalites, Composite gneisses, Cordierite gneiesses, charnockites, Grey granites and pink granites and veins of pyroxene granulites and amphibolites. Khondalites of vallanadu area of Kerala Khondalite Belt (KKB) are represented by pelitic, Semipelitic, psammitic and calcareous members. The distribution of various lithotypes of the area is shown in (Fig.2). Arsenic content is not reported from the lithounits of the study area or it is below detectable limit. METHODOLOGY Thirty six groundwater samples were collected from various locations in pre-monsoon and post monsoon of each. The water samples were collected in 200 ml plastic bottles for trace elements analysed and another1000 ml for major cation and anion study, which were corked immediately to make them airtight. Samples were acidified with concentrated nitric acid (HNO3) for determination of trace elements to prevent any reaction. The physical parameters such as pH, EC, TDS and temperature were measured in the field. The major cations and anions were analysed at Spic Research Centre, Tuticorin and Trace elements analysed at NGRI, Hyderabad, using ICP-MS. Water resource in the study area Surface water
  • 3.
    Online International InterdisciplinaryResearch Journal, {Bi-Monthly}, ISSN2249-9598, Volume-III, Issue-VI, Nov-Dec2013 w w w . o i i r j . o r g I S S N 2 2 4 9 - 9 5 9 8 Page 232 The river originating from the Western Ghats of Tamil Nadu is a major river draining the study area. It is perennial in nature and flooding is generated in heavy rainfall period only. The Chittar river, a tributary of Tambraparani river joint at Sivalaperi. Groundwater potential Scenario of the study area The geology of the area is mainly composed of hard rocks and the fractured and well jointed nature of the rocks provide good amount of groundwater. Comparatively the gneissic rocks are with high groundwater potential owing to the weathering and fracturing for a considerable depth. Charnockites are low in water potential but well jointed, sheared Charnockites are good for groundwater potential. Quartzites are mostly granular, well jointed, cracked and fissured and these properties are reasons behind Groundwater potential of quartzites. The open wells of the area vary in depth from 10 to 40 meters. The important aquifer systems in the district are constituted by (i) unconsolidated and semi-consolidated formations and (ii) weathered and fractured crystalline rocks. The porous formations in the district include sandstones and clays of recent to sub-recent and tertiary age (quaternary). The recent formations comprising mainly sands, clays and gravels are confined to major drainage courses in the district. The maximum thickness of alluvium is 45.0m bgl; whereas the average thickness is about 25.0m. Ground water occurs under water table and confined conditions in these formations and is being developed by means of dug wells and filter points11, 12. The productive zones are encountered in the depth range of 29.5 to 62m bgl. Alluvium, which forms a good aquifer system along the Tambraparani river bed which is one of the major sources of water supply to the villages. The water bearing properties of crystalline formations which lack primary porosity depend on the extent of development of secondary intergranular porosity. The occurrence and movement of ground water in these rocks are under unconfined conditions in the joints and fissures and dependent on the nature and extent of pores and interconnection of fractures zones. The yield characteristics of wells vary considerably depending on the topographic set-up, lithology and nature of weathering. Hydrogeochemistry Hydrogeochemistry of groundwater is a dynamic process, which undergoes a constant change with reference to time and space. The geochemical quality of groundwater is also related to the nature of host rock as well as the overlying rock types. Geochemical character of groundwater is an essential component of scientific management of existing groundwater resources. In the present study an attempt has been made to identify the suitability of existing groundwater with reference to drinking, domestic, industrial and irrigational needs. The quality of groundwater is as important as its quantity. All groundwater contains dissolved solids in solution that are derived from the location due to movement of the water. In order to carry out the objectives water samples collected from different locations are analysed to evaluate groundwater quality. The collection and testing of water samples is a very important operation in any water quality study. To analyse the groundwater quality, the groundwater should be collected in one liter capacity polythene bottles after rinsing the bottle with the water, which is to be sampled and the sample collected and sealed tightly. Sample should be collected from a well, only after it
  • 4.
    Online International InterdisciplinaryResearch Journal, {Bi-Monthly}, ISSN2249-9598, Volume-III, Issue-VI, Nov-Dec2013 w w w . o i i r j . o r g I S S N 2 2 4 9 - 9 5 9 8 Page 233 has been pumped for sometimes, otherwise non-representative samples of stagnant or contaminated water may be obtained. Water samples have been collected from the existing bore wells and open well sources in 36 locations of the study area. Water samples have been analysed for major cations such as Ca, Mg, Na, and K and anions – CO3, HCO3, SO4 and Cl and TDS, pH etc. Results and Discussion Total Dissolved Solids Total dissolved solids of the ground water estimated for following locations are above 1000mg/l, namely Vallanadu south (Loc. no.1), Vallanadu north (Loc.no.2), Ariyakulam (Loc.no.3), Thiyagarayanagar (Loc.no.5), Kilpattam (Loc.no.10), Papayapuram (Loc.no.12), Melapalamadai (Loc.no.13), Sivalaperi (Loc.no.15), Maruvathalai (Loc.no.17&18), Savalaperi (Loc.no.19&20), Puliyampatti (Loc.no.21&22), Lakshmipuram (Loc.no.24&25), Akanayakkanpatti (Loc.no.28) and Kilpuvani (Loc.no.32). While TDS is below 1000 mg/l, in other areas like KTC nagar (Loc.no.4), Rajagopalapuram (Loc.no.6), Muthur (Loc.no.7&), Thiruthu (Loc.no.9), Melpattam (Loc.no.11), Rajavallipuram (Loc.no.14), Sivalaperi (Loc.no.16), Puliyampatti (Loc.no.23), Akanayakkanpatti (Loc.no.26&27), Melpuvani (Loc.no.29,30&31), Kilpuvani (Loc.no.33), Singathakurichi (Loc.no.35) and Kasilingapuram (Loc.no.36), all above water indicate their suitable nature for drinking and domestic purposes. Groundwater Hardness If the hardness is too low the water can be quite corrosive leaching copper and lead out of plumbing pipes. With very low hardness there would also be low levels of beneficial ions in the water, especially calcium and magnesium. If hardness is too high it can have an unpleasant taste, can dry out skin and cause scaling on fixtures and throughout the water distribution system. This scaling is undesirable because it begins to decrease the efficiency of plumbing systems, which results in greater power consumption and increased costs. With reference to BIS, Indian Standards (IS 10500:1991) desirable limit up to 300 mg/l, permissible limit up to 600 mg/l. (Table 1). Arsenic concentration at Kilpattam in the pre-monsoon (Fig.3) and five places at Vallanadu north, Kilpattam, Akanayakkanpatti, Melpuvani and Kilpuvani in the post monsoon (Fig.4), where its concentration exceeded permissible limit of 0.01 mg/l (Table 3). In rest of places the concentration of arsenic is in the range from 0.03 to 0.009 mg/l in the pre-monsoon and 0.003 to 0.007 mg/l in the post monsoon. The Arsenic compounds are found both in tri and pentavalent forms in ground water, of which trivalent is more hazardous than the latter. The permissible limit of arsenic in drinking water is 0.01 mg/l (10 ppb/l) and if consumption exceeds this limit and exposed for a long period, it may lead to many health hazards like gastro intestinal tract ulcers, various skin ulcers and tumors. Arsenic is a naturally occurring trace element found in rocks, soils and the water in contact with them. It has been recognized as a toxic element and is considered a human health hazard. As per the BIS Standard for drinking water the maximum permissible limit of Arsenic concentration in ground water is 0.01 mg/l. In 2010, the jointFAO/WHO committee on food additives (WHO, 2010) withdrew the previous established provisional
  • 5.
    Online International InterdisciplinaryResearch Journal, {Bi-Monthly}, ISSN2249-9598, Volume-III, Issue-VI, Nov-Dec2013 w w w . o i i r j . o r g I S S N 2 2 4 9 - 9 5 9 8 Page 234 tolerable weekly intake (PTWI) of Arsenic, i.e. 15 µg/kg body weights (equivalent to 2.1 µg/kg body weight/per day). This was becausethe benchmark dose for a 0.5 % increased incidence of lung cancer (BMDL 0.5 )w a s d e t e r mi n e d t o b e 3 . 0 µ g A r s e n i c / k g b o d y w e i g h t / d a y ( 2 – 7 µ g/ k g bodyweight/day), based on the range of estimated total dietary exposure. Iron concentration is widely distributed with various proportions in the study area. In about 100% of samples Fe concentration is exceeded the permissible limit of 0.3 mg/l in pre-monsoon and post monsoon (Table 2) (Fig.5 and 6 respectively). Iron, the second most abundant element by weight in the earth’s crust, is normally present in ground water in the ferrous form (Fe++), which is a soluble state and easily oxidized to trivalent ferric iron (Fe+++). Aeration of iron can affect the quality of both ground water and surface water. Iron rich ground water would affect the soil drainage with the deposition of ferric hydroxide on the surface. Dissolution of iron occurs as a result of oxidation and decrease of pH. The high content of the arsenic in groundwater may be attributed to the common occurrence of pyrite, pyrhotite, magnatite and ilmenite-iron bearing minerals in gneisses and charnockites of the study area. The relative low values of dissolved iron (<0.7 mg/l) in the middle Ganga plains (i.e. Uttarpradesh and Bihar) compared to higher values in the West Bengal (upto 36 mg/l) and Bangladesh (upto 30 mg/l0 indicate that the middle Ganga plain environment may not be sufficiently reducing to mobile iron and arsenic in groundwater (nickson et al. 1998). In the study area the weathering and large limestone quarry activities might have released the iron in the groundwater so as to form the reducing water environment which the facilitated releasing of arsenic content in groundwater. In general, As and Fe concentration is decreasing from top to bottom in sediment samples of diesel locomotive works hole ranges with a mean of 4-8 mg/kg and mean of 361 mg/kg respectively are reported from Varanasi environs of Ganga river basin (Janardhan Raju, 2012). On considering environs of the study area, the source of arsenic there is four possibilities. 1. Arsenic containing pesticides (sodium arsenite or lead arsenate. 2. Arsenic dusts and gases, released during cement manufacture and mining waste dusts. 3. Paper manufacturing unit and textile unit, pH-mediated industrial effluents and tailing ponds (Swapna Mukherjee, 2011). 4. Arsenic bearing automobile diesel wastage materials normally fed into the Thambraparani river, since it is a lowest contour of the area. The above source areas are situated in the upstream side of the study area. During the pre-monsoon period, arsenic concentration is located at Kilpattam site where Thambraparani river is showing meandering site and join with Chithar river. But during the post monsoon the arsenic concentration are located at five locations of lithological contact boundaries of granite/gneisses; gneiss and charnockite and also along Thambraparani river course. The concentration of arsenic seems to be migrated from Kilpattam area to the other areas like northern Vallanadu, Kilpuvani, Melpuvani and akanayakkanpatti during the rainy season through the lineaments during the post monsoon period.
  • 6.
    Online International InterdisciplinaryResearch Journal, {Bi-Monthly}, ISSN2249-9598, Volume-III, Issue-VI, Nov-Dec2013 w w w . o i i r j . o r g I S S N 2 2 4 9 - 9 5 9 8 Page 235 Conclusion: The slightly high arsenic content of groundwater in isolated locations are mainly due to migration of arsenic along Thambraparani river and along the lineaments so as to concentrate at lithological contacts. The arsenic main sources are usage of pesticides in the upland agricultural activity and from automobile diesel waste effluent discharge into the Thambraparani river course. Since arsenic content of lithology of the study area and surrounding environs are below detectable limits, not reported in earlier rocks analyses. It seems mining activities and cement industries are not causative factors for arsenic contaminants of Thambraparani river sites and adjoining sites connected with lineaments. Since textile and paper industries in the upstream site of Thambraparani are very few, their contributions to arsenic contamination are very less. All types of arsenic exposure can cause kidney and liver damage and in most severe exposure there is erythrocyte hemolysis (Swapna mukherjee, 2011). One sign of acute exposure is edema of the eyelids and gastrointestinal irritation and both central and peripheral neuropathies frequently occur. During chronic intoxication “garlic breath”, skin sensitivity, dermatitis and keratitus frequently occur. It is recommended to invest in an arsenic water filter or low cost chemical pockets for reducing arsenic content can be used. If drinking water contains arsenic, looks for an alternative source of water, which has no arsenic contaminants. It is also recommended to educate the farmers not to use arsenic bearing pesticides for agriculture activities and also to execute arsenic filters at effluent discharge sites of industrial and automobile activities and at the sites of pumping stations for Thambraparani drinking water system. Acknowledgement The authors are thankful to Shri.A.P.C.V.Chockalingam, Secretary, Dr.C.Veerabahu, Principal, V.O.Chidambaram College, Tuticorin, Mr.Rajendran, SPIC Research Centre, Tuticorin and Dr.B.Sathyanarayanan, Scientist, NGRI, Hyderabad, South India. References 1. Bajpai, S. and Chaudhuri, M. 1999. Removal of arsenic from ground water by manganese dioxide-coated sand. J. Environ. Eng. 125(8): 782-784. 2. Carrol A., Rain water as a chemical agent of ologic process –A review, U.S Geologicalsurvey water-supply, 97- 104 (1962). 3. Chakraborti D, Rahman MM, Paul K, Sengupta MK, Chowdhury UK, Lodh D, et al. Arsenic calamity in India and Bangladesh sub-continent-whom to blame? Talanta 2002; 58 : 3-22. 4. Datta DV, Mitra SK, Chhuttani PN, Chakravarti RN. Chronic oral arsenic intoxication as a possible aetiological factor in idiopathic portal hypertension (non-cirrhotic portal fibrosis) in India. Gut 1979; 20 : 378-84.
  • 7.
    Online International InterdisciplinaryResearch Journal, {Bi-Monthly}, ISSN2249-9598, Volume-III, Issue-VI, Nov-Dec2013 w w w . o i i r j . o r g I S S N 2 2 4 9 - 9 5 9 8 Page 236 5. FAO/WHO. 2011. Codex committee on contaminants in foods. Joint FAO/WHO foodstandards programme. Food and Agriculture Organization of the United Nations andthe World Health Organization, Rome. 28 pp. 6. Garai R, Chakraborty AK, Dey SB, Saha KC. Chronic arsenic poisoning from tubewell water. J Indian Med Assoc 1984; 82 : 34-5. 7. Gibbs R.J., Mechanisms controlling world water chemistry. Science 170, 1088–1090 (1970) 8. Janardhan Raju, N. (2012) Arsenic exposure through groundwater in the middle Ganga plain in the Varanasi environs, India: A future threat, Jur. Geol. Soc. India, V.79, pp 302-314. 9. Nickson, R.T., McArthur, J., Burgess, W., Ahmed, K.M., Ravenscroft, P and Rahman, M (1998) Arsenic poisoning of Bangladesh groundwater. Nature V.395, pp 338. 10. Ridchards, C.A.,Diagnosis and improvement of saline alkali soils, USDA handbook, 60, 160p (1954). 11. Ryzner, J.W A new index for determining amount of calcium carbonate scale formed by water , J.Amer , W.W.Assn., 36,472 – 486p (1944). 12. Sawyer, C.N Chemistry for sanitoary engineers, and P.L. Mc CARTY 2nd., Mc Graw Hill,New York, 518p (1987). 13. Todd., Ground water hydrology, John Wiley,535p (1980). 14. Stuyfzand P.J(1989) A new hydro chemical Classification of water types, proc.IAHS 3, Science association,Baltimore,USA,p.33-42 (1989). 15. Swapna Mukherjee (2011) Applied mineralogy: Applications in Industry and Environment. Capital publishing company, New Delhi, 575p. 16. U.S. EPA, MSE Technology Applications, Inc. 1999. Final report- arsenic oxidation demonstration project, mine waste technology program, activity III, Project 7. MWTP- 84. United States Environmental Protection
  • 8.
    Online International InterdisciplinaryResearch Journal, {Bi-Monthly}, ISSN2249-9598, Volume-III, Issue-VI, Nov-Dec2013 w w w . o i i r j . o r g I S S N 2 2 4 9 - 9 5 9 8 Page 237 Agency, National Risk Manaagement Research Laboratory, Office of Research and Development, Cincinnati, Ohio. 17. Wang, L., Chen, A., Fields, K. 2000. Arsenic removal from drinking water by ion exchange and activated alumina plants. EPA/600/R-00/088. United States Environmental Protection Agency, Water Supply and Water Resources Division, National Risk Management Research Laboratory, Cincinnati, Ohio. Table -1 Groundwater hardness classification of the study area Hardness (mg/l) Water Class Sample location nos. 0 - 75 Soft 6,7, 11,27, 30, 34, 35, 36 75 – 150 Moderately hard 8, 14, 16, 31, 33 150 – 300 Hard 9, 23, 29 >300 Very hard 1, 2, 3, 4, 5, 10, 12, 13, 15, 17, 18, 19, 20, 21, 22, 24, 25, 26, 28, 32 Table- 2. Distribution of Iron concentration in groundwater (mg/l) Table- 3. Distribution of Arsenic concentration in groundwater (mg/l) Sl. No. Iron concentration range Pre-monsoon Post monsoon No. of samples Percentage No. of samples Percentage 1 <0.3 Nil - Nil - 2 >0.3 36 100 36 100 Sl. No. Iron concentration range Pre-monsoon Post monsoon No. of samples Percentage No. of samples Percentage 1 <0.01 34 97.22 31 86.11 2 >0.01 1 2.78 5 13.89
  • 9.
    Online International InterdisciplinaryResearch Journal, {Bi-Monthly}, ISSN2249-9598, Volume-III, Issue-VI, Nov-Dec2013 w w w . o i i r j . o r g I S S N 2 2 4 9 - 9 5 9 8 Page 238 Figure – 1 Map showing water sample locations of the study area Geological Map of the study area
  • 10.
    Online International InterdisciplinaryResearch Journal, {Bi-Monthly}, ISSN2249-9598, Volume-III, Issue-VI, Nov-Dec2013 w w w . o i i r j . o r g I S S N 2 2 4 9 - 9 5 9 8 Page 239 Figure-3. Arsenic distribution in groundwater sample (Pre-monsoon)
  • 11.
    Online International InterdisciplinaryResearch Journal, {Bi-Monthly}, ISSN2249-9598, Volume-III, Issue-VI, Nov-Dec2013 w w w . o i i r j . o r g I S S N 2 2 4 9 - 9 5 9 8 Page 240 Figure-4. Arsenic distribution in groundwater sample (Post monsoon)
  • 12.
    Online International InterdisciplinaryResearch Journal, {Bi-Monthly}, ISSN2249-9598, Volume-III, Issue-VI, Nov-Dec2013 w w w . o i i r j . o r g I S S N 2 2 4 9 - 9 5 9 8 Page 241 Figure-5. Iron distribution in groundwater sample (Pre-monsoon)
  • 13.
    Online International InterdisciplinaryResearch Journal, {Bi-Monthly}, ISSN2249-9598, Volume-III, Issue-VI, Nov-Dec2013 w w w . o i i r j . o r g I S S N 2 2 4 9 - 9 5 9 8 Page 242 Figure-6. Iron distribution in groundwater sample (Post monsoon)