Hydrochemistry of groundwater with special reference to arsenic in Lakhimpur Kheri district, Uttar Pradesh, India

The present study aims to understand the severity of Arsenic contamination along with the hydrochemistry of ground water in Lakhimpur Kheri, one of the largest districts in Uttar Pradesh, India. Ground water samples collected from 102 handpumps from 15 blocks were analyzed for physicochemical parameters and Arsenic. The groundwater quality data were analysed statistically. The characteristic features of groundwater indicated the presence of As (0- 0.224 mg/L), Fe (0.011-8.634mg/L), Na+ (2.84-62.12 mg/L), K+ (1.21-51.20 mg/L), Ca2+ (6-102mg/L), Mg2+ (10-126), Cl- (2.19-133.96 mg/L), SO42- (1-269.92 mg/L), NO3- (0.11-2.61 mg/L) and HCO3- (122-549 mg/L). The pH of the groundwater was found to be neutral to slightly alkaline (6.88-8.45) with high EC (471-1569 μS/cm) and TDS (289-1042 mg/L). Of the total samples analysed, 41.18% contained As > 10μg/L, 13.73% contained As < 10μg/L, while in the rest of the samples As was found to be below detectable limit. Severe As contamination was reported mainly in six blocks of the study area- Pallia, Nighasan, Dhawahara, Ramia Beher, Isanagar and Nakaha. The highly contaminated block was Pallia where all the samples contained As above permissible limit. However, maximum As concentration (0.224 mg/L) was reported from a deep well handpump of village Dubha from Nighasan block. Both Shallow and deep bore handpumps were analysed to study the distribution pattern of As with depth. No systematic relationship was found. Arsenic showed insignificant correlation with EC, TDS, TH, Ca2+, Mg2+, Na+, K+, HCO3-, NO3- Cl- and SO42- but poor correlation with Fe (r2 = 0.391) and pH (r2 = 0.018). Factor analysis was applied to reveal the processes controlling the hydrochemistry of groundwater and to understand the factors responsible for the release of As in groundwater of the study area. Extensive study in the affected areas advocates that the leaching of Arsenic in underground water is controlled by the magnitude of oxidizing environmental conditions created in the affected zones where As (III) oxidized to As (V) is introduced in the aquifers and gets adsorbed on iron rich grains.

Recommended
Recommended
More Related Content
What's hot
What's hot (20)
Viewers also liked
Viewers also liked (20)
Similar to Hydrochemistry of groundwater with special reference to arsenic in Lakhimpur Kheri district, Uttar Pradesh, India
Similar to Hydrochemistry of groundwater with special reference to arsenic in Lakhimpur Kheri district, Uttar Pradesh, India (20)
More from IOSR Journals
Recently uploaded
Recently uploaded (20)
Hydrochemistry of groundwater with special reference to arsenic in Lakhimpur Kheri district, Uttar Pradesh, India
- 1. IOSR Journal of Applied Chemistry (IOSR-JAC) e-ISSN: 2278-5736.Volume 6, Issue 1 (Nov. – Dec. 2013), PP 61-68 www.iosrjournals.org www.iosrjournals.org 61 | Page Hydrochemistry of groundwater with special reference to arsenic in Lakhimpur Kheri district, Uttar Pradesh, India Vinay Kumar Pathak1 , Neeraj Agnihotri1 , Naseema Khatoon1 , Altaf Husain Khan2 , Masihur Rahman1 , 1 Department of Chemistry, Integral University, Kursi Road, Lucknow, India 2 Indian Institute of Toxicology Research (IITR), M.G. Marg, Lucknow, India Abstract: The present study aims to understand the severity of Arsenic contamination along with the hydrochemistry of ground water in Lakhimpur Kheri, one of the largest districts in Uttar Pradesh, India. Ground water samples collected from 102 handpumps from 15 blocks were analyzed for physicochemical parameters and Arsenic. The groundwater quality data were analysed statistically. The characteristic features of groundwater indicated the presence of As (0- 0.224 mg/L), Fe (0.011-8.634mg/L), Na+ (2.84-62.12 mg/L), K+ (1.21-51.20 mg/L), Ca2+ (6-102mg/L), Mg2+ (10-126), Cl- (2.19-133.96 mg/L), SO4 2- (1-269.92 mg/L), NO3 - (0.11-2.61 mg/L) and HCO3 - (122-549 mg/L). The pH of the groundwater was found to be neutral to slightly alkaline (6.88-8.45) with high EC (471-1569 µS/cm) and TDS (289-1042 mg/L). Of the total samples analysed, 41.18% contained As > 10µg/L, 13.73% contained As < 10µg/L, while in the rest of the samples As was found to be below detectable limit. Severe As contamination was reported mainly in six blocks of the study area- Pallia, Nighasan, Dhawahara, Ramia Beher, Isanagar and Nakaha. The highly contaminated block was Pallia where all the samples contained As above permissible limit. However, maximum As concentration (0.224 mg/L) was reported from a deep well handpump of village Dubha from Nighasan block. Both Shallow and deep bore handpumps were analysed to study the distribution pattern of As with depth. No systematic relationship was found. Arsenic showed insignificant correlation with EC, TDS, TH, Ca2+ , Mg2+ , Na+ , K+ , HCO3 - , NO3 - Cl- and SO4 2- but poor correlation with Fe (r2 = 0.391) and pH (r2 = 0.018). Factor analysis was applied to reveal the processes controlling the hydrochemistry of groundwater and to understand the factors responsible for the release of As in groundwater of the study area. Extensive study in the affected areas advocates that the leaching of Arsenic in underground water is controlled by the magnitude of oxidizing environmental conditions created in the affected zones where As (III) oxidized to As (V) is introduced in the aquifers and gets adsorbed on iron rich grains. Keywords: Arsenic, Factor analysis, Hydrochemistry, Pearson’s correlation, Statistical analysis I. Introduction Arsenic contamination of underground water is a worldwide problem due to its detrimental effects on human health. Groundwater Arsenic contamination related health impacts had been reported from many countries. Bangladesh, China, Canada, Mexico, Germany, Vietnam, Pakistan, USA and India are some of the countries where long term consumption of Arsenic in groundwater led serious health problems. Considering the lethal impacts of Arsenic, WHO (2004)1 has set a provisional guideline value, USEPA (2001)2 have recommended a Maximum Contaminant Level (MCL) value of As as 10 µgL-1 , whereas, Indian Standard Drinking Water-Specification (Second Revision) IS 10500 have set acceptable limit of 10 µg/L and permissible limit of 50 µg/L of Arsenic in drinking water 3 . The most devastating arsenic poisoning had been reported from Bangladesh and West Bengal (India) where more than 36 million peoples are suffering from Arsenic induced diseases 4 and millions are still consuming arsenic contaminated water. In India also number of underground water sources from different states are unfit for consumption due to elevated levels of Arsenic contamination such as West Bengal, Bihar, Jharkhand, Chattisgarh, Madhya Pradesh and even Uttar Pradesh5 .In Uttar Pradesh deadly Arsenic has crept its way in as many as forty five districts, some of the worst affected areas being Ballia, Ghazipur, Basti, Balrampur, Sant Kabir Nagar, Unnao, Bareilley and Lakhimpur Kheri (U.P. Jal Nigam 2011 report) 6 . Earlier, a survey conducted individually by Sriram Institute of Industrial Research (SIIR) ,Delhi (2004)7 and School of Environmental Sciences, Jadhavpur University, Kolkata (SOES-JU) (2005)8 found that some areas in Ballia and Lakhimpur Kheri district of Uttar Pradesh were contaminated with Arsenic in drinking water at levels greater than 50µgL-1 . Later on Uttar Pradesh Jal Nigam (UPJN) in collaboration with UNICEF (2006) in its Phase I of a project explored 8442 handpumps in 17 different blocks and found that 510 handpumps were containing Arsenic > 50 µgL-1 6 . The present study deals with the blockwise analysis of groundwater of Lakhimpur Kheri, UP, India to explore the magnitude of severity of Arsenic and its distribution pattern. Statistical analysis of hydrochemical
- 2. Hydrochemistry of groundwater with special reference to arsenic in Lakhimpur Kheri district, Uttar www.iosrjournals.org 62 | Page parameters such as pH, electrical conductivity, total dissolved solids, sulphate, chloride, bicarbonate, Ca2+ , Mg2+ , total hardness Na+ , K+ and iron had also been studied to understand the hydrochemistry of groundwater. Efforts have been taken to identify the correlations of Arsenic with these hydrochemical parameters to understand its possible release mechanism in the area. II. Materials And Methods 2.1. Description of Study Area 2.1.1 Regional setting Lakhimpur Kheri (Fig.1) district lies in Tarai region along the Himalayan foothills lying between 27.60 N to 28.60 N latitude and 80.340 E to 81.300 E longitude. It covers total area of 7680 km2 with population of 32, 00137 and having population density of 520/ Km2 (2001 census). The district comprises 6 Tehsils and 15 blocks. The climate is subtropical and the area enjoys moderate to heavy rainfall between mid June to September. The Ghaghara and Sharda are the two major rivers draining the area. The Ghaghara river along with its tributaries flows from North to South in eastern parts of the district while Sharda river nearly bisects the district and flows from North (in western part of the district) to South East (in southern part of the district) and finally joins Ghaghara river in Southeast corner of the district. There are number of seasonal rivers and abandoned channels and other water bodies which carry water in rainy seasons only. Majority of the population in the area depends upon agriculture as nearly 62.08% of the area is covered with cultivated agricultural land. 21.4% of area is under forest cover. The area is highly fertile and the main crops are sugarcane, wheat and paddy. There are number of sugarcane factories, small sugar mills and other small scale factories (mainly agro-based) in the district. Public and private handpumps and tubewells are the major source of drinking and irrigation purpose. Figure 1: Location map of study area showing all 15 sampling blocks of Lakhimpur Kheri district, Uttar Pradesh, India. (highly contaminated areas shown in oval) 2.1.2. Geology Geologically, the area consists of Quaternary sediments as older Varanasi alluvium of Pleistocene age and Newer Alluvium of Holocene age which is classified as Terrace Alluvium and Channel Alluvium. 2.2 Sampling and Analytical technique Total 102 groundwater samples from handpumps of both the types i.e., shallow handpumps (SHP) and deep well handpumps (DWH) were collected from all the 15 blocks of Lakhimpur Kheri district – Pallia (11), Nighasan (9), Ramia Beher (11), Dhawhara (10), Isanagar (10), Lakhimpur (5), Behjhum (5), Nakaha (6), Mitauli (5), Phool Beher (5), Pasgawa (5), Mohmadi (5), Kumbhi (5), Bakeyganj (5) and Bijua (5) (Table 1). Before collection of samples each handpumps were flushed for about 10 min. The samples were then collected in clean plastic bags (autoclaved). Plastic bags were immediately sealed, labelled and stored properly for laboratory analysis. For the analysis of Arsenic separate plastic bags were used, before preservation 1ml HCl (1ml in 100 ml of water) is added to the water samples. Temperature and Total Dissolved Solids (TDS) were analysed on the field with the help of TDS meter (SYMBON 205) during sample collection. Also initial data of the handpumps related to type, depth and year of installation were collected on the field through local bodies.
- 3. Hydrochemistry of groundwater with special reference to arsenic in Lakhimpur Kheri district, Uttar www.iosrjournals.org 63 | Page pH was determined potentiometrically with the help of pH meter (Model: EUTECH Instruments pH 510) with glass reference electrode. Conductivity was measured using Conductivity meter (Model: LABTRONICS LT 51). All the chemicals used were of Reagent Grade (Fischer Scientific, India) and Milli-Q water (Millipore corp. with electrical resistivity of 18.2 MΩ cm) was used for preparation of solution and dilution purpose. Other parameters such as Hardness, Ca2+ , Mg2+ (by EDTA method/complexometric titration method), Total alkalinity, CO3 2- , HCO3 - , OH- (using Phenolphthalein and methyl orange as indicator), SO4 2- (by turbidimetric method), Cl- (by Argentometric method) were determined by titration as mentioned in the standard methods for examination of water and waste water (APHA 2005)9 . Each sample was analysed twice. The coefficient of variation in duplicate samples was 2.5%. Na+ and K+ were determined by flame photometer (T-128 SYSTRONICS). Iron in water sample was estimated by Phenanthorline method. Standard calibration curve was prepared (R2 = 0.99) with the help of different concentrations of standard Fe solution measuring the absorbance at 510nm with the help of UV-Vis Spectrophotometer (LT-2800, LABTRONICS) (APHA 2005)9 . Estimation of total Arsenic (As3+ and As5+ ) was conducted by Silverdiethyldithiocarbamate method (SDDC). Standard calibration curve (R2 = 0.971) were prepared and absorbance on UV-Vis Spectrophotometer (LT-2800, Labtronics) for various As concentration were measured at 535 nm (APHA 2005)9 . 2.3. Statistical analysis of data The analysis of data was carried out statically using software packages SPSS Statistics 17.0 (Version 17.0.1) and XLSTAT (Version 2013.5.06). Descriptive statistics comparing minimum, maximum, range, mean, median, standard deviation and standard error of the mean of different parameters and the correlation matrix was analysed using SPSS 17.0. Factor analysis also called as data reduction technique was carried out using XLSTAT. Factor analysis using varimax rotation method was applied only for those samples in which Arsenic had been detected during the analysis; only those factors whose Eigen values are greater than one were retained (Kaiser Normalisation). These factors help evaluate the insight into various geochemical environments in the groundwater which is useful to interpret the possible release mechanism of Arsenic in groundwater of study area. III. Results And Discussions The groundwater samples from all the blocks of the study area were collected, classified and analysed in Table 1. Of the total 102 handpumps selected, 54(52.94%) were Shallow handpumps (SHP), 10-15 m deep (most of them were installed four years back and of private use) and 48(47.06%) were Deepwell handpumps (DWH), 30-60 m deep (most of them were installed very recently nearly 1-2 years back, were India Mark II handpumps and used publicly). Results of descriptive statistics of each hydrochemical parameter are presented in Table 2. Table also reflects the desirable limit prescribed according to WHO guidelines and BIS: 10500. Table 1: Summary of arsenic contaminated samples from Shallow handpumps and deep well handpump. BLOCK LOCATION TOTAL No. OF SAMPLE S No. OF SAMPLES FROM SHP No. OF SAMPLES FROM DWH TOTAL % OF SAMPLES CONTAININ G As > 10 ppb LATTITUDE LONGITUD E As>1 0 µg/L As<10 µg/L As = BDL As>1 0 µg/L As<10 µg/L As = BDL PALLIA 270 45' 800 29' 11 5 0 0 6 0 0 100% NIGHASAN * 280 14' 800 51' 9 4 1 0 3 1 0 77.78% RAMIA BEHAR 270 59' 800 29' 11 5 1 0 2 3 0 63.64% DHAWHARA 270 59' 800 50' 10 4 3 0 3 0 0 70% ISANAGAR 270 54' 810 12' 10 5 1 0 4 0 0 90% LAKHIMPUR 270 56' 800 46' 5 0 1 1 0 1 2 NA BHEJHUM 270 56' 800 44' 5 0 0 3 0 1 1 NA NAKAHA 270 52' 800 56' 6 0 0 3 1 0 2 16.67% MITAULI 270 49' 800 27' 5 0 0 3 0 1 1 NA PHOOL BEHAR 280 30' 800 47' 5 0 0 3 0 0 2 NA PASGAWA 270 56' 800 46' 5 0 0 2 0 0 3 NA MOHMADI 270 57' 800 12' 5 0 0 3 0 0 2 NA KUMBHI 270 57' 800 21' 5 0 0 3 0 0 2 NA BAKEYGANJ 270 70' 800 26' 5 0 0 2 0 0 3 NA BIJUA 280 16' 800 36' 5 0 0 1 0 0 4 NA TOTAL 102 23 7 24 19 7 22 41.18% * Sample obtained from Nighasan contains highest concentration of As (0.224 ppm); NA= Not Applicable
- 4. Hydrochemistry of groundwater with special reference to arsenic in Lakhimpur Kheri district, Uttar www.iosrjournals.org 64 | Page 3.1. Hydrogeochemistry of underground water The chemical characteristics of groundwater in the study area can be inferred from Table 2. In general the groundwater is characterised by circum-neutral pH slightly deviating towards alkaline nature (range, 6.88- 8.45; mean, 7.54) containing high concentrations of HCO3 - (range, 122-549 mg/L; mean, 351.86 mg/L), electrical conductivity (range, 471-1569 µmho/cm; mean, 866.78 µmho/cm), total hardness (range, 148-662 mg/L; mean, 292.6 mg/L), Mg2+ (range, 10-126 mg/L; mean, 37.23 mg/L), iron (range, 0.011-8.634 mg/L; mean, 0.937 mg/L) and total Arsenic (As3+ and As5+ ) (range, 0- 0.224 mg/L; mean, 0.027 mg/L). Low to moderate concentrations of Cl- (range, 2.19-313.96 mg/L; mean, 29.69 mg/L), SO4 2- (range, 1.00-269.92 mg/L; mean, 49.20 mg/L), NO3 - (range, 0.11-2.61 mg/L; mean, 0.85 mg/L), Ca2+ (range, 6-102 mg/L; mean, 56 mg/L), Na+ (range, 2.84-62.12 mg/L; mean, 19.75 mg/L) and K+ (range, 1.21-51.30 mg/L; mean, 6.65 mg/L). These values are in close agreement with earlier published data on Lakhimpur Kheri by Central Ground water board (CGWB), Ministry of water resources, Government of India, Faridabad 201010 and Geological Survey of India, 2006-0711 . On the basis of extensive analysis it was found that among 54.90% (56 out of 102) samples, total Arsenic was detected. These groundwater samples collected from the handpumps are found to be confined in Pallia, Nighasan, Ramia Beher, Dhawahara, Isanagar, Nakaha, Lakhimpur, Behjhum and Mitauli blocks of the study area (Figure 2 compares the mean values of total Arsenic from different blocks). Water samples from rest of the blocks, were found to contain As below detectable limit. It is interesting to note that most of the groundwater from five blocks (viz., Pallia, Nighasan, Ramia Beher, Dhawahara, and Isanagar) lying between the River Sharda and tributary of River Ghaghra were contaminated with As > 10 µg/L (Fig.1). The maximum Arsenic concentration (0.224 mg/l) was detected from a handpump of Nighasan block (DWH, from primary school, vill., Dubha,) however, the highly contaminated block was found to be Pallia (where all the handpumps were found to contain As concentration greater than the permissible limit). Table 2: Summarised hydrochemical analysis of 102 samples from Lakhimpur Kheri, UP Statistics Parameters pH EC (µS/cm) TDS (mg/L) HCO3 - (mg/L) Cl- (mg/L) SO4 2- (mg/L) NO3 - (mg/L) Ca2+ (mg/L) Mg2+ (mg/L) TH (mg/L) Na+ (mg/L) K+ (mg/L) Fe2+ (mg/L) As(T) (mg/L) Minimum 6.88 471 289 122 2.19 1.00 0.11 6 10 148 2.84 1.21 0.011 0.0 Maximum 8.45 1569 1042 549 313.96 269.92 2.61 102 126 662 62.12 51.3 8.634 0.224 Range 1.57 1098 753 427 311.71 268.92 2.50 96 116 514 59.28 50.09 8.623 0.224 Mean 7.54 866.76 553.05 351.86 29.69 49.20 0.85 56.00 37.23 292.61 19.75 6.65 0.937 0.027 Median 7.53 856.50 528.50 348.00 16.86 31.27 0.77 57.22 33.00 279.00 14.31 5.30 0.448 0.004 Std. Dev. 0.25 215.01 148.49 75.24 39.24 55.61 0.53 20.99 18.60 81.38 14.55 5.68 1.282 0.042 SEM 0.02 21.29 14.70 7.45 3.89 5.51 0.05 2.08 1.84 8.06 1.44 .56 0.127 0.004 WHO Standards 6.5-8.5 N.G. 500 N.G. 250 250 50 75 50 500 200 N.G. 0.30 0.01 IS 10500 6.5-8.5 N.G. 500 N.G. 250 200 45 75 30 200 200 N.G. 0.30 0.01 N.G.: No Guidelines prescribed according to WHO and BIS 3.2. Distribution pattern of Arsenic The spatial distribution of Arsenic, though irregular, but found to be localised mainly in five blocks (hot spot blocks) - Pallia, Nighasan, Ramia Beher, Dhawhara and Isanagar. In these blocks almost all the handpumps were found to be contaminated. 41.18% (42 out of 102) of total handpumps analysed contained arsenic concentration above permissible limit belonged to these blocks (Table 1).The groundwater samples from the blocks in the vicinity of these ‘hot spot blocks’, i.e. Nakaha, Behjhum, Lakhimpur and Mitauli, contained Arsenic below permissible limit. It seemed that as we moved away from these five blocks (hot spot blocks), we found that magnitude of contamination in the handpumps gradually decreased and finally reached below detectable limit (BDL). Accordingly in the blocks Pasgawa, Mohmadi, Kumbhi, Bakeyganj and Bijua we did not found any contaminated handpump. In order to study the variation of As with depth, only As contaminated groundwater samples, collected from both the types of handpumps (SHP and DWH), from different blocks were compared. All 56 Arsenic contaminated samples, classified according to their source, revealed that 23 (76.67%) out of 30 SHP samples and 19 (73.08%) out of 26 DWH samples were contaminated with Arsenic above permissible limit. Arsenic concentration does not vary systematically with depth. Thus, it can be concluded that groundwater samples from both SHPs and DWHs are severely contaminated and both types of handpumps cannot be assumed to be Arsenic safe.
- 5. Hydrochemistry of groundwater with special reference to arsenic in Lakhimpur Kheri district, Uttar www.iosrjournals.org 65 | Page Figure 2: Comparison of mean values of Arsenic (T) concentration from different blocksof Lakhimpur, Kheri, Uttar Pradesh. Interestingly, it was found that the contamination was mainly in those hand pumps which were installed in populated areas and were old. Similar findings were reported by Yadav et al (2006-07)11 . Ahmed et al (2006, 2008) also revealed similar conditions in the states of Uttar Pradesh and Bihar, where As concentration do not follow any pattern with depth, however, contamination was mostly in the range of 15-40 m deep and depth > 100m were generally free from As pollution12, 13, 14 .Yadav15 (2005-06) also reported similar results in Ballia. 3.3. Correlation of Arsenic with other Hydrochemical parameters In order to understand the influence of groundwater chemistry on Arsenic contamination, Pearson’s correlation (r) between Arsenic and other hydrochemical parameters was determined for those 56 groundwater samples from different blocks where the As contamination was found. Table 3 shows the Correlation matrix. Significant values are marked ** (p value significant at 0.01 level) or * (p value significant at 0.05 level). The correlation of Arsenic with Electrical Conductivity (EC), Total Dissolved Solids (TDS), Total Hardness (TH), Ca2+ , Mg2+ , Na+ , K+ , HCO3 - , NO3 - Cl- and SO4 2- was found to be negative and insignificant. Table 3: Correlation matrix of hydrochemical parameters of As containing groundwater samples from different blocks of Lakhimpur Kheri, UP Parameters pH EC TDS HCO3 - Cl- SO4 2- NO3 - Ca2+ Mg2+ TH Na+ K+ Fe2+ As (T) pH 1 -0.078 -0.062 -0.099 -0.151 0.152 -0.080 -0.429** 0.096 -0.235* 0.097 0.073 -0.049 0.018 EC 1 0.965** 0.843** 0.695** 0.649** 0.195 0.449** 0.650** 0.845** 0.668** 0.575** -0.118 -0.079 TDS 1 0.816** 0.777** 0.723** 0.282* 0.449** 0.719** 0.900** 0.696** 0.560** -0.160 -0.134 HCO3 - 1 0.404** 0.248* 0.112 0.532** 0.405** 0.708** 0.521** 0.446** -0.181 -0.074 Cl- 1 0.677** 0.371** 0.293* 0.655** 0.738** 0.595** 0.417** -0.052 -0.179 SO4 2- 1 0.242* 0.001 0.813** 0.652** 0.496** 0.407** -0.070 -0.117 NO3 - 1 0.245* 0.225* 0.359** 0.255* 0.190 0.208 -0.045 Ca2+ 1 -0.140 0.606** 0.082 0.059 -0.280* -0.209 Mg2+ 1 0.702** 0.430** 0.393** -0.004 -0.075 TH 1 0.405** 0.359** -0.204 -0.210 Na+ 1 0.617** 0.008 -0.024 K+ 1 -0.052 -0.050 Fe2+ 1 0.391** As (T) 1 **. Correlation is significant at the 0.01 level (1-tailed). *. Correlation is significant at the 0.05 level (1-tailed). The correlation of Arsenic with pH though positive but is not very significant (r2 = 0.018), correlation with iron is 0.391 and is also not found to be very significant as shown in Table 3.Poor correlation of Arsenic
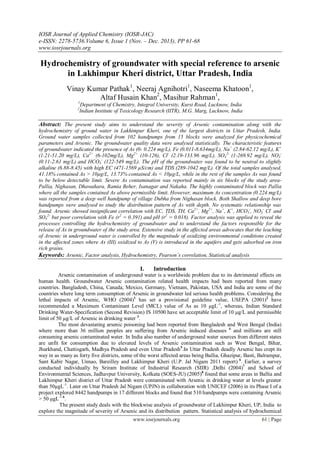
- 6. Hydrochemistry of groundwater with special reference to arsenic in Lakhimpur Kheri district, Uttar www.iosrjournals.org 66 | Page with Iron was also reported by Ahmed et al (2008)14 in Ganges Meghna Brahmaputra (GMB) plains and Dipanker Chakraborti (2008)16 in Manipur valley. 3.4. Factor Analysis Multivariate statistical technique - Factor analysis is used to identify certain factors responsible for correlation between large numbers of variables (parameters). The varimax rotated factor analysis was carried out (N= 56, for the As contaminated groundwater samples) to isolate only those factors whose eigenvalues are greater than 1. The analysis yielded three dominant factors and is expressed by data matrix variance of 64.96% (Table 4). Factor loading is classified as ‘strong’, ‘moderate’, and ‘weak’ corresponding to absolute loading values (positive or negative) of >0.75, 0.75-0.50 and 0.50-0.30 respectively. Component loadings of principle components is shown in figure 3. Factor I explains 44.71% of total variance with strong loadings of EC, TDS, HCO3 - , Cl- , SO4 2- , Mg2+ and TH and moderate loadings of Na+ and K+ . The combination of these factors usually represents the dissolved ion load of groundwater. The factor clearly reveals that the groundwater chemistry is dominated by negative ions rather than the positive ions.Thus, the factor demonstrates the reducing conditions in groundwater. Factor II explains 12.94% of total variance strong positive loading of Ca2+ and moderate negative loading of pH, suggesting that the pH of the groundwater is more or less affected by Ca2+ ions in water. Factor III explains the 7.30% of total variance with moderate loadings of iron, arsenic and nitrate. Less significant correlation between As and Fe (r2 = 0.391, Table 3) suggests that iron is only partially responsible for the As release in groundwater of study area. It can also be interpreted that moderate loadings with NO3 - (may be present in ground water due to agricultural activity- fertilizer inputs in the fields) may also cause As release at local scale with very little or no effect. 3.5. Possible release mechanism of Arsenic in Groundwater The probable reason for the leaching of arsenic in groundwater of study area can be interpreted taking into consideration the following discussions: 1. Groundwater of study area is anion dominated where the reducing environment is prevalent. Figure 3: Factor loadings (axes F1 and F2: 57.65 %) of different hydrochemical parameters (N = 56) 2. Arsenic concentration in underground water is localised only in few blocks of Lakhimpur Kheri district lying between the two rivers passing through the district. 3. Occurrence of As do not following any specific pattern with respect to depth. 4. Moreover, the correlation of Arsenic with Iron is also not found to be highly significant. 5. Old and exhaustively used handpumps were found to be more As contaminated than others. 6. Moreover, in the previous studies, Yadav11 reported the presence of Arsenic rich mineral Arsenolite, As2O3 (by XRD and EDX studies) in these blocks (F. S., 2006-07). So, it can be concluded that presence of Arsenic in underground water is due to geogenic conditions. Large scale drilling out of underground water in summer season lowers the water table which permits the atmospheric oxygen to invade into aquifer, which creates oxidizing environment in these zones. As (III) (which is relatively less mobile) is thus oxidized to As (V) (highly mobile). Arsenic is thus introduced in the aquifers in soluble state pH EC TDS HCO3 - Cl- SO4 2- NO3 - Ca2+ Mg2+ TH Na+ K+ Fe As -0.6 -0.4 -0.2 -1E-15 0.2 0.4 0.6 0.8 1 -1 -0.8 -0.6 -0.4 -0.2 0 0.2 0.4 0.6 0.8 1 F2(12.94%) F1 (44.71 %)
- 7. Hydrochemistry of groundwater with special reference to arsenic in Lakhimpur Kheri district, Uttar www.iosrjournals.org 67 | Page and gets adsorbed on iron rich grains. The subsequent adsorption and desorption of Arsenic in undergroumd water is controlled by microbial activity (Mukherjee, 2007)17 . Table 4: Factor loadings of different chemical parameters of groundwater samples (N = 56) from the study area (significant loadings marked in bold). Parameters Factor 1 Factor 2 Factor 3 pH -0.080 -0.450 0.320 EC 0.951 0.066 0.035 TDS 0.991 0.034 0.035 HCO3 - 0.762 0.339 0.093 Cl- 0.813 -0.096 -0.148 SO4 2- 0.753 -0.453 0.110 NO3 - 0.340 -0.014 -0.519 Ca2+ 0.427 0.863 -0.136 Mg2+ 0.755 -0.478 0.073 TH 0.913 0.238 -0.041 Na+ 0.691 -0.243 -0.052 K+ 0.572 -0.185 0.036 Fe2+ -0.148 -0.333 -0.684 As (T) -0.163 -0.198 -0.330 Eigenvalue 6.259 1.812 1.022 Variability (%) 44.709 12.941 7.303 Cumulative (%) 44.709 57.650 64.953 IV. Conclusion Hydrochemical analysis 102 water samples from the study area revealed high concentrations of HCO3 - , Cl- , Mg2+ TH, EC, TDS, Fe and As and low to moderate concentrations of SO4 2- , NO3 - , Na+ Ca2+ and K+ . Groundwater is found to be anion dominated having reducing environment and neutral to slightly alkaline pH (6.88-8.45, mean, 7.54). 54.90% samples from nine blocks of Lakhimpur Kheri were found to be contaminated with Arsenic. 41.18% samples exceeds WHO guideline value for drinking water and all these samples are found to confined to six blocks- Pallia, Nighasan, Ramia Beher, Dhawahara, Isanagar and Nakaha and therefore groundwater of these six blocks is matter of concern. Groundwater is the major source of drinking and irrigation purpose for the villagers. No systematic relation between Arsenic concentration and depth was found thus the handpumps, shallow or deep; both are unsafe for water consumption. During our investigation we found that most of the villagers are unaware, and a few which knew about the situation still continued to consume the contaminated water as they are helpless and no initiative had been taken by government or private authority. In Isanagar block we found few people with the symptom of Arsenicosis. Thus, large number of people is unwillingly consuming arsenic contaminated water and is at grave health risk as no alternative sources are available. This strongly advocates necessity to take certain initiative to mitigate the problem and to spread the awareness of the problem among the affected population. However, the positive side of the research is that nearly half of the population of other nine blocks are safe and consuming arsenic free water. References [1]. WHO, Guidelines for drinking water quality, vol. 1; 2004. Recommendations, Third Edition. [2]. USEPA 2001. Technical Fact Sheet: Final Rule for Arsenic in Drinking Water EPA-815-F-00-016, Washington, DC: U.S. Environmental Protection Agency. Available http://www.epa.gov/safewater/ars/afs_rule_techfactsheet.html. [3]. Bureau of Indian Standards. Drinking water – specification (Second revision). IS 10500, 2009. [4]. Chakraborti, D., Rahman, M.M., Paul, K., Chowdhury, U.K., Sengupta, M.K., Lodh, D., Chandra, C. R., Saha, K. C. and Mukharjee, S. C., (2002) Arsenic calamity in Indian subcontinent. What lessons have been learned? Talanta, Vol. 58, Issue 1,16, pp 3-22. [5]. Kumar, S. and ENVIS NIOH Team, Arsenic and health (Bibliography), 2008, p 4-7. [6]. Ministry of Drinking Water and Sanitation, Government of India, New Delhi, Report of the Central Team on Arsenic mitigation in rural drinking water sources in Ballia district, Uttar Pradesh State, 14-17 September 2011, pp. 8-11. [7]. Shriram Institute of Industrial Research (2004) Final report on arsenic contamination study of groundwater in Uttar Pradesh (2003-04). Delhi. [8]. School of Environmental Studies, Jadavpur University (2005), Groundwater arsenic contamination and arsenicosis patients in Uttar Pradesh, India. Unpublished report. [9]. APHA, AWWA, WPCF. Standard Methods for Examination of Water and Wastewater, 21th edition, Washington, D.C, (2005). [10]. http://cgwb.gov.in/documents/waterquality/gw_quality_in_shallow_aquifers.pdf, assessed 24th, March, 2011. [11]. Yadav M.L., Mishra I.K., Study of Arsenic problem in Groundwater in parts of Lakhimpur Kheri District, UP, field session 2006- 07, Geological Survey of India, an unpublished report 2007/07/137. [12]. Ahmed S. (2006), Groundwater Arsenic contamination and its health effects in states of Bihar and Uttar Pradesh, India (Unpublished PhD thesis), Jhadavpur University, Kolkata.
- 8. Hydrochemistry of groundwater with special reference to arsenic in Lakhimpur Kheri district, Uttar www.iosrjournals.org 68 | Page [13]. Ahmed S., Sengupta M. K., Mukherjee A., Hossain M. A., Das B. Nayak B., Pal A., Mukherjee S. C. Pati S., Dutta R. N., Chatterjee G., Makherjee A., Srivastava R. Chakraborty D.,(2006) Groundwater Arsenic Contamination in Middle Ganga Plain, Uttar Pradesh, India, a future danger? Sci. Total Environ 370; 310-322. [14]. Ahmed S., Das B., Hossain M.A., Nayak B. Pal A. E., Jayantakumar Singh, Sengupta M. K., Mukherjee S.C., Pati S, Dutta R. N., Kshitish Chandra Saha, Quazi Quamruzzaman, Chakraborty D., 2008, Ganga-Meghana-Brahmaputra Plain and its surroundings. Trace Elem Med (in press). [15]. Yadav M.L., Report on geoenvironmental appraisal of arsenic prone areas in the Ballia district, Uttar Pradesh. F.S. 2005-06, Geological Survey of India, an unpublished report 2007/07/137. [16]. Chakroborty D., Singh E. J., Das B., Shah B.A., Hossain M.A., Nayak B., Ahmed S., Singh N. R., 2008, Groundwater arsenic contamination in Manipur, one of the seven North-Eastern Hill states of India: a future danger, Environ Geol, 56, pp 381-390. [17]. Mukherjee A., Fryar A. E., Howell P., 2007, Regional hydrostratigraphy and groundwater flow modelling of Arsenic contaminated aquifer of the West Bengal basin, West Bengal, India, Hydrol, 334 (1-2), 151-161.