The study investigates the hydrochemical characteristics of groundwater in the basement aquifer of northern Togo, emphasizing its significance for domestic use in a region heavily reliant on groundwater. It employs hydrochemical and statistical methods to analyze water quality, revealing that the aquifer primarily consists of fresh water, indicating mineralization caused by geological processes and anthropogenic factors. Results show variable physicochemical parameters, with the groundwater largely meeting WHO standards for drinking water.
![International Advance Journal of Engineering Research (IAJER)
Volume 3, Issue 3 (March- 2020), PP 01-19
ISSN: 2360-819X
www.iajer.com
Engineering Journal www.iajer.com Page | 1
Research Paper Open Access
Hydrochemical And Statistical Characterization Of Basement
Aquifer Groundwater in The Extreme Northern Togo
Goumpoukini BOGUIDO1
, Masamaèya D. T. GNAZOU1
, Rim TRABELSI2
,
Lallébila. TAMPO1
, AYAH Massabalo1
, Kamel ZOUARI2
, Limam Moctar
BAWA1
, Gbandi DJANEYE-BOUNDJOU1
1
Laboratory of Water Chemistry, Faculty of Science, University of Lomé, PO. Box: 1515 – Lomé, Togo.
2
Laboratory of Radio-Analysis and Environment (LRAE), National Engineering School of Sfax (ENIS), Tunisia.
ABSTRACT: About two third of the population in the North of Togo lives in rural and semi-rural areas,
depends on groundwater for drinking, for domestic and agricultural uses. Hydrochemical and statistical methods
investigation are carried out on the groundwater of the basement aquifer system in the North of Togo in order to
determine the mineralization water process. Chemical analysis were made at Laboratory of Water Chemistry
(LCE) at University of Lomé according to AFNOR methods. The quality of groundwater has been conducted by
using multivariate statistical and spatial analyses. Major chemical elements show that this aquifer system is
composed by fresh water dominated by the Ca-Mg-HCO3 and Ca-HCO3 water types (about 93%). According to
hydrochemical and multivariate statistical analysis, groundwater mineralization is caused by the silicates
weathering related to the residence time of water in the aquifer, anthropogenic activities in urban environment
and agricultural area, soil CO2 diffusion and cation exchange process.
Keywords:- Birrimian aquifer, Hydrochemical, multivariate statistical analysis, mineralization water process.
I. INTRODUCTION
On a global scale, about two third of the population in the Savannas region in Togo, lives in rural and
semi-rural areas, depends on groundwater for drinking and for domestic uses [1]. Surface water is easily
accessible, but they are subject to increasing pollution and a significant temporal and seasonal variation in their
quantity. Unlike surface water, groundwater has the advantage of being less exposed to pollution, being
available near demand points and having a quantity that varies little with the seasons [2]. This supplying point
once of good quality, is currently threatened by various points and diffuse sources of contamination [3]. It is the
main source of water supply for people in the Savannah region of Togo, given the occasional drying up of
traditional water points (backwaters, springs and traditional wells) following the effects of climate change.
Indeed, Togo is a small country in West Africa covering an area of 56,600 km2
. It is divided into five
major economic regions, the fifth region being the Savannah region located in the extreme north of the country.
The study area is located in the Savannah region, which is bordered in the North by Burkina Faso, in the South
by the Kara region, in the West by Ghana and in the East by Republic of Benin. The rate of drinking water
supply in the region in 2007 was estimated at 16.6% in rural and semi-rural areas, 44.2% in urban areas with an
average of 24.7% [1]. In front of this shortage, the Togolese State, with the help of a few donors, initiated a
national program of village hydraulics throughout the Savannah region, the objective of which was to supply
drinking water in all areas of the country, sub-prefectures and more generally in all urban, peri-urban and rural
areas of the region [4]. This program has made it possible to build several water points in villages only from
groundwater. Nowadays, no study has been done in order to characterize these waters qualitatively and
quantitatively.
At the national level, the works carried out concerned the coastal sedimentary basin and the few works
done in the basement are those of [5] (in plateau region) and [6] (in Kara region ). The study done on the
Birrimian basement of the Savannah region by [7] focused on a mathematical model of the structure and
functioning of the exploited basement aquifer. This study shows that the overall rainfall shortage since 1970,
and which increased from 1983 to 1985, resulted in a decrease in annual recharge for these three years. The
present study aimed to determine the hydrogeochemical characteristics of groundwater of the basement aquifer
in northwestern Togo for domestic use. Specifically, the study focused on determining the quality of](https://image.slidesharecdn.com/a330119-200817112608/85/A330119-1-320.jpg)
![International Advance Journal of Engineering Research (IAJER)
Volume 3, Issue 3 (March- 2020), PP 01-19
ISSN: 2360-819X
www.iajer.com
Engineering Journal www.iajer.com Page | 1
Research Paper Open Access
Hydrochemical And Statistical Characterization Of Basement
Aquifer Groundwater in The Extreme Northern Togo
Goumpoukini BOGUIDO1
, Masamaèya D. T. GNAZOU1
, Rim TRABELSI2
,
Lallébila. TAMPO1
, AYAH Massabalo1
, Kamel ZOUARI2
, Limam Moctar
BAWA1
, Gbandi DJANEYE-BOUNDJOU1
1
Laboratory of Water Chemistry, Faculty of Science, University of Lomé, PO. Box: 1515 – Lomé, Togo.
2
Laboratory of Radio-Analysis and Environment (LRAE), National Engineering School of Sfax (ENIS), Tunisia.
ABSTRACT: About two third of the population in the North of Togo lives in rural and semi-rural areas,
depends on groundwater for drinking, for domestic and agricultural uses. Hydrochemical and statistical methods
investigation are carried out on the groundwater of the basement aquifer system in the North of Togo in order to
determine the mineralization water process. Chemical analysis were made at Laboratory of Water Chemistry
(LCE) at University of Lomé according to AFNOR methods. The quality of groundwater has been conducted by
using multivariate statistical and spatial analyses. Major chemical elements show that this aquifer system is
composed by fresh water dominated by the Ca-Mg-HCO3 and Ca-HCO3 water types (about 93%). According to
hydrochemical and multivariate statistical analysis, groundwater mineralization is caused by the silicates
weathering related to the residence time of water in the aquifer, anthropogenic activities in urban environment
and agricultural area, soil CO2 diffusion and cation exchange process.
Keywords:- Birrimian aquifer, Hydrochemical, multivariate statistical analysis, mineralization water process.
I. INTRODUCTION
On a global scale, about two third of the population in the Savannas region in Togo, lives in rural and
semi-rural areas, depends on groundwater for drinking and for domestic uses [1]. Surface water is easily
accessible, but they are subject to increasing pollution and a significant temporal and seasonal variation in their
quantity. Unlike surface water, groundwater has the advantage of being less exposed to pollution, being
available near demand points and having a quantity that varies little with the seasons [2]. This supplying point
once of good quality, is currently threatened by various points and diffuse sources of contamination [3]. It is the
main source of water supply for people in the Savannah region of Togo, given the occasional drying up of
traditional water points (backwaters, springs and traditional wells) following the effects of climate change.
Indeed, Togo is a small country in West Africa covering an area of 56,600 km2
. It is divided into five
major economic regions, the fifth region being the Savannah region located in the extreme north of the country.
The study area is located in the Savannah region, which is bordered in the North by Burkina Faso, in the South
by the Kara region, in the West by Ghana and in the East by Republic of Benin. The rate of drinking water
supply in the region in 2007 was estimated at 16.6% in rural and semi-rural areas, 44.2% in urban areas with an
average of 24.7% [1]. In front of this shortage, the Togolese State, with the help of a few donors, initiated a
national program of village hydraulics throughout the Savannah region, the objective of which was to supply
drinking water in all areas of the country, sub-prefectures and more generally in all urban, peri-urban and rural
areas of the region [4]. This program has made it possible to build several water points in villages only from
groundwater. Nowadays, no study has been done in order to characterize these waters qualitatively and
quantitatively.
At the national level, the works carried out concerned the coastal sedimentary basin and the few works
done in the basement are those of [5] (in plateau region) and [6] (in Kara region ). The study done on the
Birrimian basement of the Savannah region by [7] focused on a mathematical model of the structure and
functioning of the exploited basement aquifer. This study shows that the overall rainfall shortage since 1970,
and which increased from 1983 to 1985, resulted in a decrease in annual recharge for these three years. The
present study aimed to determine the hydrogeochemical characteristics of groundwater of the basement aquifer
in northwestern Togo for domestic use. Specifically, the study focused on determining the quality of](https://image.slidesharecdn.com/a330119-200817112608/75/A330119-1-2048.jpg)
![Hydrochemical And Statistical Characterization Of Basement Aquifer Ground water In The…
Engineering Journal www.iajer.com Page | 2
groundwater, the processes influencing this quality, the chemical facies and the influence of geological
formations on the water resources, to monitor the spatial evolution of physicochemical parameters.
II. MATERIAL AND METHODS
II.1- Study area, geological and hydrogeological context
The study area, which is the Birrimian basement of northwestern Togo, is situated between latitude
10°43 ' and 11°08' N, and longitude 0°09 ' and 0°33 E. It is limited to the West by Ghana, North by Burkina
Faso, East and to the South by non-metamorphic primary sedimentary formations of the Togolese part of the
Volta Basin (Oti Basin). Figure 1 shows the location of the study area and the sampling points.
In geological context, the formations of the study area belong to the eastern edge of the West African
Big Craton Man Ridge. This ridge which develops largely in the North-West of the Togolese part, is a vast
geological set well represented in West Africa. It covers an area of about 1345 km2
, belonging to the so-called
stable area, and is located about 600 km north of the capital Lomé. For the reasons of the study, we had taken
part of the sandstones of Dapaong which collect the fractured basement. It is the oldest formation represented in
Togo, where it is attributed to Birrimian in comparison with the Birrimian formations observed in Ghana,
Burkina Faso and Côte d’Ivoire. It consists of granito-gneissic basement and includes diverse crystalline
formations. In comparison with similar formations of the same type in Burkina Faso, they are considered
Archean (or pre-Birrimian) to early Proterozoic (Precambrian C or Birrimian) [7]. There are gneisses,
migmatites, amphibolites, granites, granodiorites and diorites. The geological map is shown in Figure 2.
The main hydrogeological formations of the granito-gneissic basement are those of the great units of
the eastern edge of the West African craton. The fissured medium that constitutes this region is the granito-
gneissic domain whose hydrogeological conditions are relatively homogeneous and correspond to the
lithological families [7]. In crystalline and crystallophyllian environments, the aquifer zones correspond to the
altered surface levels (alterites and alluvium) and deep basement levels (cracks and / or fractures), which are in
many cases superimposed and form the same aquifer system [8]. There are two types of aquifers: the aquifer of
alterites exploited by modern or village wells, the aquifers of fissures and fractures captured by the boreholes
within in case of the programs of drinking water supply in these localities. The alteration of these formations
produces a thick layer of alterites which varies between 2 and 40 m or more.
The climate the Sudanese type characterized by a regime uni modal with one rainy season from May to
October; and the dry season from October to April. The mean annual rainfall recorded at meteorological station
of Dapaong is 1050 mm with a mean temperature of 33.6°C. The total annual evapotranspiration oscillates
between 1600 to 1800 mm [9].
Figure 1: Map of the study area showing the sampling points.](https://image.slidesharecdn.com/a330119-200817112608/85/A330119-2-320.jpg)
![Hydrochemical And Statistical Characterization Of Basement Aquifer Ground water In The…
Engineering Journal www.iajer.com Page | 3
Fig 2: Geological Map of the study area
II.2- Sampling and analysis methods
A total of 74 water samples were collected in September 2017 out of several of the study area. (Figure
1), from different aquifers (3 wells and 68 boreholes) and 3 surface water. These water samples were taken in
polyethylene bottles of 1.5 liters, and preserved for analysis.
Measurements such as water temperature, pH, Electrical Conductivity (EC), and total alkalinity as
HCO3 were carried out on site. The boreholes and wells were purged with pumps until stabilization of pH,
Electrical conductivity and temperature before the field measurements were performed. Then, water samples
were collected and stored in 1.5 L clean high-density polyethylene bottles with poly-seal caps. Conductivity
and temperature were given using a multimeter Inolab “WTW”. For surface water sampling, samples were
collected from flowing part of the rivers. A static water levels were measured in wells and boreholes using a
light Sounder. The chemical analysis were made at the Chemistry Laboratory of Water (LCE) of the University
of Lomé according to AFNOR methods. The major elements Ca2+
, Mg2+
were determined by complexometry
with EDTA 0,01M after titration; Na+
and K+
by direct reading using a photometer of JENWAY flame mark
PFP7. Ions Cl-
were determined by the argentimetric method, NO3
-
and SO4
2-
by molecular spectrophometry of
absorption after calibration. Total alkalinity (HCO3
-
and CO3
2-
was determined by titration with a hydrochloric
acid solution (0.1 M) by using phenolphthalein and helianthin as indicators.
II.3- Data processing
The results of the physicochemical analysis were treated by methods of multivariate statistical analysis
coupled with the hydro chemical methods. The hydro chemical method required the use of Piper Diagram and
the index of saturation carried out under the Diagram software, for the identification of the facies of water and
the study of saturation with respect to certain minerals. The statistical approach is based on the use of the
Analysis in Normalized Principal Components (ACPN) and Hierarchical Ascending Classification (CHA) to
study the phenomena at the origin of the mineralization of water and those of the pollution/contamination. These
statistical methods are usually used in the field of Sciences of water, with excellent results [10]. Indeed the ACP
STATE makes it possible to synthesize and classify a significant number of data in order to extract from them
the principal factors which are at the origin of the simultaneous evolution of the variables and their reciprocal
relation [11]. It makes it possible to highlight the resemblances and the graphic position which would present
two or several chemical variables during their evolution. The Ascending hierarchical clustering (CAH) is a tool
to analyze data of water chemistry and for the formulation of geochemical models [12]. The statistical analysis](https://image.slidesharecdn.com/a330119-200817112608/85/A330119-3-320.jpg)
![Hydrochemical And Statistical Characterization Of Basement Aquifer Ground water In The…
Engineering Journal www.iajer.com Page | 4
were carried out with software XL-STAT 2007. The values of the parameters were compared with the World
Health Organization [13] value guides for drinking water. The values of the ionic balance characterizing the
samples taken within the framework of this study are all lower than 5% reflecting the good quality of the
analysis carried out.
III. RESULTS AND DISCUSSION
III.1- Results
III.1.1- Physical Parameters
"In situ" measurements related to three parameters such as: temperature (T°C), potential of hydrogen
(pH) and electric conductivity (EC) (Table 1). Temperature of groundwater in the study area ranges from 27.4 to
30.1°C with mean temperature about 28.4°C. They presented a range of narrow temperature: the amplitude of
variation is small as the coefficient of variation CV shows it (Table 1). The values of pH recorded during the
sampling campaign ranges from 5.68 to 8.88 with a mean pH about 7.34 thus close to neutrality. Water is
characterized by a great space variability of electrical conductivity. Electrical conductivity ranges from 24
µs/cm (well P3) to 1747 µs/cm (borehole FP1). Waters with high conductivity are located in urban environment.
This indicates that the basin is characterized by important heterogeneities and the conductivity values are
affected by different geochemical processes. Figure 3 shows the space conductivity distribution of groundwater
in the study area. It shows that the lowest mineralization water are located in the Mid-west of the study area
(which would correspond to a recharge zone). That is put forward by the piezometric map (Figure 4) which
indicates a dividing line). The alkalinity of water is connected to the pH system, and ranges from 12.2 mg/L to
414.8 mg/L with a mean alkalinity about 181.8 mg/L. These two parameters make it possible to calculate the
partial pressure of balancing CO2
. It is influenced by the addition or the consumption of the protons. The values
of the log (pCO2
), characterizing groundwater and surface water study, ranges largely from -2.78 to -0.18 with
an average of about -1.41. Tables 1 and 2 indicate the variations of the physical parameters.
Table 1: Physicochemical parameters of groundwater
Min Max Mean Std dv CV en %
Cond 24 1747 355 242,8 68,4
pH 5,68 8,8 7,34 0,459 6,25
T°C 27,4 30,1 28,3 0,76 2,68
O2 diss 2 10,6 6,75 2,27 33,63
HCO3
-
12,2 414,8 181,76 89,08 49
log(pCO2) -2,78 -0,18 -1,41 0,47 -33,94
Table 2: Physicochemical parameters of surface water
Min Max Mean Std dev CV en %
Cond 46,00 111,00 77,67 32,53 41,88
pH 7,24 8,27 7,70 0,52 6,79
T°C 28,50 29,30 28,87 0,40 1,40
O2 diss 7,80 9,40 8,43 0,85 10,08
HCO3
-
30,50 73,20 52,87 21,42 40,52
III.1.2- Variation of the Chemical Parameters
The physicochemical parameters of the groundwater quality data were statistically
analyzed and the results are presented in form of minimum, maximum, mean and
standard deviation (Table 3).
- Major Cations
The calcium contents range from 4 mg/L to 156 mg/L with an average of 31.2 mg/L. While the values
of magnesium obtained vary between 0.72 mg/L and 79.2 mg/L with an average of 13.3 mg/L. The water
hardness is an indicator of the limestone level in water: it corresponds to its calcium content and magnesium.
The more it contains some, the more it is "hard". As a whole, these results thus reveal that water is in extreme
cases soft and fairly hard. Hard water of tendency is water of boreholes: FP1 (72 °F), FP6 (33 °F) and FP8
(32°F). Sodium presents contents ranges from 0.8 mg/L to 114 mg/L for an average value of 22.1 mg/L. The](https://image.slidesharecdn.com/a330119-200817112608/85/A330119-4-320.jpg)
![Hydrochemical And Statistical Characterization Of Basement Aquifer Ground water In The…
Engineering Journal www.iajer.com Page | 7
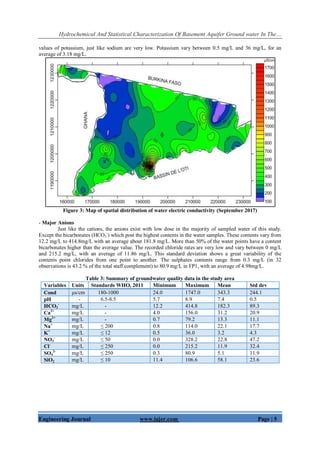
Figure 5: Piper Diagram showing the hydrochemical compositions of groundwater and surface water
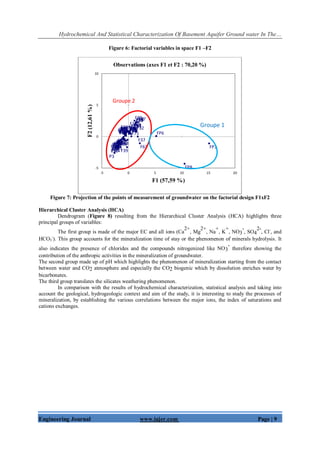
III.1.4- Statistical analysis of the chemical parameters
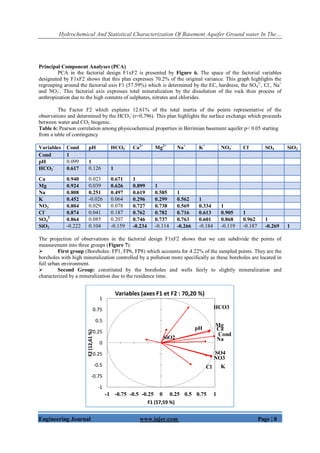
- Factorial Matrix
It was carried out starting from a table of contingency of (74) observations and (11) variables. This analysis
made it possible to identify three principal factors of which the two first factors contribute to 70.2% of the
original variance. The eigenvalues of the first three factors are presented in Table 4.
Table 4: Eigenvalues and percentage of expressed variance
Facteurs F1 F2 F3
Eigenvalue 6.335 1.387 1.103
% expressed Variance 57.791 12.609 10.026
Plurality of expressed variance 57.791 70.200 80.226
The factor F1, with an expressed variance of 57.59%, is the most significant follow-up of the factors F2
and F3, with respectively 12.61% and 10.03% of the original variance. The first two factors translate the main
part of required information and make it possible significantly to represent the essential part of the observations
and the variables expressed about 70.2%.
Table 5 presents the contribution of the various variables in the definition of the principal factors. This
table shows that the factor F1, is defined by electrical conductivity EC (r=0.986), calcium (r=0.903), magnesium
(0.891), sodium (0.932), sulphates SO4
2-
(R = 0.928), nitrates NO3
-
(r=0.84), and chlorides Cl-
(r=0.891). Thus
the axis F1 (57.59%) represented the phenomenon of mineralization by hydrolysis but also expresses an
anthropic effect (correlation between F1 and NO3
-
, Cl-
and SO4
2-
) due to pollution.
Table 5: Correlations between the variables and the factors
F1 F2 F3
Cond 0.986 0.149 -0.010
pH 0.098 0.294 0.781
HCO3 0.507 0.796 -0.185
Ca 0.903 0.280 -0.131
Mg 0.891 0.253 -0.037
Na 0.822 0.033 0.121
K 0.549 -0.484 0.006
NO3 0.840 -0.280 0.120
Cl 0.932 -0.312 0.086
SO4 0.928 -0.294 0.071
SiO2 -0.271 0.072 0.632
The connection existing between all the variables taken two by two and the coefficients of correlation
between these various variables are given by the matrix of correlation (Table 6). While being based on the
coefficient of correlation r=0.64 [14] criticizes, a test of correlation of the various studied parameters
highlighted a close connection between Ca2+
, Mg2+
, Na+
SO4
2-
, Cl-
, NO3
-
and electrical conductivity. This
relation results in the coefficients of correlation approaching "1". Taking into consideration this table, one can
make several noticed:
A good correlation between conductivity and Ca2+
(0.94), Mg2+
(0.924), Na+
(0.808), SO4
2-
(0.864), Cl-
(0.874) and NO3
-
(0.804).
A discrete correlation between the bicarbonates, Ca2+
and Mg2+
; like between calcium and the anions
(NO3
-
, SO4
2-
and Cl-
) then between Mg2+
and these some anions.](https://image.slidesharecdn.com/a330119-200817112608/85/A330119-7-320.jpg)
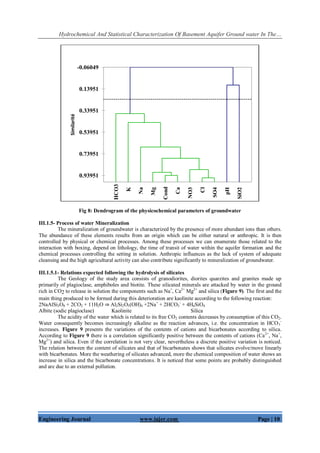
![Hydrochemical And Statistical Characterization Of Basement Aquifer Ground water In The…
Engineering Journal www.iajer.com Page | 11
Figure 9: Relationship between the contents Ca2+
, Mg2+
, Na+
and HCO3
-
with silica.
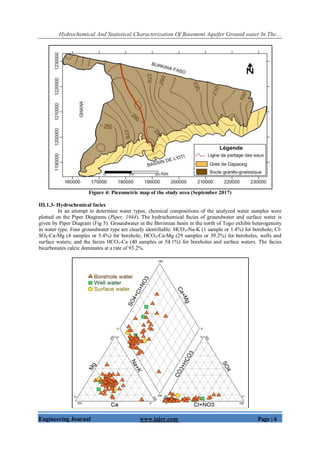
Figure 10 shows the relationship between [Ca2+
+Mg2+
] and [SO4
2-
+HCO3
-
]. This Figure shows that most of the
groundwater samples and surface water samples are plot below and along the y= x line due to excess of
bicarbonates as only eight samples representing 11% were found to be above the aquiline. This Figure indicates
that silicate weathering is the main source of sodium and bicarbonate and it exerts major control on groundwater
and surface water in the study area.
0
20
40
60
80
100
120
0 50 100
Caenmg/L
SiO2 en mg/L
Surface water
Well water
Borehole water
0
5
10
15
20
25
30
35
40
45
0 50 100 150
Naenmg/L
SiO2 en mg/L
Surface water
Well water
Borehole water
0
20
40
60
80
100
120
0 20 40
Mgenmg/L
SiO2 en mg/L
Surface water
Well water
Borehole water
0
50
100
150
200
250
300
350
400
450
0 50 100 150
HCO3enmg/L
SiO2 en mg/L
Surface water
Well water
Borehole water](https://image.slidesharecdn.com/a330119-200817112608/85/A330119-11-320.jpg)
![Hydrochemical And Statistical Characterization Of Basement Aquifer Ground water In The…
Engineering Journal www.iajer.com Page | 12
Figure 10: Relationship between [Ca+Mg] and [HCO3 +SO4]
III.1.5.2- Relations between cations and bicarbonates
Figure 11 shows the relationship between the contents of cations (Ca
2+
, Mg
2+
, Na
+
K
+
) and of HCO3
-
. We
observes a linear increase of cations concentration (Ca2+
, Mg2+
) with the HCO3
-
content except for some points
which are under the influence of a anthropic pollution. It appears clear that the setting in solution of calcium in
water is under the action of dissolved CO2 on the calcic minerals aluminosilicates which is the prevalent process
[Ca = f(HCO3
-
)]. The relation through the two elements gives a coefficient of correlation R = 0.67.
The relation is more or less good for sodium, but looser for potassium. This indicate that potassium and sodium
could have an external origin with the system water-rock. This is the consequence of a high anthropic pressure.
The positive correlation at the same time of these cations and bicarbonates reflects the setting in solution of
these ions during the weathering of silicates.
In general, alteration of basement minerals, in the absence of human activity, water becomes rich in
alkalinity and cations. More the process of alteration advances, more the content of HCO3
-
increases. The linear
correlation between some chemical elements make it possible to study the origin of mineralization by evaluating
the degrees of dependence between the various parameters concerned. It is also advisable to study the index of
saturations compared to minerals.
0
2
4
6
8
10
12
14
16
0 2 4 6
[Ca+Mg]meq/L
[HCO3+SO4] meq/L
Surface water
Well water
Borehole water
Y = X
Carbonate
weathering
Silicate
weathering
0
10
20
30
40
50
60
70
0 100 200 300 400 500
Caenmg/L
HCO3 en mg/L
Borehole
water
Surface water
0
10
20
30
40
50
60
70
80
90
100
0 100 200 300 400 500
Naenmg/L
HCO3 en mg/L
Borehole
water
Surface
water](https://image.slidesharecdn.com/a330119-200817112608/85/A330119-12-320.jpg)
![Hydrochemical And Statistical Characterization Of Basement Aquifer Ground water In The…
Engineering Journal www.iajer.com Page | 13
Figure 11: Relationship between Ca2+
, Mg2+
, Na+
, K+
and HCO3
-
in groundwater of the study area.
III.1.5.3- Saturation index
The saturation index (SI) is usually used in geochemistry, and defines the saturation state of minerals in
the water. It can provide significant information on the various hydrogeochemical processes controlling the
groundwater chemistry [15; 16]. Deutsch and Siegel (1997) stated that it is possible to predict the minerals that
are responsible for controlling water quality from groundwater data without collecting the samples of the solid.
When the SI<0, the minerals will be dissolved and the water is said to be undersaturated with respect to the
mineral. It may describe a short residence time or a lack of the considered mineral in the aquifer from which the
water is discharging [17]. On the other hand, when groundwater is supersaturated with respect to a mineral, the
SI is >0, which means that the mineral will be precipitated. When SI is just equal to 0, it indicates that the water
is saturated with respect to the mineral. However, due to uncertainty related to the minerals concentration, water
with SI values comprised between -0.5 to 0.5 could be considered as saturated with respect to the mineral in
question. In this study, SI of calcite, dolomite, gypsum, anhydrite and aragonite were calculated with Diagrams
software for groundwater samples.
It is interesting to notice that all waters are undersaturated with respect to the gypsum, of anhydride and
halite (Figure 12). It is also noticed that some water shows positive values of the indices of saturation (IS>0)
with respect to calcite, aragonite and dolomite. These indices, in the whole, vary between 0 and 1 for calcite and
the aragonite, then between 0 and 2 for dolomite; thus reflecting a state of supersaturation with respect to these
minerals.
0
5
10
15
20
25
30
35
40
0 100 200 300 400 500
Mgenmg/L
HCO3 en mg/L
Borehole
water
Surface
water
0
2
4
6
8
10
12
14
0 200 400 600
Kenmg/L
HCO3 en mg/L
Borehole
water
Surface
water
-6
-5
-4
-3
-2
-1
0
0 2 4 6 8 10
IsGypse
[Ca+SO4] en méq/L
Borehole water
Surface water
Well water
-6
-5
-4
-3
-2
-1
0
0 5 10
IsAnhydride
[Ca +SO4] en méq/L
Borehole water
Surface water
Well water](https://image.slidesharecdn.com/a330119-200817112608/85/A330119-13-320.jpg)
![Hydrochemical And Statistical Characterization Of Basement Aquifer Ground water In The…
Engineering Journal www.iajer.com Page | 14
Figure 12: Index of saturation of water with respect to carbonated and evaporitic minerals
III.1.5.4- Basics Exchanges
We often speak about the basic exchanges with the clayey minerals which exist in the aquifer formation
and groundwater. These exchanges characterize clayey minerals having the possibility of fixing ions by
adhesion and of releasing from others according to the existing electric charge between the layers of clayey
minerals and the state of saturation of the solution. Figure 13 highlights the basic exchanges with the clayey
minerals which affect water of the basin during the infiltration of rainwater and their stay within the aquifer. It
shows that almost that all the representative points are placed at the turn of the point of origin. What would
mean that the clayey minerals undergo a dissolution except that the borehole FPI placed above the origin,
releases calcium and fixes sodium. This says the calcium concentration is very high compared to sodium
([Ca
2+
] =7.78 méq/L; [Na
+
] = 3.39 méq/L). It is the same for the borehole F32 which fixes calcium and
releases sodium ([Na
+
] = 3.87 méq/L and [Ca
2+
] = 0.72 méq/L).
-5
-4
-3
-2
-1
0
1
2
0 5 10 15
IsCalcite
[Ca + HCO3] en méq/L
Borehole water
Surface water
Well water
-5
-4
-3
-2
-1
0
1
2
0 5 10 15
IsAragonite
[Ca+HCO3] en meq/L
Borehole water
Surface water
Well water
-10
-8
-6
-4
-2
0
2
4
0 5 10 15 20
IsDolomite
[Ca+Mg+HCO3] en meq/L
Borehole water
Surface water
Well water
-11
-10.5
-10
-9.5
-9
-8.5
-8
-7.5
-7
-6.5
-6
0 5 10 15
IsHalite
[Na + Cl] en méq/L
Borehole water
Surface water
Well water](https://image.slidesharecdn.com/a330119-200817112608/85/A330119-14-320.jpg)
![Hydrochemical And Statistical Characterization Of Basement Aquifer Ground water In The…
Engineering Journal www.iajer.com Page | 15
Figure 13: Description of the basic exchanges with clayey minerals in the aquifers
III.2- Discussion
The analysis of basement aquifer groundwater in the north Togo (Dapaong) shows that the temperature
ranges from 27.4 to 30.1°C with a mean temperature about 28.4°C. These results are close to those of [18] in
Burkina Faso in the basement aquifer, where the temperature is in general very close to the average atmospheric
values (28 with 32° C) for well water and (28 with 34° C) for boreholes water [18]. The values of the
temperature reflect as well the ambient temperature at the time of the collection of the samples as the climate of
the season. That confirms the influence of the climate on the groundwater resources with low depth in the area.
At this level, groundwater is more influenced by the seasonal variations of the temperature of the atmospheric
air [19].
The values of pH recorded during the sampling campaign vary from 5.68 to 8.88 with an average of
7.34 thus close to neutrality. This trend to neutrality in the aquifers is due to the consumption of CO2 following
the weathering of silicates involving the increase in the alkalinity (HCO3
-
of water [20]. These values are rather
homogeneous (low CV) and vary independently of the aquifers collected. They probably do not showing clearly
the variation because of the interference of several geochemical processes (dissolution, reduction, oxidation...)
with the mixture between water of the alterites and that of the fractured basement.
The alkalinity of water is connected to the pH system, and these two parameters make it possible to
calculate the pressure partial of balancing CO2. The values of log(pCO2) vary little and evolve/move around
0,03 atm (logpCO 2 = - 1.5 atm). According to Mbonu (1991) , this value is frequently associated the
atmosphere of the ground; what let think that it is about a contribution of CO2 in opened conditions system on
an unlimited gas tank which is the atmosphere of the ground. The values of the log(pCO2) characterizing
groundwater and surface water of the study area, vary largely between -2,78 and -0,18 with an average of about
-1.41. The values which exceed those of the atmosphere indicate that the groundwater gained CO2 of the
breathing of the plants and the degradation of the organic matter of the ground [21]. Moreover, the values of pH
follow the same evolution that the pCO2 and remain lower than 8.3. Therefore alkalinity is essentially made up
of bicarbonates (HCO3
-
) [22] which represent in the majority of the cases the anion dominating with more than
50 % of the total mass of the dissolved charge.
Water is characterized by a great variability of mineralization in space. They are of slightly with fairly
mineral-bearing having nevertheless strong mineralization of some boreholes in urban environment. Electric
Conductivity varies between 24 µs/cm and 1747 µs/cm. [23] showed that the electric conductivity of
groundwater varies from 227 to 1740 µs/cm with an average of 605.3 µs/cm in zone of basement in the basin of
-7
-5
-3
-1
1
3
5
7
9
-7 -5 -3 -1 1 3 5 7
[Ca+Mg-HCO3-SO4]inmeq/L
[Na + K - Cl-] in meq/L
Borehole water
Surface water
Well water](https://image.slidesharecdn.com/a330119-200817112608/85/A330119-15-320.jpg)
![Hydrochemical And Statistical Characterization Of Basement Aquifer Ground water In The…
Engineering Journal www.iajer.com Page | 16
Dargol in Niger. This great variation shows a notable heterogeneity in the mineral charge distribution of
groundwater due to lithology and specific pollution. The extreme values of conductivity observed are noticed
with boreholes FP1 (1747 µs/cm), FP8 (1184 µs/cm) and FP6 (880 µs/cm). These points are located in urban
environment and would be probably of anthropic origin. Borehole FP1 is located near a large dumping ground
and probably receives water resulting from the scrubbing of this one. As for borehole FP8, it is beside the
gutters by where forwards worn water coming from the big market of the city. It is showed that the sources of
direct pollution are the escapes of the sewerage systems, the septic tanks, surface the water, solid waste, fuel the
puddle pools, the infiltration starting from the polluted rivers, the intrusion saltworks, the fertilizers, the
pesticides, the scrubbing of the zone unsaturated at the time of the piezometric increase among so much of
others. The lowest mineralization at the well P3 (24 µs/cm) is located at an altitude of 333m and is on the rock,
it is what explained the lowest mineralization of this well.
However, from the conductivity point of view, we can classify the groundwater of the study area in
three groups: that with less mineralization water whose conductivity is lower than 300 µs/cm. This group
includes surface water, well and some borehole who are for most of them located in the West and a little
extreme East (Figure 3). The second group made up of fairly mineralization water whose conductivity lies
between 300 and 800 µs/cm. This one occupies Center-East and the South-west of the study area. Finally the
third group, with the highest mineralization with conductivities higher than 800 µs/cm. It occupies the Center-
South and corresponds to the points sampled in the town of Dapaong.
Water is characterized by a bicarbonate prevalence on nitrates, chlorides and sulphates. As for the
cations, calcium prevails followed sodium, magnesium and potassium. The facies HCO3-Ca and HCO3-Ca-Mg
are the major characteristic of water in basement zone in crystalline medium and cristallophyllian areas. They
are largely the dominant ions, and they represent more than 50% of the dissolved anion load. The work carried
out in other areas in Côte d'ivoire in medium of basement more precisely in the zone of Soubré in CI [24], the
area of Man in CI [25], in Kara region in Togo [6], and in plateau region in Togo [5] also highlight the
importance of the calcic and magnesian bicarbonated facies. It is the same for [23] which reveals an abundance
of calco-magnesian bicarbonated water (70%) in water of the fissured aquifers of the South-west of Niger. The
ions bicarbonates come mainly from the acid hydrolysis of the rocks. For example anorthite (plagioclase of the
calcic pole) produced kaolinite and releases from calcium and the ions bicarbonates according to the reaction:
CaAl2Si2O8 + 3H2O + 2CO2 Al2Si2O5(OH)4 + Ca2+
+ 2HCO3
-
For the cations, calcium and sodium have the most raised contents. That could be due to the fact that
the hydrolysis of the rocks, rich in alkaline feldspars and plagioclases acid and low in ferro-magnesiens, gives
Ca2+
contents and Na+
dominant for the cations [20]. The rather significant proportion of anorthite in
plagioclases, variety most easily liable to deterioration, justifies that Ca2+
concentration is higher than Na+
[26].
The prevalence of the calcic pole would result from the hydrolysis of the basic rocks such as
amphiboles. The sodic and potassic bicarbonated facies (F32 in Tchimouri at Pogno in the North-East of the
study area) is located at the extreme East; which according to the geological map is established on the chain of
the sandstones of Dapaong and would collect claystone rich in sodium. This borehole F32 could have also
undergone a cation phenomenon of exchange (Confer Fig 12). Fig 10 also indicates that silicates weathering is
the main source of sodium and bicarbonates and it exerts major control on groundwater and surface water in the
study area [27]. This result is in agreement with the findings of [28] for the entire basement aquifer of Northern
Ghana. According to water composition the excess of Na can be attributed to silicates weathering from
feldspars. [29] found that if silicate weathering is a probable source of sodium, HCO3- would be the most
abundant anion as it is in birrimian basin in Northern Togo. The result is consistent with the salinity values as
they are all lower than 500 mg/L except for a few number of samples. It is in the fact [30] stressed that the
weathering process taking place in waters with salinity < 500 mg/L is silicate weathering.
Ions SO4
2-
, NO3
-
and Cl-
have a significant correlation between them, which shows that they have a
common origin. These ions are concentrated in the boreholes of urban environment, it is probably due to urban
pollution. However in general, the chlorides are found in the form of traces in the rocks of the crystalline base
[31] and it is the same for nitrates and the sulphates which are primarily provided either by oxidation of the
pyrites or by the meteoric contribution [32].
The nitrates are present in 50% of the water samples of the boreholes located in urban environment:
FP1 (328.2mg/L), FP6 (161.6 mg/L) and FP8 (130.2 mg/L). The nitrates contents of these samples exceed the
standard of potability (Standards WHO). The ions nitrates are correlated with the chlorides (0.905). These latter
are often associated to anthropic activities because are not associated to preexistent rock. The ions nitrates NO3
-
; are present in nature where they belong to the cycle of nitrogen. They represent the most soluble form of
nitrogen. Mainly used as mineral manures for the growth of the plants and the synthesis of organic nitrogenized
compounds, the nitrates in excess can be found quickly in groundwater [13]. Waste containing of organic
nitrogen represents also a source of nitrates obtained starting from various biochemical processes](https://image.slidesharecdn.com/a330119-200817112608/85/A330119-16-320.jpg)
![Hydrochemical And Statistical Characterization Of Basement Aquifer Ground water In The…
Engineering Journal www.iajer.com Page | 17
(ammonification and nitrification) [33]. The concentrations raised out of sulphates which are sometimes
associated to high chloride and nitrate concentrations are clearly indicating of an anthropogenic pollution [34].
The impact of the anthropic activities on the quality of groundwater constitutes a major problem of a world
nature and is the subject of several studies: [35; 36]. This various works also showed the influence of anthropic
contributions in the quality of groundwater. However borehole F63, located in rural medium has a concentration
of 123.4 mg/L in nitrates, this justifies an intense practice of agricultural activities accompanied by the use of
artificial fertilisers.
The nitrates NO3
-
have a surface origin and thus come from the anthropic activities. However, the
nitrate concentrations in boreholes belonging to the chlorinated and sulphated facies calcic and magnesian
exceed all the standards of potability of WHO (50 mg/L). This confirms the surface origin of the recharge of
these aquifers.
The Factor F1 of the PCA indicates that Cl-
, Na+
, and SO4
2-
and NO3
-
are put in solution by the same
phenomenon. The regrouping around the axis F1 also indicates the processes of mineralization by surface water
infiltration and dissolution of the rock. The elements which define this factor come from infiltration and a long
residence time in solution following the contact water-rock. These elements come from the hydrolysis of
minerals present in the rocks which constitute the rock substratum of the aquifers which shelter water of the
zone of study [37]. Indeed, the factor F1 thus expresses the phenomenon of mineralization residence time by
dissolution. The chlorides, sulphates and nitrates are almost always less in water resulting from granites [38;
39], but there place is to notice that the concentrations are not negligible in water of the alterity aquifers.
Sodium Na+
comes from the deterioration of feldspars contained in the igneous rocks, of the attack of
clayey minerals and the dissolution of soluble salt grains contained in the rocks and the beds of evaporites. It
should be noticed that the geology of the study area is dominated by the formations of Paleoproterozoïc made up
mainly of granites and gneiss. The hydrolysis of such rocks rich in alkaline feldspars and acid plagioclases,
explains the fact that the Ca2+
contents and Na+
are dominant for the cations in groundwater. These ions result
from the deterioration of the rocks and the weathering of silicated minerals [40].
IV. CONCLUSION
The groundwater quality in the Northern Togo has been evaluated for their chemical composition and
suitability for human consumption. In this study, a combined hydrochemical, hydrogeological and varied
statistical analysis methods are used to understand the mineralization status and geochemical processes
occurring in birrimian basement. This study in hydrochemical results show that groundwater has in majority
between fresh water and fairly mineralization water. However, some points have high mineralization because of
anthropic origin, signs of an urban pollution. The geochemistry of groundwater beneath the city of Dapaong
does suggest that the leaky sewage system, septic wells and other point source of contamination have most
likely impacted groundwater quality. The hydrofacies approach shows the existence of four facies largely
dominated by the facies HCO3-Ca and the facies HCO3-Ca-Mg. The analysis factorial by statistical units
highlighted three (3) groups of water: Group 1 made up the highest mineralization water which contents higher
nitrates than the standard of potability of WHO. Group 2 is characterized by the high bicarbonates
concentrations and an average mineralization, then group 3 concerns the wells and the majority of boreholes of
the study area with low electric conductivity. Principal Components Analysis (PCA), Hierarchical Cluster
Analysis (HCA) and the different diagrams of correlation indicate that the mineralization of groundwater in the
study area is controlled by the silicates weathering related to the residence time of water in the aquifer. These
results indicate that future development of urban areas within birrimian basin in North Togo, especially those
located on the recharge areas could represent a serious threat to groundwater quality. This study gave results
certainly interesting but it deserves to be supplemented by other investigations in particular a study on isotopic
hydrology, heavy metals, the pesticides as well as a bacterial study. This work will allow us to have a data base
for a follow-up of physicochemical of groundwater in the study area.
REFERENCES
[1]. Rapport de mission de consultation sur les OMD de l’eau potable et de l’assainissement au Togo 2007.
[2]. Koffi K. V., 2017. Hydrogeochemistry and impacts of climate change on groundwater recharge: Case
study of the crystalline basement aquifer of Northern Ghana. Thèse de Doctorat de l’Université
d’Abomey-Calavi; p241.
[3]. Amadou H., Mahaman S. L., Abdou S. M., 2014. Caractérisation hydro chimique des eaux souterraines
de la région de Tahoua (Niger). Journal of Applied Biosciences 80:7161 – 7172
[4]. PNUD, FAO., 2001. Proposition de services dans le secteur de l’eau – Politiques et stratégies de
gestion intégrée des ressources en eau (GIRE). TOG/00/008/A/08/01. Document de service d’appui à
l’élaboration de politiques et de programmes (SAEPP).](https://image.slidesharecdn.com/a330119-200817112608/85/A330119-17-320.jpg)
![Hydrochemical And Statistical Characterization Of Basement Aquifer Ground water In The…
Engineering Journal www.iajer.com Page | 18
[5]. Akpataku, K. V., Gnazou, M. D. T., Bawa, L. M., Djaneye-Boundjou G. et Faye, S., 2015. Étude
hydrogéochimique du système aquifère granito-gneissique dans la préfecture du Moyen-Mono, Togo,
Afrique SCIENCE 12(2) 38 – 53
[6]. Zoulgami S., M. D. T. Gnazou M. D. T.*,Kodom T. G. Djaneye-Boundjou G. BAWA L. M., 2015.
Physico-chemical study of groundwater in the Northeast of Kara region (Togo). Int. J. Biol. Chem. Sci.
9(3): 1711-1724.
[7]. Assouma, D., 1988. Etude par modèle mathématique de la structure et du fonctionnement d’un aquifère
de socle exploitée, en région tropicale (Alimentation en eau potable de la ville de Dapaong). Thèse de
Doctorat de 3ème cycle, Université d’Orléans. p183.
[8]. Dewandel B, Lachassagne P, Wyns R, Marechal JC, Krishnamurthy NS., 2006. A generalized 3-D
geological and hydrogeological conceptual model of granite aquifers controlled by single or multiphase
weathering. Journal of Hydrology, 330:260284.doi:10.1016/j.jhydrol.2006.03.026.
[9]. Alassane A. 2011. Pratique de l’élevage et évolution du milieu naturel dans la région des Savanes
(Nord-Togo) et dans le Nord-Ouest du département de l’Atacora (Bénin). Thèse de Doctorat unique de
Géographie, Université de Lomé ; p40
[10]. Ahoussi K. E., Soro N., Soro G., Lasm T., Oga M. S., Zade S. 2008. Groundwater Pollution in Africans
Biggest Towns: Case of the Town of Abidjan (Côte d’Ivoire). European Journal of Scientific Research,
20(2), 302-316.
[11]. Biémi J., 1992. Contribution à l’étude géologique, hydrogéologique et par télédétection des bassins
versants Subsahéliens du socle précambrien d’Afrique de l’Ouest : Hydrostructurale, hydrochimie et
isotopie des aquifères discontinus des sillons et aires granitiques de la Haute Marahoué (Côte d’Ivoire).
Thèse d’Etat, Université Nationale de Côte d’Ivoire, p. 480.
[12]. Yidana SM, Ophori D, Banoeng-Yakubo B., 2008. A multivariate statistical analysis of surface water
chemistry data. The Ankobra Basin, Ghana. Journal of Environmental Management, 86: 80-87.
[13] O.M.S, 2000. «Directives de qualité pour l’eau de boisson». 2nd Ed., Vol 2, Critères d’hygiène et
documentation à l’appui, 1050p
[14]. Mangin A., 1974. Contribution à l’étude hydrodynamique des aquifères karstiques. Concepts
méthodologiques adoptés. Systèmes karstiques étudiés. Ann. Spéléol. 29, 4, 495.601.
[15]. Belkhiri L, Boudoukha A, Mouni L, Baouz T., 2010. Application of multivariate statistical methods
and inverse geochemical modeling for characterization of groundwater—A case study: Ain Azel plain
(Algeria). Geoderma 159:390–398. doi: 10.1016/j.geoderma.2010.08.016
[16]. Kumar P.S, Jegathambal P, Nair S. James EJ., 2015. Temperature and pH dependent geochemical
modeling of fluoride mobilization in the groundwater of a crystalline aquifer in southern India. J
Geochem Explor 156:1–9. doi: 10.1016/j.gexplo.2015.04.008
[17]. Kortatsi BK., 2006. Hydrochemical characterization of groundwater in the Accra plains of Ghana.
Environ Geol 50:299–311. doi: 10.1007/s00254-006-0206-4
[18]. Yaméogo S., 2008. Ressources en eau souterraine du centre urbain de Ouagadougou au Burkina Faso :
Qualité et Vulnérabilité. Thèse de doctorat en Sciences de l’Université d’Avignon et des Pays de
Vaucluse, p254
[19]. Ousmane B., 1988. Etude géochimique et isotopique des aquifères de socle de la bande sahélienne du
Niger (Liptako, Sud-Maradi, Zinder-Est). Thèse Univ. Niamey, p175.
[20]. Faillat J.P. et Drogue C., 1993. Différenciation hydrochimique des nappes superposées d’altérites et de
fissures en socle granitique. Journal des Sciences hydrologiques, pp215-229.
[21]. Van der Weijden CH, Pacheco F., 2003. Hydrochemistry, weathering and weathering rates on Madeira
Island
[22]. Drever, J.I., 1988. The Geochemistry of Natural Waters, 2nd Edition: Prentice, Englewood Cliffs, New
Jersey, 402 p.
[23]. Abdou Babaye M. S., Sandao I., Saley M. B., Wagani I., Ousmane B., 2016. Comportement
hydrogéochimique et contamination des eaux des aquifères fissurés du socle précambrien en milieu
semi-aride (Sud-Ouest du Niger). Int. J. Biol. Chem. Sci. 10(6): 2728-2743
[24]. Soro N., 2002. Hydrochimie et géochimie et isotopique des eaux souterraines du degré carré de Grand-
lahou et ses environs (sud-ouest de la côte d’ivoire). Implications hydrologiques et hydrogéologiques.
Thèse, de doctorat, Université de Cocody, Abidjan, p 256.
[25]. Goné D.L. Savané I. Yao NA. Biémi J., 2005. Mobilité relative des cations majeurs lors de l’altération
des roches et acquisition de la minéralisation des eaux souterraines dans le degré carré de Man. Sci.
Nat., 2(1): 85-94.
[26]. Ouedraogo M., 2016. Caractérisation des aquifères de socle pour l'amélioration de la productivité des
forages d'hydraulique villageoise dans le bassin versant du Bandama blanc amont (Nord de la Côte
d'Ivoire). Thèse de Doctorat de l’Université Paris-Sud ; 241p.](https://image.slidesharecdn.com/a330119-200817112608/85/A330119-18-320.jpg)
![Hydrochemical And Statistical Characterization Of Basement Aquifer Ground water In The…
Engineering Journal www.iajer.com Page | 19
[27]. Rajmohan N. Elango L., 2004. Identification and evolution of hydrogeochemical processes in the
groundwater environment in an area of the Palar and Cheyyar River Basins, Southern India. Environ
Geol 46:47–61 . doi: 10.1007/s00254-004-1012-5
[28]. Loh YS. Banoeng-Yakubo B. Yidana SM., 2012. Hydrochemical Characterisation of
Groundwater in Parts of the Volta Basin, Northern Ghana. Ghana Min J 13:24–32
[29]. Rogers RJ, 1989. Geochemical comparison of ground water in areas of New England, New York, and
Pennsylvania. Ground Water 27:690–712
[30]. Hounslow A., 1995. Water quality data: analysis and interpretation. Lewis Publishers, Boca Raton
[31]. Travi Y, J.Y. GAC, J.Ch. Fontes, B. Fritz, 1987. Reconnaissance chimique et isotopique des eaux de
pluie au Sénégal. Géodynamique 2 (1), p : 43- 53.
[32]. Ousmane. B, J.Ch Fontes J.F Aranyossy, A. Joseph, 1983. Hydrologie isotopique et hydrochimie des
aquifères discontinus de la bande sahélienne et de l’Aïr (Niger). IAEA-SM- 270/59 p : 365-395.
[33]. Aghzar N, Bellouti H et Soudi B., 2001. Pollution nitrique des eaux souterraines au Tadla (Maroc).
Rev. Sci. Eau, 15(2) 459-492.
[34]. Walraevensa K.,Bakundukizea C., Mtonia, Y. E., Campa M. V., 2018. Understanding the
hydrogeochemical evolution of groundwater in Precambrian basement aquifers: A case study of
Bugesera region in Burundi; Journal of Geochemical Exploration.
[35]. Bricha S., Ounine K., Oulkheir S., EL Haloui N., Attarassi B., 2007. Etude de la qualité
physicochimique de la nappe phréatique M’nasra (Maroc). Afrique SCIENCE 03 (3), 391-404.
[36]. El Asslouj J., Kholtei S., El Amrani-Paaza N., Hilali A., 2007. Impact des activités anthropiques sur la
qualité des eaux souterraines de la communauté Mzamza (Chaouia, Maroc). Revue des sciences de
l'eau, vol. 20, n° 3, 309-321.
[37]. Eblin S.G.*, Soro G.M., Sombo A.P., Aka N., Kambiré O. Soro N., 2014. Hydrogéochimie des eaux
souterraines de la région d’Adiaké (Sud-Est côtier de la Côte d’Ivoire), Larhyss Journal, ISSN 1112-
3680, n°17, Mars 2014, pp. 193-214
[38]. Travi. Y, et O. Dia, D. Fohlen, 1988. Hydrogéochimie des eaux souterraines de quelques formations de
socle au Sénégal Oriental. 14 pages.
[39]. Onugba. A., 1990. Contribution à la connaissance des systèmes aquifères de la Haute Benoué (Nigéria)
: Etude hydro chimique et isotopique de zones témoins du socle et du sédimentaire. Vulnérabilité des
forages à la pollution. Thèse de doctorat. Université d’Avignon et des pays de Vaucluse. 183 p.
[40]. Savané I, Soro N. 2001. Caractérisation chimique et isotopique des eaux souterraines du Nord-Ouest de
la Côte: recharge des aquifères discontinus de la région d’Odienné. Africa Géoscience Review, 8(4):
379-390.](https://image.slidesharecdn.com/a330119-200817112608/85/A330119-19-320.jpg)


![11.[40 51]correlates in groundwater quality parameters and textural classes o...](https://cdn.slidesharecdn.com/ss_thumbnails/11-40-51correlatesingroundwaterqualityparametersandtexturalclassesofsoilsinaperi-industrialdistrictofthenigeriandeltaregion-120512235818-phpapp02-thumbnail.jpg?width=640&height=640&fit=bounds)