Download as PDF, PPTX

![Andreas Deuter, Hans-Jürgen Koch IWSM-Mensura 2015
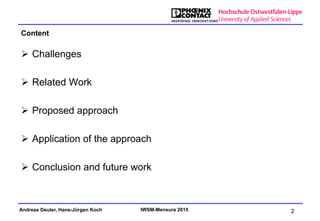
Related Work
Ø Agility extension of
traditional V-model
Ø Reduces Work in
Progress (WiP)
Ø Documents are
container of Work Items
Ø Links between Work
Items to form “V”
Sliced V-model [1]
5
[1] A. Deuter, “Slicing the V-model - Reduced effort, higher flexibility” in Proceedings of 8th International Conference on Global Software Engineering,
ICGSE’13, 2013, pp. 1–10.](https://image.slidesharecdn.com/applyingmanufacturingperformancefigurestomeasuresoftwaredevelopmentexcellence-andreasdeuter-151021054137-lva1-app6892/85/Applying-manufacturing-performance-figures-to-measure-software-development-excellence-andreas-deuter-5-320.jpg)
![Andreas Deuter, Hans-Jürgen Koch IWSM-Mensura 2015
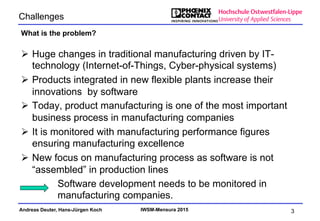
Related Work
Ø Productivity increases in manufacturing motivates to
investigate applicable methods for software
Ø Prominent example is Kanban[5], which has been transferred
to software[6]
Ø Mixed picture, if manufacturing methods are applicable to
software – no’s[7] and yes’s[8]
Ø Research topic with little focus
Transfer from manufacturing to software
6
[5] Liker, J.: The Toyota Way. 1st edn. McGraw-Hill (2004)
[6] Hiranabe, K.: Kanban applied to software development: from agile to lean. http://www.infoq.com/articles/hiranabe-lean-agile-kanban (2008) [2015-04-24].
[7] Binder, R.: Can a manufacturing quality model work for software? Software, IEEE 14(5) (Sep 1997) 101
[8] Schneidewind, N.: What can software engineers learn from manufacturing to improve software process and product? In: Intelligent Information Management.
Volume 1. (2009)](https://image.slidesharecdn.com/applyingmanufacturingperformancefigurestomeasuresoftwaredevelopmentexcellence-andreasdeuter-151021054137-lva1-app6892/85/Applying-manufacturing-performance-figures-to-measure-software-development-excellence-andreas-deuter-6-320.jpg)
![Andreas Deuter, Hans-Jürgen Koch IWSM-Mensura 2015
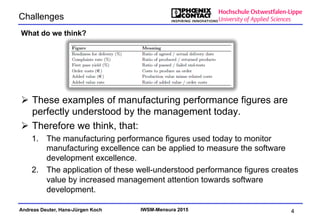
Related Work
Ø Numerous articles, books and studies [2][3][4]
Ø Question to managers: “Do you understand the meaning of
these performance figures?“
• Answer: “Rather no”
Ø Option A:
• Explain managers software performance figures
Ø Option B:
• Use known manufacturing performance figures and apply them to
software
• We chose this option
Software Performance Figures
7
[2] Fenton, N., Pfleeger, S.L.: Software metrics (2nd ed.): a rigorous and practical approach. PWS Publishing Co., Boston, MA, USA (1997)
[3] Kasunic, M.: A data specifcation for software project performance measures: Results of a collaboration on performance measurement. Technical Report CMU/SEI-
2008-TR-012, Software Engineering Institute, Carnegie Mellon University, Pittsburgh,Pennsylvania (2008)
[4] Hartmann, D., Dymond, R.: Appropriate agile measurement: using metrics and diagnostics to deliver business value. In: Agile Conference, 2006. (July 2006) 6](https://image.slidesharecdn.com/applyingmanufacturingperformancefigurestomeasuresoftwaredevelopmentexcellence-andreasdeuter-151021054137-lva1-app6892/85/Applying-manufacturing-performance-figures-to-measure-software-development-excellence-andreas-deuter-7-320.jpg)
![Andreas Deuter, Hans-Jürgen Koch IWSM-Mensura 2015
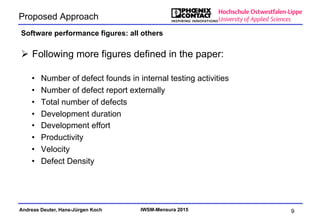
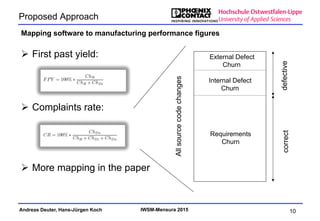
Proposed Approach
Ø Software documentation
size Docr
• Number of Work Items
Software performance figures: Quantity and Quality
8
Ø Requirements churn[5] Chr
• Size of code changes [KB] to
implement requirement
Ø Internal defect churn Chdi
• Size of code changes to fix
internally reported defects
Ø External defect churn Chdx
• Size of code changes to fix
externally reported defects
[5] Sjoberg, D.I., Johnsen, A., Solberg, J.: Quantifying the effect of using Kanban versus scrum: A case study. IEEE Software 29 (2012) 47{53](https://image.slidesharecdn.com/applyingmanufacturingperformancefigurestomeasuresoftwaredevelopmentexcellence-andreasdeuter-151021054137-lva1-app6892/85/Applying-manufacturing-performance-figures-to-measure-software-development-excellence-andreas-deuter-8-320.jpg)
![Andreas Deuter, Hans-Jürgen Koch IWSM-Mensura 2015
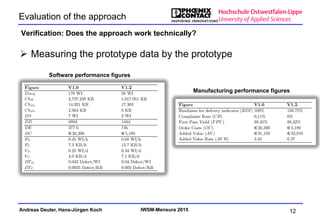
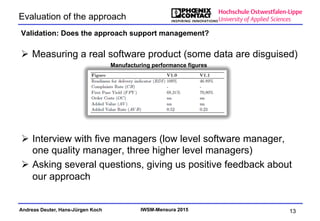
Evaluation of the approach
Ø Phoenix Contact supplier of electrical and electronic
components for industrial applications.
• >14,000 employees (2014), 51 owned sales companies and more than
30 sales partners worldwide.
• Software activities are carried out in three locations Bad Pyrmont,
Lemgo (Germany), Ann Arbor (USA).
Ø Sliced V-Model implemented
using Polarion ALM [6]
Ø Prototype implementing
our approach above concept
Who is the industrial partner?
11
[6] Polarion. http://www.polarion.com, 2015.](https://image.slidesharecdn.com/applyingmanufacturingperformancefigurestomeasuresoftwaredevelopmentexcellence-andreasdeuter-151021054137-lva1-app6892/85/Applying-manufacturing-performance-figures-to-measure-software-development-excellence-andreas-deuter-11-320.jpg)

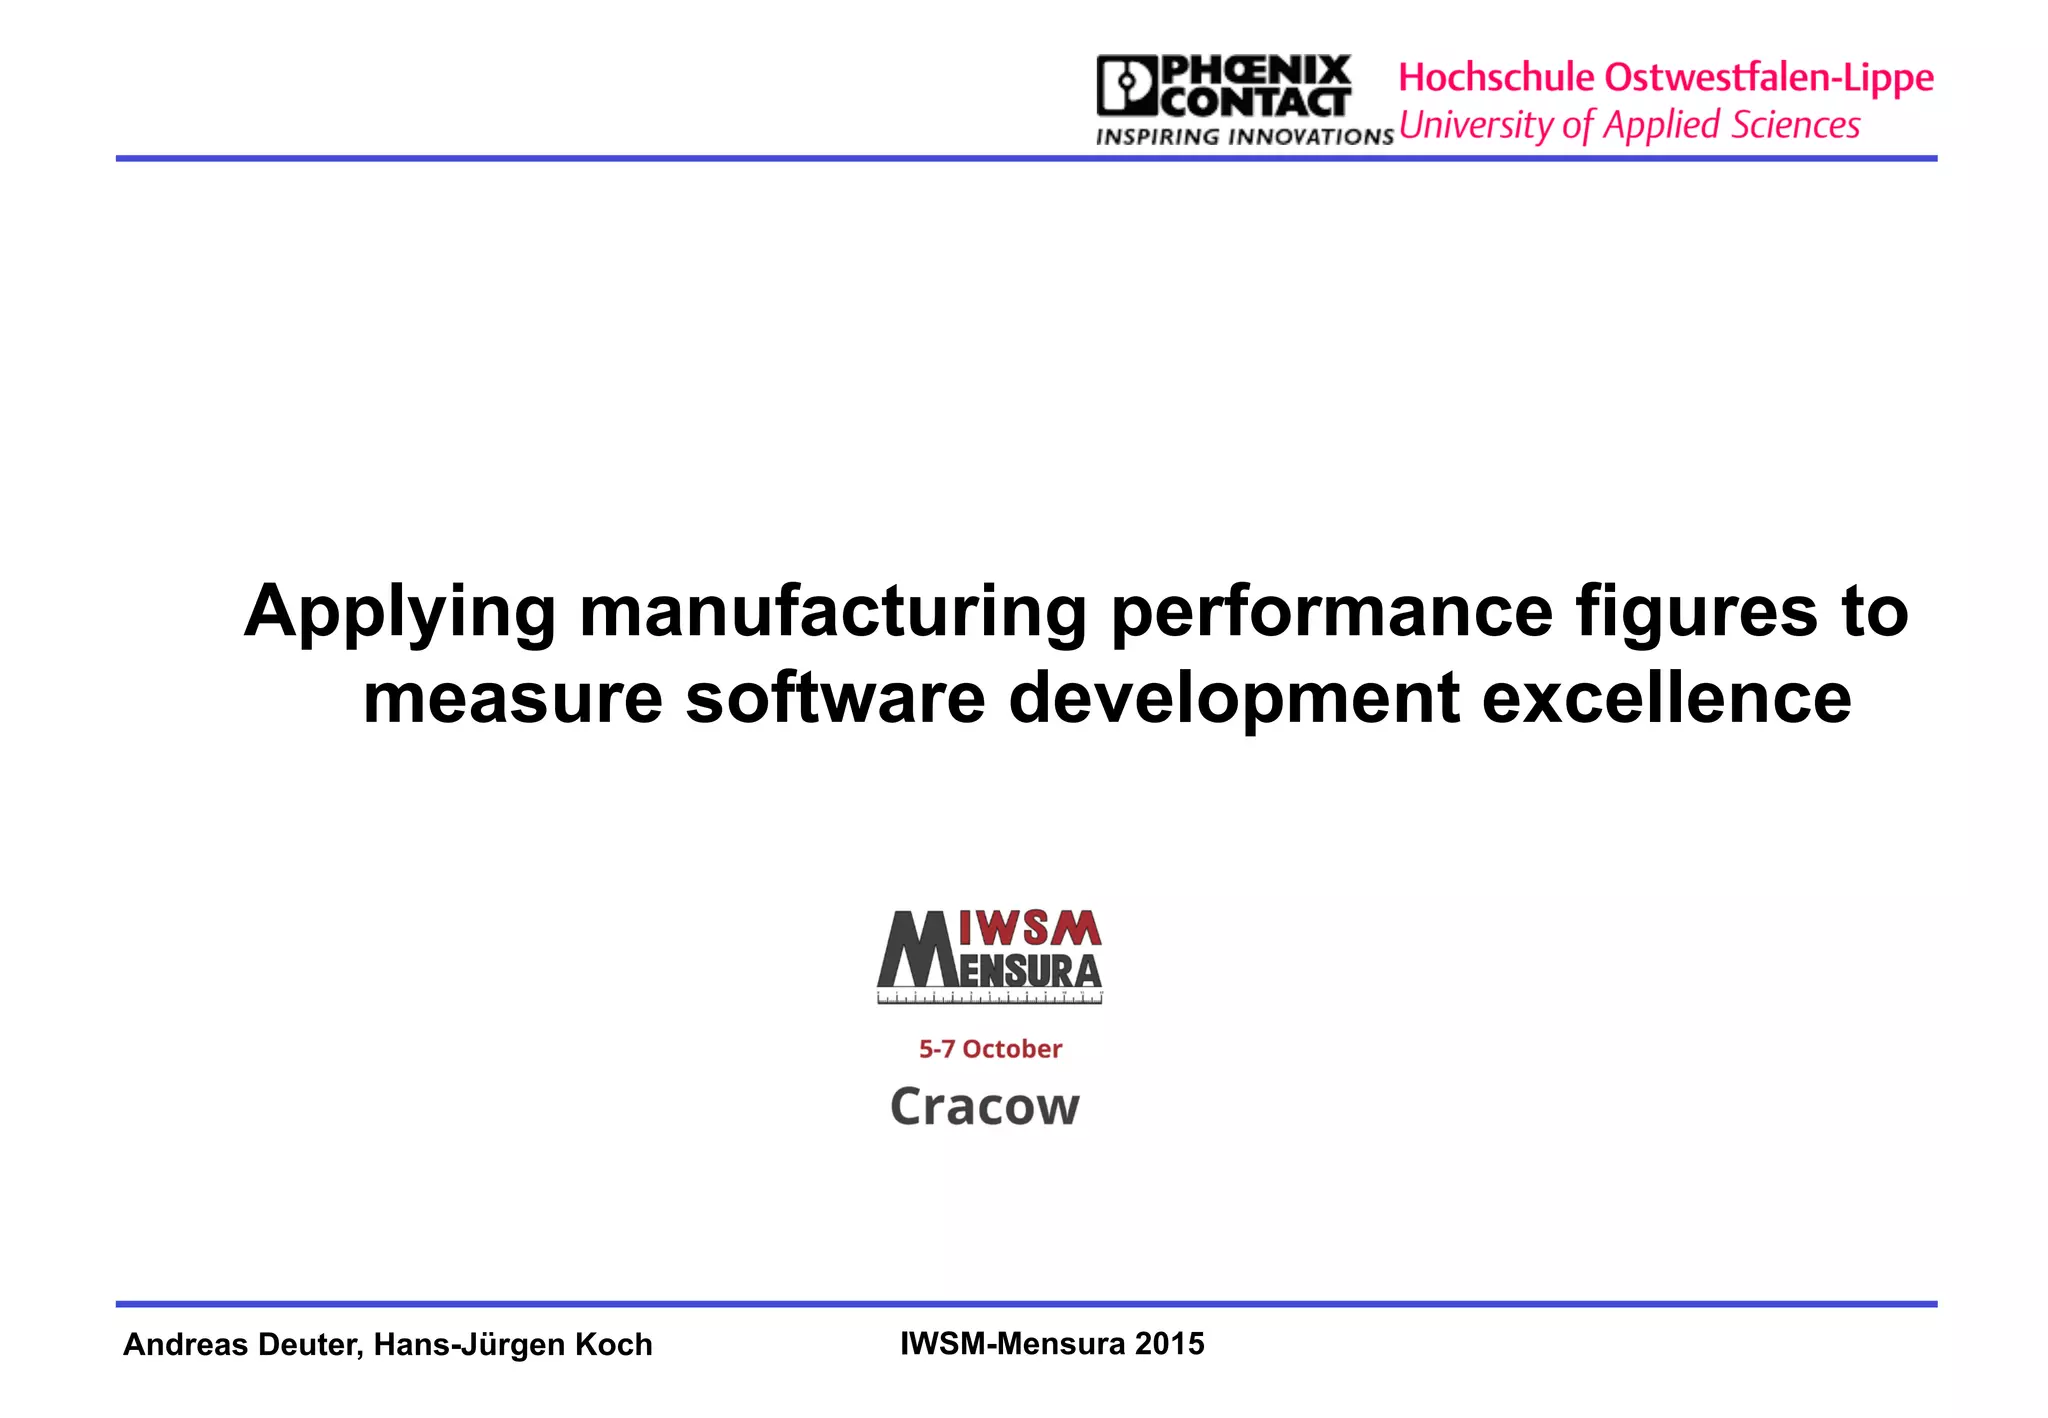
This document proposes applying manufacturing performance figures to measure software development excellence. It discusses challenges in monitoring software development in manufacturing companies. The authors believe manufacturing KPIs can be applied to software since managers understand these KPIs. The document outlines related work transferring methods from manufacturing to software. It then proposes specific manufacturing KPIs that can be mapped to software metrics to measure quantity and quality. An industrial partner validated the approach technically by measuring prototype data and gained management support through interviews. While limited, the validation was positive. More work is needed to generalize the approach.