Downloaded 100 times
![Mark Kofman Co-founder at PROGRAMETER Metrics tracking kit for software development Interests: software quality, metrics, startups, entrepreneurship, distributed and multi-culture teams Contact details: Email: [email_address] Skype: kofman Twitter: @markkofman](https://image.slidesharecdn.com/2010-softeconomics-lecture-3-100930022719-phpapp02/85/Software-Measurement-Lecture-3-Metrics-in-Organization-2-320.jpg)


![E-mail: [email_address] Skype: kofman](https://image.slidesharecdn.com/2010-softeconomics-lecture-3-100930022719-phpapp02/85/Software-Measurement-Lecture-3-Metrics-in-Organization-82-320.jpg)


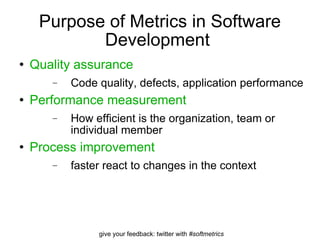
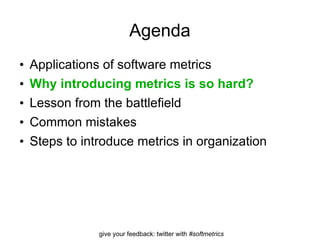
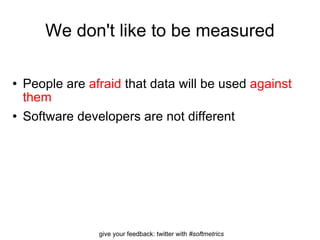
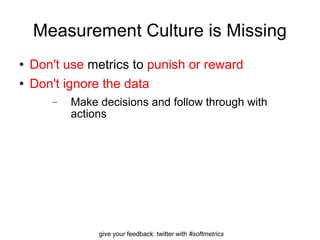
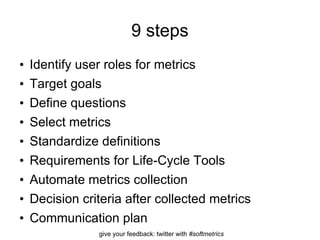
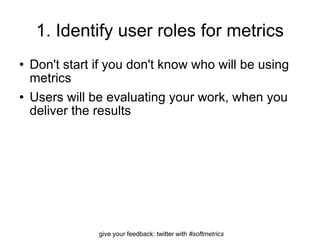
The document discusses the importance of software metrics in organizations for quality assurance, performance measurement, and process improvement. It outlines common challenges in implementing metrics, strategies for successful adoption, and emphasizes the need for a measurement culture to avoid misuse of data. Additionally, it provides a structured approach via a step-by-step framework to effectively introduce metrics into software development practices.