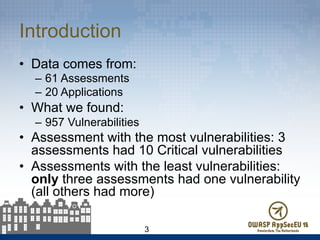
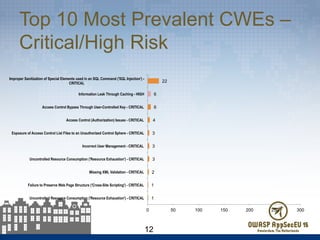
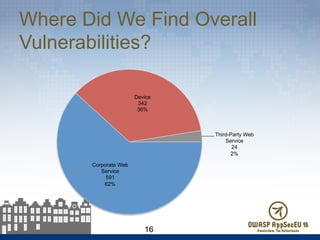
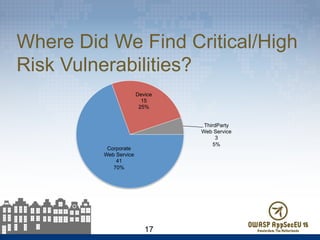
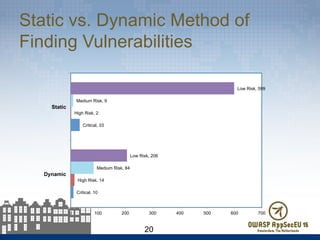
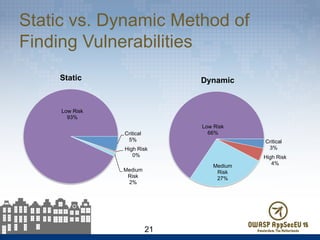
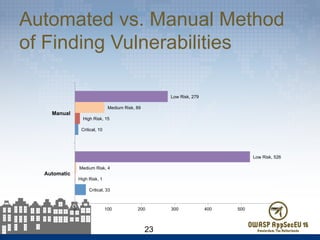
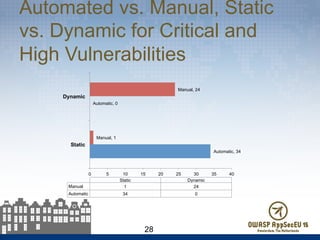
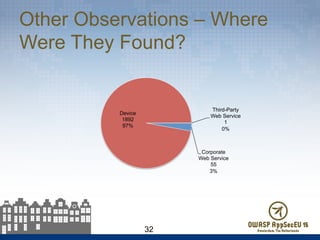
Dan Cornell
@danielcornell
Mobile Application
Assessments By the
Numbers – A Whole-Istic
View
Agenda
•  Background
–  Mobile Application Threat Model
–  Assessment Methodology
–  Data Collected
•  Findings
–  Types of Vulnerabilities Identified
–  Where Vulnerabilities Were Identified
–  How Vulnerabilities Were Identified
2
Introduction
•  Data comes from:
–  61 Assessments
–  20 Applications
•  What we found:
–  957 Vulnerabilities
•  Assessment with the most vulnerabilities: 3
assessments had 10 Critical vulnerabilities
•  Assessments with the least vulnerabilities:
only three assessments had one vulnerability
(all others had more)
3
Research Background
•  Mobile application threat model
•  Assessment methodology
– Static versus dynamic testing
– Automated versus manual testing
•  Why CWE?
•  Assessment data
4
Mobile Application Threat Model
•  More complicated than a
“typical” web application
threat model
•  Not just about code
running on the device
•  Main components:
–  Mobile application
–  Enterprise web services
–  3rd party web services
5
Assessment Methodology
•  Testing activities
–  Combination of both static and dynamic activities
–  Combination of automated tools, manual review
of automated test results and manual testing
•  Scope can include:
–  Code running on the device itself
–  Enterprise services
–  3rd party supporting services
6
Determining Severity
Based on customized DREAD
model
•  Damage potential
•  Reproducibility
•  Exploitability
•  Affected users
•  Discoverability
•  Each factor ranked 1-3
Collapsed to single
dimension
•  Critical: > 2.6
•  High: 2.3 – 2.6
•  Medium: 2.0 – 2.3
•  Low: < 2
7
Why CWE?
•  Vulnerability taxonomy used was MITRE’s Common
Weakness Enumeration (CWE)
–  http://cwe.mitre.org/
•  Every tool has its own “spin” on naming vulnerabilities
•  OWASP Top 10 / WASC 24 are helpful but not
comprehensive
•  CWE is exhaustive (though a bit sprawling at times)
•  Reasonably well-adopted standard
•  Many tools have mappings to CWE for their results
8
Assessment Data
•  Subset of mobile assessments
•  Mostly customer-facing applications from
financial services organizations
•  Primarily iOS and Android applications
– Some WAP, Windows Phone 7
9
Types of Vulnerabilities Found
•  Top 10 Most Prevalent CWEs – Overall
•  Top 10 Most Prevalent CWEs – Critical/
High Risk
10
Top 10 Most Prevalent CWEs –
Overall
11
14
14
16
20
21
21
22
26
271
284
0 50 100 150 200 250 300
Use of a Broken or Risky Cryptographic Algorithm - LOW RISK
Information Exposure Through an Error Message - LOW RISK
Cross-Site Request Forgery (CSRF) - LOW RISK
Information Leak Through Debug Information - LOW RISK
External Control of System or Configuration Setting - LOW RISK
Improper Input Validation - LOW RISK
Improper Sanitization of Special Elements used in an SQL Command ('SQL Injection') - CRITICAL
Cleartext Transmission of Sensitive Information - LOW RISK
Information Exposure - LOW RISK
Information Leak Through Log Files - LOW RISK
Top 10 Most Prevalent CWEs –
Critical/High Risk
12
1
1
2
3
3
3
4
6
6
22
0 50 100 150 200 250 300
Uncontrolled Resource Consumption ('Resource Exhaustion') - CRITICAL
Failure to Preserve Web Page Structure ('Cross-Site Scripting') - CRITICAL
Missing XML Validation - CRITICAL
Uncontrolled Resource Consumption ('Resource Exhaustion') - CRITICAL
Incorrect User Management - CRITICAL
Exposure of Access Control List Files to an Unauthorized Control Sphere - CRITICAL
Access Control (Authorization) Issues - CRITICAL
Access Control Bypass Through User-Controlled Key - CRITICAL
Information Leak Through Caching - HIGH
Improper Sanitization of Special Elements used in an SQL Command ('SQL Injection') -
CRITICAL
OWASP Top 10 Mobile Risks
•  Similar to the OWASP Top 10 Web Application
Risks, but targeted at mobile applications
(obviously)
•  Top risks to mobile applications:
–  https://www.owasp.org/index.php/
OWASP_Mobile_Security_Project#tab=Top_Ten_Mob
ile_Risks
•  Work in progress to update this based on
industry-contributed data
13
OWASP Top 10 Mobile Risks
M1: Weak Server Side
Controls
M2: Insecure Data Storage
M3: Insufficient Transport
Layer Protection
M4: Unintended Data
Leakage
M5: Poor Authorization and
Authentication
M6: Broken Cryptography
M7: Client Side Injection
M8: Security Decisions Via
Untrusted Inputs
M9: Improper Session
Handling
M10: Lack of Binary
Protection
14
Compare to OWASP Top 10
Mobile Risks
15
Strong Overlap
•  Weak server-side controls
•  Poor authentication and
authorization
•  Security decisions via
untrusted inputs
Overlap
•  Insecure data storage
•  Insufficient transport layer
protection
•  Improper session handling
•  Unintended data leakage
•  Broken cryptography
Weak Overlap
•  Client-side injection
•  Lack of binary protection
Where Did We Find Overall
Vulnerabilities?
16
Corporate Web
Service
591
62%
Device
342
36%
Third-Party Web
Service
24
2%
Where Did We Find Critical/High
Risk Vulnerabilities?
17
Corporate
Web Service
41
70%
Device
15
25%
ThirdParty
Web Service
3
5%
Analysis of “Where” Data
•  Mobile security is about more
than the code running on the
device
•  The things we really care
about (Critical, High) are most
frequently found on corporate
web services
–  Then on the device
–  Then on 3rd party web
services
•  Reflects the “scale” benefits of
finding web services
vulnerabilities
18
How Did We Find
Vulnerabilities?
•  Static vs. dynamic testing
•  Automated vs. manual testing
•  What techniques identified the most
vulnerabilities?
•  What techniques identified the most
serious vulnerabilities?
19
Static vs. Dynamic Method of
Finding Vulnerabilities
20
Critical, 10
Critical, 33
High Risk, 14
High Risk, 2
Medium Risk, 84
Medium Risk, 9
Low Risk, 206
Low Risk, 599
0 100 200 300 400 500 600 700
Dynamic
Static
Static vs. Dynamic Method of
Finding Vulnerabilities
21
Critical
5%
High Risk
0%
Medium
Risk
2%
Low Risk
93%
Static
Critical
3%
High Risk
4%Medium
Risk
27%
Low Risk
66%
Dynamic
Critical and High Risk
Vulnerabilities•  Static testing was more
effective when finding
serious (Critical and High)
vulnerabilities
•  But it also found a lot of
lower-risk vulnerabilities
(as well as results that
had to be filtered out)
22
Found with
Dynamic
Testing
24
41%
Found with
Static
Testing
35
59%
Critical/High Risk Vulnerabilities Found
Automated vs. Manual Method
of Finding Vulnerabilities
23
Critical, 33
Critical, 10
High Risk, 1
High Risk, 15
Medium Risk, 4
Medium Risk, 89
Low Risk, 526
Low Risk, 279
0 100 200 300 400 500 600
Automatic
Manual
Automated vs. Manual Method
of Finding Vulnerabilities
24
Critical
6%
High Risk
0%
Medium
Risk
1%
Low Risk
93%
Automatic
Critical
2%
High Risk
4%Medium
Risk
23%
Low Risk
71%
Manual
Automated vs. Manual Method of Finding
Vulnerabilities (Critical and High)
•  Automated testing was
more effective when
finding serious (Critical
and High) vulnerabilities
25
Found with
Automated
Testing
34
58%
Found with
Manual
Testing
25
42%
Critical/High Risk Vulnerabilities Found
Automated vs. Manual, Static
vs. Dynamic Methods
26
Critical, 33
Critical, 10
Critical, 0
High Risk, 1
High Risk, 14
High Risk, 1
Medium Risk, 4
Medium Risk, 84
Medium Risk, 73
Low Risk, 526
Low Risk, 206
Low Risk, 5
0 100 200 300 400 500 600
Automatic / Static
Manual / Dynamic
Manual / Static
Automatic / Static Manual / Dynamic Manual / Static
Low Risk 526 206 5
Medium Risk 4 84 73
High Risk 1 14 1
Critical 33 10 0
Automated vs. Manual, Static
vs. Dynamic Methods
27
Automatic, 564
Automatic, 0
Manual, 79
Manual, 314
0 100 200 300 400 500 600
Static
Dynamic
Static Dynamic
Manual 79 314
Automatic 564 0
Automated vs. Manual, Static
vs. Dynamic for Critical and
High Vulnerabilities
28
Automatic, 34
Automatic, 0
Manual, 1
Manual, 24
0 5 10 15 20 25 30 35 40
Static
Dynamic
Static Dynamic
Manual 1 24
Automatic 34 0
Analysis of “How” Data
•  A comprehensive mobile application security
assessment program must incorporate a
significant manual testing component
•  Automated tools for testing mobile applications
are not as mature as those for testing web
applications
•  Web services can be challenging to test in an
automated manner
29
On-Device Vulnerabilities By
Platform
Platforms Number of
Assessments
on Device
Number of Total
Vulnerabilities
on Device
Average Number of
Vulnerabilities Found per
Assessment
iOS 39 252 6.5
Android 19 84 4.4
Windows Phone
7
1 3 3
WAP 1 3 3
30
Other Observations
•  We also include “other observations” as part of
our assessments
•  These reflect:
–  Application weaknesses
–  Coding flaws or behavior that are not “best practice”
but do not reflect an immediate, exploitable
vulnerability
•  We had 1,948 “other observations”
–  Roughly twice as many as actual vulnerabilities
31
Other Observations – Where
Were They Found?
32
Corporate
Web Service
55
3%
Device
1892
97%
Third-Party
Web Service
1
0%
What Does This Mean?
•  Most of these “other observations” are about code on the
device
–  Mobile application developers need help building better code
–  AND automated code scanning tools need to be better about
filtering less valuable results
•  Something that is not a problem today could be later on
–  Identification of new platform vulnerabilities
–  Changes coming along with a new application release
33
Conclusions
•  What To Test?
–  Mobile “apps” are not standalone applications
–  They are systems of applications
–  Serious vulnerabilities can exist in any system component
•  How To Test?
–  Mobile application testing does benefit from automation
–  Manual review and testing is required to find the most serious
issues
–  A combination of static and dynamic testing is required for
coverage
34
Recommendations
•  Plan your mobile application assessment strategy with
coverage in mind
•  Evaluate the value of automation for your testing
–  More “cost” than simply licensing – deployment time and results
culling
•  Look for opportunities to streamline
–  Fast application release cycles can require frequent
assessments
–  Control scope:
•  Assess application changes (versus entire applications)
•  Manage cost of reporting
35
Next Steps (For Us)
•  Incorporate more assessment data
•  Collaboration with OWASP Top 10 Mobile Risks
–  Currently being reworked based on data sets such as ours
•  Better analysis of applications over time
•  Updated release of Secure Mobile Application
Development Reference
–  Previous (outdated) release available online
http://www.denimgroup.com/media/pdfs/
MobileDevReference.pdf
36
Questions?
Dan Cornell
dan@denimgroup.com
Twitter: @danielcornell
www.denimgroup.com
+1 (210) 572-4400
37

Application Security Assessments by the Numbers - A Whole-istic View - OWASP AppSec EU 2015

  • 1.
    Dan Cornell @danielcornell Mobile Application AssessmentsBy the Numbers – A Whole-Istic View
  • 2.
    Agenda •  Background –  MobileApplication Threat Model –  Assessment Methodology –  Data Collected •  Findings –  Types of Vulnerabilities Identified –  Where Vulnerabilities Were Identified –  How Vulnerabilities Were Identified 2
  • 3.
    Introduction •  Data comesfrom: –  61 Assessments –  20 Applications •  What we found: –  957 Vulnerabilities •  Assessment with the most vulnerabilities: 3 assessments had 10 Critical vulnerabilities •  Assessments with the least vulnerabilities: only three assessments had one vulnerability (all others had more) 3
  • 4.
    Research Background •  Mobileapplication threat model •  Assessment methodology – Static versus dynamic testing – Automated versus manual testing •  Why CWE? •  Assessment data 4
  • 5.
    Mobile Application ThreatModel •  More complicated than a “typical” web application threat model •  Not just about code running on the device •  Main components: –  Mobile application –  Enterprise web services –  3rd party web services 5
  • 6.
    Assessment Methodology •  Testingactivities –  Combination of both static and dynamic activities –  Combination of automated tools, manual review of automated test results and manual testing •  Scope can include: –  Code running on the device itself –  Enterprise services –  3rd party supporting services 6
  • 7.
    Determining Severity Based oncustomized DREAD model •  Damage potential •  Reproducibility •  Exploitability •  Affected users •  Discoverability •  Each factor ranked 1-3 Collapsed to single dimension •  Critical: > 2.6 •  High: 2.3 – 2.6 •  Medium: 2.0 – 2.3 •  Low: < 2 7
  • 8.
    Why CWE? •  Vulnerabilitytaxonomy used was MITRE’s Common Weakness Enumeration (CWE) –  http://cwe.mitre.org/ •  Every tool has its own “spin” on naming vulnerabilities •  OWASP Top 10 / WASC 24 are helpful but not comprehensive •  CWE is exhaustive (though a bit sprawling at times) •  Reasonably well-adopted standard •  Many tools have mappings to CWE for their results 8
  • 9.
    Assessment Data •  Subsetof mobile assessments •  Mostly customer-facing applications from financial services organizations •  Primarily iOS and Android applications – Some WAP, Windows Phone 7 9
  • 10.
    Types of VulnerabilitiesFound •  Top 10 Most Prevalent CWEs – Overall •  Top 10 Most Prevalent CWEs – Critical/ High Risk 10
  • 11.
    Top 10 MostPrevalent CWEs – Overall 11 14 14 16 20 21 21 22 26 271 284 0 50 100 150 200 250 300 Use of a Broken or Risky Cryptographic Algorithm - LOW RISK Information Exposure Through an Error Message - LOW RISK Cross-Site Request Forgery (CSRF) - LOW RISK Information Leak Through Debug Information - LOW RISK External Control of System or Configuration Setting - LOW RISK Improper Input Validation - LOW RISK Improper Sanitization of Special Elements used in an SQL Command ('SQL Injection') - CRITICAL Cleartext Transmission of Sensitive Information - LOW RISK Information Exposure - LOW RISK Information Leak Through Log Files - LOW RISK
  • 12.
    Top 10 MostPrevalent CWEs – Critical/High Risk 12 1 1 2 3 3 3 4 6 6 22 0 50 100 150 200 250 300 Uncontrolled Resource Consumption ('Resource Exhaustion') - CRITICAL Failure to Preserve Web Page Structure ('Cross-Site Scripting') - CRITICAL Missing XML Validation - CRITICAL Uncontrolled Resource Consumption ('Resource Exhaustion') - CRITICAL Incorrect User Management - CRITICAL Exposure of Access Control List Files to an Unauthorized Control Sphere - CRITICAL Access Control (Authorization) Issues - CRITICAL Access Control Bypass Through User-Controlled Key - CRITICAL Information Leak Through Caching - HIGH Improper Sanitization of Special Elements used in an SQL Command ('SQL Injection') - CRITICAL
  • 13.
    OWASP Top 10Mobile Risks •  Similar to the OWASP Top 10 Web Application Risks, but targeted at mobile applications (obviously) •  Top risks to mobile applications: –  https://www.owasp.org/index.php/ OWASP_Mobile_Security_Project#tab=Top_Ten_Mob ile_Risks •  Work in progress to update this based on industry-contributed data 13
  • 14.
    OWASP Top 10Mobile Risks M1: Weak Server Side Controls M2: Insecure Data Storage M3: Insufficient Transport Layer Protection M4: Unintended Data Leakage M5: Poor Authorization and Authentication M6: Broken Cryptography M7: Client Side Injection M8: Security Decisions Via Untrusted Inputs M9: Improper Session Handling M10: Lack of Binary Protection 14
  • 15.
    Compare to OWASPTop 10 Mobile Risks 15 Strong Overlap •  Weak server-side controls •  Poor authentication and authorization •  Security decisions via untrusted inputs Overlap •  Insecure data storage •  Insufficient transport layer protection •  Improper session handling •  Unintended data leakage •  Broken cryptography Weak Overlap •  Client-side injection •  Lack of binary protection
  • 16.
    Where Did WeFind Overall Vulnerabilities? 16 Corporate Web Service 591 62% Device 342 36% Third-Party Web Service 24 2%
  • 17.
    Where Did WeFind Critical/High Risk Vulnerabilities? 17 Corporate Web Service 41 70% Device 15 25% ThirdParty Web Service 3 5%
  • 18.
    Analysis of “Where”Data •  Mobile security is about more than the code running on the device •  The things we really care about (Critical, High) are most frequently found on corporate web services –  Then on the device –  Then on 3rd party web services •  Reflects the “scale” benefits of finding web services vulnerabilities 18
  • 19.
    How Did WeFind Vulnerabilities? •  Static vs. dynamic testing •  Automated vs. manual testing •  What techniques identified the most vulnerabilities? •  What techniques identified the most serious vulnerabilities? 19
  • 20.
    Static vs. DynamicMethod of Finding Vulnerabilities 20 Critical, 10 Critical, 33 High Risk, 14 High Risk, 2 Medium Risk, 84 Medium Risk, 9 Low Risk, 206 Low Risk, 599 0 100 200 300 400 500 600 700 Dynamic Static
  • 21.
    Static vs. DynamicMethod of Finding Vulnerabilities 21 Critical 5% High Risk 0% Medium Risk 2% Low Risk 93% Static Critical 3% High Risk 4%Medium Risk 27% Low Risk 66% Dynamic
  • 22.
    Critical and HighRisk Vulnerabilities•  Static testing was more effective when finding serious (Critical and High) vulnerabilities •  But it also found a lot of lower-risk vulnerabilities (as well as results that had to be filtered out) 22 Found with Dynamic Testing 24 41% Found with Static Testing 35 59% Critical/High Risk Vulnerabilities Found
  • 23.
    Automated vs. ManualMethod of Finding Vulnerabilities 23 Critical, 33 Critical, 10 High Risk, 1 High Risk, 15 Medium Risk, 4 Medium Risk, 89 Low Risk, 526 Low Risk, 279 0 100 200 300 400 500 600 Automatic Manual
  • 24.
    Automated vs. ManualMethod of Finding Vulnerabilities 24 Critical 6% High Risk 0% Medium Risk 1% Low Risk 93% Automatic Critical 2% High Risk 4%Medium Risk 23% Low Risk 71% Manual
  • 25.
    Automated vs. ManualMethod of Finding Vulnerabilities (Critical and High) •  Automated testing was more effective when finding serious (Critical and High) vulnerabilities 25 Found with Automated Testing 34 58% Found with Manual Testing 25 42% Critical/High Risk Vulnerabilities Found
  • 26.
    Automated vs. Manual,Static vs. Dynamic Methods 26 Critical, 33 Critical, 10 Critical, 0 High Risk, 1 High Risk, 14 High Risk, 1 Medium Risk, 4 Medium Risk, 84 Medium Risk, 73 Low Risk, 526 Low Risk, 206 Low Risk, 5 0 100 200 300 400 500 600 Automatic / Static Manual / Dynamic Manual / Static Automatic / Static Manual / Dynamic Manual / Static Low Risk 526 206 5 Medium Risk 4 84 73 High Risk 1 14 1 Critical 33 10 0
  • 27.
    Automated vs. Manual,Static vs. Dynamic Methods 27 Automatic, 564 Automatic, 0 Manual, 79 Manual, 314 0 100 200 300 400 500 600 Static Dynamic Static Dynamic Manual 79 314 Automatic 564 0
  • 28.
    Automated vs. Manual,Static vs. Dynamic for Critical and High Vulnerabilities 28 Automatic, 34 Automatic, 0 Manual, 1 Manual, 24 0 5 10 15 20 25 30 35 40 Static Dynamic Static Dynamic Manual 1 24 Automatic 34 0
  • 29.
    Analysis of “How”Data •  A comprehensive mobile application security assessment program must incorporate a significant manual testing component •  Automated tools for testing mobile applications are not as mature as those for testing web applications •  Web services can be challenging to test in an automated manner 29
  • 30.
    On-Device Vulnerabilities By Platform PlatformsNumber of Assessments on Device Number of Total Vulnerabilities on Device Average Number of Vulnerabilities Found per Assessment iOS 39 252 6.5 Android 19 84 4.4 Windows Phone 7 1 3 3 WAP 1 3 3 30
  • 31.
    Other Observations •  Wealso include “other observations” as part of our assessments •  These reflect: –  Application weaknesses –  Coding flaws or behavior that are not “best practice” but do not reflect an immediate, exploitable vulnerability •  We had 1,948 “other observations” –  Roughly twice as many as actual vulnerabilities 31
  • 32.
    Other Observations –Where Were They Found? 32 Corporate Web Service 55 3% Device 1892 97% Third-Party Web Service 1 0%
  • 33.
    What Does ThisMean? •  Most of these “other observations” are about code on the device –  Mobile application developers need help building better code –  AND automated code scanning tools need to be better about filtering less valuable results •  Something that is not a problem today could be later on –  Identification of new platform vulnerabilities –  Changes coming along with a new application release 33
  • 34.
    Conclusions •  What ToTest? –  Mobile “apps” are not standalone applications –  They are systems of applications –  Serious vulnerabilities can exist in any system component •  How To Test? –  Mobile application testing does benefit from automation –  Manual review and testing is required to find the most serious issues –  A combination of static and dynamic testing is required for coverage 34
  • 35.
    Recommendations •  Plan yourmobile application assessment strategy with coverage in mind •  Evaluate the value of automation for your testing –  More “cost” than simply licensing – deployment time and results culling •  Look for opportunities to streamline –  Fast application release cycles can require frequent assessments –  Control scope: •  Assess application changes (versus entire applications) •  Manage cost of reporting 35
  • 36.
    Next Steps (ForUs) •  Incorporate more assessment data •  Collaboration with OWASP Top 10 Mobile Risks –  Currently being reworked based on data sets such as ours •  Better analysis of applications over time •  Updated release of Secure Mobile Application Development Reference –  Previous (outdated) release available online http://www.denimgroup.com/media/pdfs/ MobileDevReference.pdf 36
  • 37.