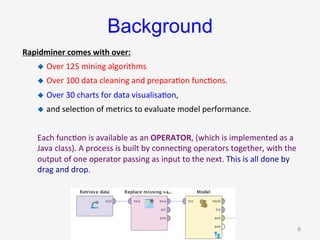
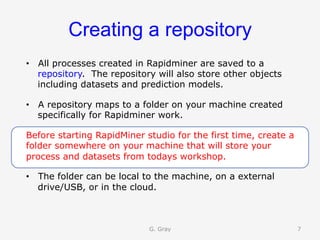
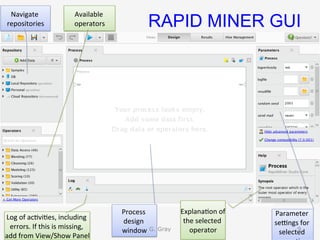
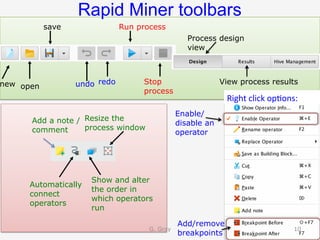
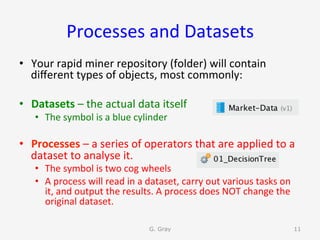
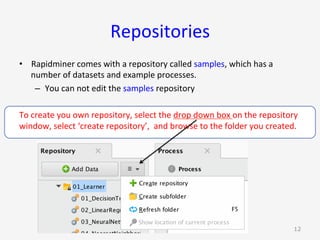
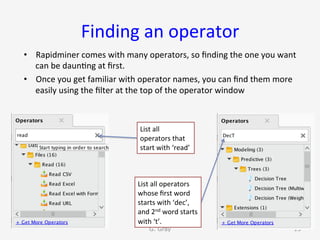
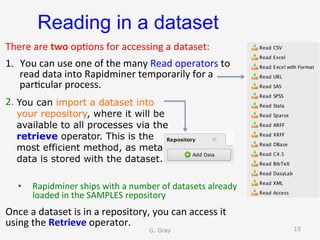
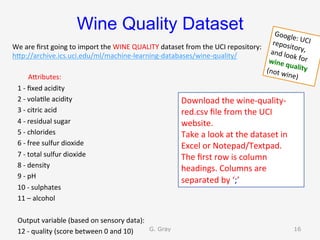
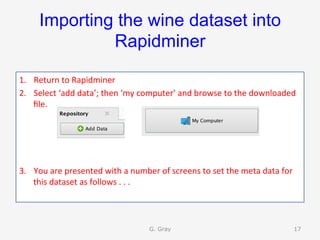
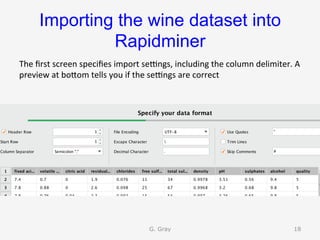
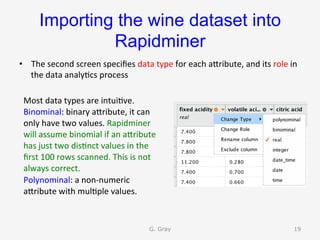
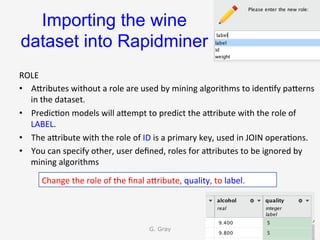
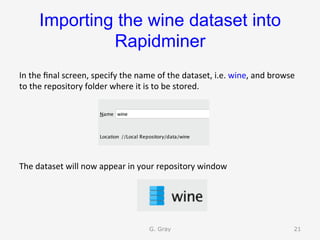
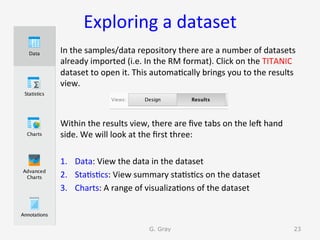
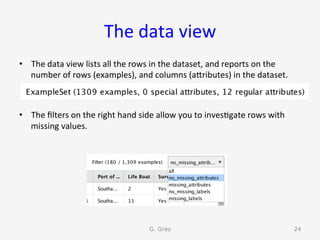
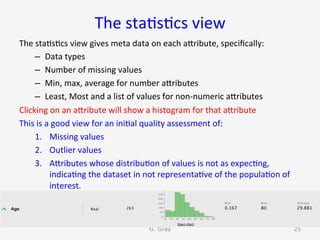
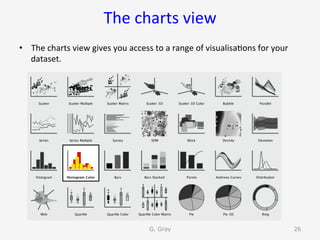
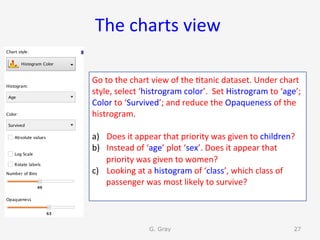
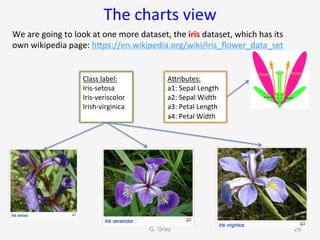
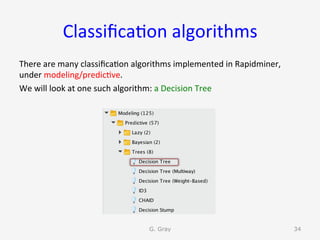
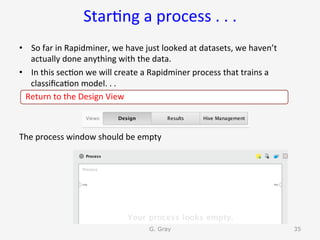
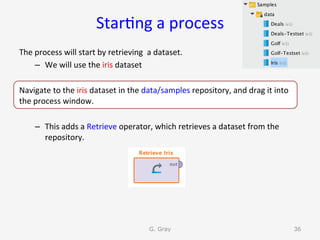
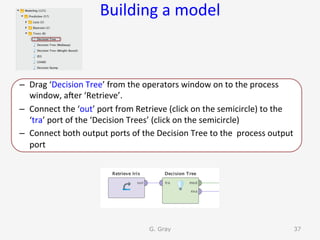
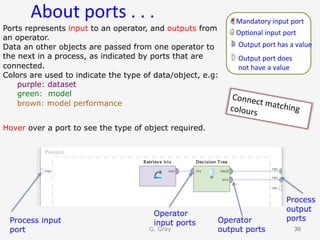
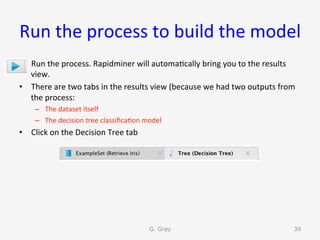
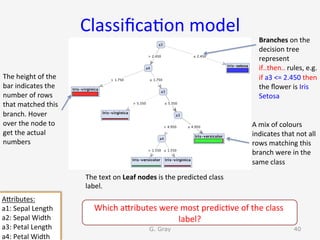
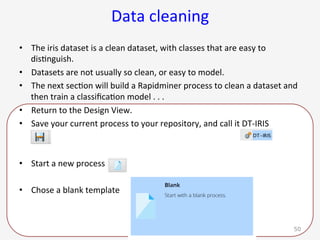
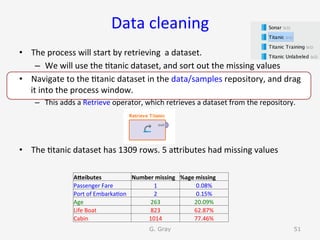
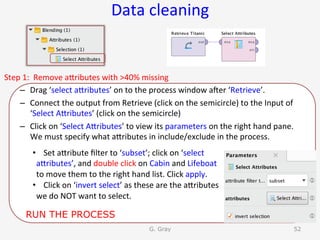
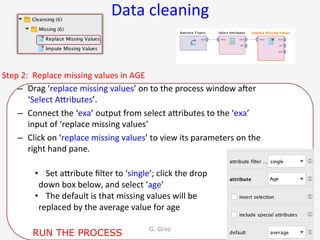
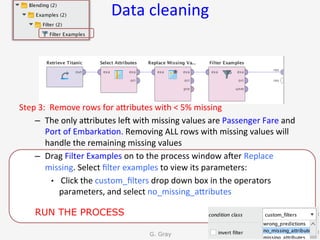
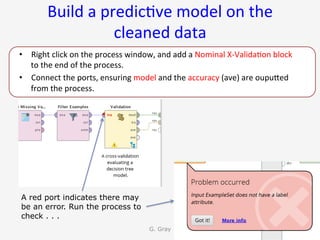
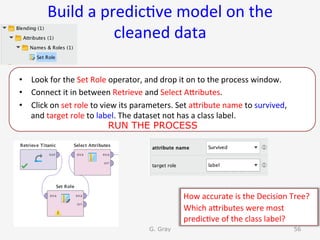
Dublin	R	
Lightning	Talks	Event
Introduction to Rapidminer
Geraldine Gray, PhD
March 24th 2016
Introduc9ons	
Geraldine	is	a	lecturer	in	Ins9tute	of	Technology	Blanchardstown	(ITB)	
Coordinator	for	ITB’s	MSc	in	Applied	Data	Science	and	Analy9cs	
geraldine.gray@itb.ie
https://ie.linkedin.com/in/geraldine-
gray-9b2b187
@GGrayITBgeraldine.gray.itb
Overview
Objec9ve:	
u  Introduc9on	to	RapidMiner	Studio	for	data	analy9cs	
Agenda:	
1.  Overview	of	RapidMiner	Studio	interface	
2.  Impor9ng	a	dataset	
3.  Descrip9ve	sta9s9cs	and	visualisa9on	
4.  Data	modelling	
5.  Model	evalua9on	
6.  Data	cleaning	
7.  Adding	R	script	
G. Gray 3
Topic	1:	Overview	of	Rapidminer	
Studio	
G. Gray 4
Installing	Rapidminer	on	your	own	machine	
The	latest	version	of	Rapidminer	Studio	is	V7,	it	can	be	downloaded	
from	hUps://rapidminer.com/products/comparison/	
	
•  For	windows:	download	the	rapidminer-install.exe	and	install.	
Defaults	install	it	to	C:program	files,	and	add	it	to	the	
start>programs	menu.	
•  For	mac:	download	the	.dmg	and	add	it	to	your	applica9ons	folder.		
G. Gray 5
Background
Rapidminer	comes	with	over:	
u  Over	125	mining	algorithms	
u  Over	100	data	cleaning	and	prepara9on	func9ons.		
u  Over	30	charts	for	data	visualisa9on,		
u  and	selec9on	of	metrics	to	evaluate	model	performance.	
Each	func9on	is	available	as	an	OPERATOR,	(which	is	implemented	as	a	
Java	class).	A	process	is	built	by	connec9ng	operators	together,	with	the	
output	of	one	operator	passing	as	input	to	the	next.	This	is	all	done	by	
drag	and	drop.	
G. Gray 6
Creating a repository
•  All processes created in Rapidminer are saved to a
repository. The repository will also store other objects
including datasets and prediction models.
•  A repository maps to a folder on your machine created
specifically for Rapidminer work.
Before starting RapidMiner studio for the first time, create a
folder somewhere on your machine that will store your
process and datasets from todays workshop.
•  The folder can be local to the machine, on a external
drive/USB, or in the cloud.
G. Gray 7
Start	up	Rapidminer	
When	you	start	Rapidminer	studio,	you	are	presented	with	an	ini9al	
introduc9on	window.	Close	this	window	to	see	the	main	interface.	
G. Gray 8
RAPID MINER GUI
Process	
design	
window	
Parameter	
seangs	for	
selected	
Log	of	ac9vi9es,	including	
errors.	If	this	is	missing,	
add	from	View/Show	Panel	
Available	
operators	
Explana9on	of	
the	selected	
operator	
Navigate	
repositories	
G. Gray 9
Rapid Miner toolbars
Run process
Stop
process
Automatically
connect
operators
undo redo
save
new open
Add/remove
breakpoints
Show and alter
the order in
which operators
run
Resize the
process window
Process design
view
View process results
Add a note /
comment
Enable/
disable an
operator
Right	click	op9ons:	
G. Gray 10
Processes	and	Datasets	
•  Your	rapid	miner	repository	(folder)	will	contain	
different	types	of	objects,	most	commonly:	
•  Datasets	–	the	actual	data	itself	
•  The	symbol	is	a	blue	cylinder	
•  Processes	–	a	series	of	operators	that	are	applied	to	a	
dataset	to	analyse	it.		
•  The	symbol	is	two	cog	wheels	
•  A	process	will	read	in	a	dataset,	carry	out	various	tasks	on	
it,	and	output	the	results.	A	process	does	NOT	change	the	
original	dataset.	
G. Gray 11
Repositories	
•  Rapidminer	comes	with	a	repository	called	samples,	which	has	a	
number	of	datasets	and	example	processes.	
–  You	can	not	edit	the	samples	repository	
To	create	you	own	repository,	select	the	drop	down	box	on	the	repository	
window,	select	‘create	repository’,		and	browse	to	the	folder	you	created.	
G. Gray 12
Finding	an	operator	
•  Rapidminer	comes	with	many	operators,	so	finding	the	one	you	want	
can	be	daun9ng	at	first.	
•  Once	you	get	familiar	with	operator	names,	you	can	find	them	more	
easily	using	the	filter	at	the	top	of	the	operator	window	
G. Gray 13
List	all	
operators	that	
start	with	‘read’	
List	all	operators	
whose	first	word	
starts	with	‘dec’,	
and	2nd	word	starts	
with	‘t’.
Topic	2:	Impor9ng	a	dataset	
	
G. Gray 14
Reading in a dataset
There	are	two	op9ons	for	accessing	a	dataset:	
1.  You	can	use	one	of	the	many	Read	operators	to	
read	data	into	Rapidminer	temporarily	for	a	
par9cular	process.		
2.  					
	
•  Rapidminer	ships	with	a	number	of	datasets	already	
loaded	in	the	SAMPLES	repository	
Once	a	dataset	is	in	a	repository,	you	can	access	it	
using	the	Retrieve	operator.			
You can import a dataset into
your repository, where it will be
available to all processes via the
retrieve operator. This is the
most efficient method, as meta
data is stored with the dataset.
G. Gray 15
Wine Quality Dataset
We	are	first	going	to	import	the	WINE	QUALITY	dataset	from	the	UCI	repository:	
hUp://archive.ics.uci.edu/ml/machine-learning-databases/wine-quality/	
AUributes:	
			1	-	fixed	acidity	
			2	-	vola9le	acidity	
			3	-	citric	acid	
			4	-	residual	sugar	
			5	-	chlorides	
			6	-	free	sulfur	dioxide	
			7	-	total	sulfur	dioxide	
			8	-	density	
			9	-	pH	
			10	-	sulphates	
			11	–	alcohol	
	
			Output	variable	(based	on	sensory	data):		
			12	-	quality	(score	between	0	and	10)	
Download	the	wine-quality-
red.csv	file	from	the	UCI	
website.	
Take	a	look	at	the	dataset	in	
Excel	or	Notepad/Textpad.	
The	first	row	is	column	
headings.	Columns	are	
separated	by	‘;’	
G. Gray 16
Google:	UCI	repository,	and	look	for	wine	quality	(not	wine)
Importing the wine dataset into
Rapidminer
1.  Return	to	Rapidminer	
2.  Select	‘add	data’;	then	‘my	computer’	and	browse	to	the	downloaded	
file.	
3.  You	are	presented	with	a	number	of	screens	to	set	the	meta	data	for	
this	dataset	as	follows	.	.	.		
G. Gray 17
Importing the wine dataset into
Rapidminer	
The	first	screen	specifies	import	seangs,	including	the	column	delimiter.	A	
preview	at	boUom	tells	you	if	the	seangs	are	correct	
G. Gray 18
Importing the wine dataset into
Rapidminer	
•  The	second	screen	specifies	data	type	for	each	aUribute,	and	its	role	in	
the	data	analy9cs	process	
G. Gray 19
Most	data	types	are	intui9ve.		
Binominal:	binary	aUribute,	it	can	
only	have	two	values.	Rapidminer	
will	assume	binomial	if	an	aUribute	
has	just	two	dis9nct	values	in	the	
first	100	rows	scanned.	This	is	not	
always	correct.	
Polynominal:	a	non-numeric	
aUribute	with	mul9ple	values.
Importing the wine
dataset into Rapidminer	
ROLE	
•  AUributes	without	a	role	are	used	by	mining	algorithms	to	iden9fy	paUerns	
in	the	dataset.	
•  Predic9on	models	will	aUempt	to	predict	the	aUribute	with	the	role	of	
LABEL.	
•  The	aUribute	with	the	role	of	ID	is	a	primary	key,	used	in	JOIN	opera9ons.	
•  You	can	specify	other,	user	defined,	roles	for	aUributes	to	be	ignored	by	
mining	algorithms	
G. Gray 20
Change	the	role	of	the	final	aUribute,	quality,	to	label.
Importing the wine dataset into
Rapidminer	
In	the	final	screen,	specify	the	name	of	the	dataset,	i.e.	wine,	and	browse	
to	the	repository	folder	where	it	is	to	be	stored.	


The	dataset	will	now	appear	in	your	repository	window	
G. Gray 21
Topic	3:	Descrip9ve	Sta9s9cs	
and	Visualisa9on	
G. Gray 22
Exploring	a	dataset	
In	the	samples/data	repository	there	are	a	number	of	datasets	
already	imported	(i.e.	In	the	RM	format).	Click	on	the	TITANIC	
dataset	to	open	it.	This	automa9cally	brings	you	to	the	results	
view.		
	
	
Within	the	results	view,	there	are	five	tabs	on	the	len	hand	
side.	We	will	look	at	the	first	three:	
	
1.  Data:	View	the	data	in	the	dataset	
2.  Sta9s9cs:	View	summary	sta9s9cs	on	the	dataset	
3.  Charts:	A	range	of	visualiza9ons	of	the	dataset	
G. Gray 23
The	data	view	
•  The	data	view	lists	all	the	rows	in	the	dataset,	and	reports	on	the	
number	of	rows	(examples),	and	columns	(aUributes)	in	the	dataset.	
•  The	filters	on	the	right	hand	side	allow	you	to	inves9gate	rows	with	
missing	values.	
G. Gray 24
The	sta9s9cs	view	
The	sta9s9cs	view	gives	meta	data	on	each	aUribute,	specifically:	
–  Data	types	
–  Number	of	missing	values	
–  Min,	max,	average	for	number	aUributes	
–  Least,	Most	and	a	list	of	values	for	non-numeric	aUributes	
Clicking	on	an	aUribute	will	show	a	histogram	for	that	aUribute	
This	is	a	good	view	for	an	ini9al	quality	assessment	of:	
1.  Missing	values	
2.  Outlier	values	
3.  AUributes	whose	distribu9on	of	values	is	not	as	expec9ng,	
indica9ng	the	dataset	in	not	representa9ve	of	the	popula9on	of	
interest.	
G. Gray 25
The	charts	view	
•  The	charts	view	gives	you	access	to	a	range	of	visualisa9ons	for	your	
dataset.		
G. Gray 26
The	charts	view	
G. Gray 27
Go	to	the	chart	view	of	the	9tanic	dataset.	Under	chart	
style,	select	‘histrogram	color’.		Set	Histrogram	to	‘age’;	
Color	to	‘Survived’;	and	reduce	the	Opaqueness	of	the	
histrogram.		
	
a)  Does	it	appear	that	priority	was	given	to	children?	
b)  Instead	of	‘age’	plot	‘sex’.	Does	it	appear	that	
priority	was	given	to	women?		
c)  Looking	at	a	histogram	of	‘class’,	which	class	of	
passenger	was	most	likely	to	survive?
The	charts	view	
We	are	going	to	look	at	one	more	dataset,	the	iris	dataset,	which	has	its	
own	wikipedia	page:	hUps://en.wikipedia.org/wiki/Iris_flower_data_set	
G. Gray 28
AUributes:	
a1:	Sepal	Length	
a2:	Sepal	Width	
a3:	Petal	Length	
a4:	Petal	Width	
Class	label:	
Iris-setosa	
Iris-veriscolor	
Irish-virginica
The	charts	view	
•  Navigate	to	the	IRIS	data	set	in	the	samples/data	repository.	Double	
click	to	open	it	in	the	results	view.	
•  In	the	charts	view,	select	‘ScaUer	Matrix’.	This	shows	a	scaUer	plot	of	
all	pairs	of	aUributes,	colour	coded	by	class	label.	
a)  Are	the	three	classes	well	separated?	
b)  Select	a	ScaUer	3-D	Color	plot.	By	default	it	color	codes	by	class	label.	
Use	your	mouse	to	rotate	the	plot	and	so	view	it	from	different	
perspec9ves.	
G. Gray 29
Close	all	tabs	in	the	results	view	
G. Gray 30
Topic	4	
Building	a	predic9ve	model	
G. Gray 31
Classifica9on	
A	classifica9on	algorithm	trains	a	model	to	predict	a	class	label	–	one	of	the	
aUributes	in	the	dataset	
This	class	label	defines	groups	in	the	dataset	
The	algorithm	learns	what	differen9ates	these	groups	from	each	other	
G. Gray 32
Class	Label	 A1	 A2	 A3	 A4	
Iris-setosa	 5.1	 3.5	 1.4	 0.2	
Iris-setosa	 5	 3.6	 1.4	 0.2	
Iris-setosa	 5.7	 3.8	 1.7	 0.3	
Iris-setosa	 4.6	 3.6	 1	 0.2	
Iris-setosa	 5	 3.3	 1.4	 0.2	
Iris-versicolor	 6	 2.2	 4	 1	
Iris-versicolor	 6.7	 3.1	 4.4	 1.4	
Iris-versicolor	 6.8	 2.8	 4.8	 1.4	
Iris-versicolor	 5.7	 3	 4.2	 1.2	
Iris-versicolor	 5.7	 2.9	 4.2	 1.3	
Iris-virginica	 7.1	 3	 5.9	 2.1	
Iris-virginica	 7.2	 3.6	 6.1	 2.5	
Iris-virginica	 6.5	 3.2	 5.1	 2	
Iris-virginica	 6.7	 3.3	 5.7	 2.1	
Iris-virginica	 6	 3	 4.8	 1.8
Classifica9on	algorithms	
Classifica9on	algorithms	use	labeled	data	to	learn	how	to	iden9fy	instances	
of	each	class	
Will	it	be	easy	to	train	a	model	to	differen9ate	between	the	three	types	of	
iris	below?	
G. Gray 33
Iris virginica
Iris veriscolor
Iris setosa
Classifica9on	algorithms	
There	are	many	classifica9on	algorithms	implemented	in	Rapidminer,	
under	modeling/predic9ve.		
We	will	look	at	one	such	algorithm:	a	Decision	Tree	
G. Gray 34
Star9ng	a	process	.	.	.	
•  So	far	in	Rapidminer,	we	have	just	looked	at	datasets,	we	haven’t	
actually	done	anything	with	the	data.	
•  In	this	sec9on	we	will	create	a	Rapidminer	process	that	trains	a	
classifica9on	model.	.	.	
			Return	to	the	Design	View		
The	process	window	should	be	empty	
G. Gray 35
Star9ng	a	process	
The	process	will	start	by	retrieving		a	dataset.	
–  We	will	use	the	iris	dataset	
Navigate	to	the	iris	dataset	in	the	data/samples	repository,	and	drag	it	into	
the	process	window.	
–  This	adds	a	Retrieve	operator,	which	retrieves	a	dataset	from	the	
repository.	
G. Gray 36
Building	a	model	
–  Drag	‘Decision	Tree’	from	the	operators	window	on	to	the	process	
window,	aner	‘Retrieve’.	
–  Connect	the	‘out’	port	from	Retrieve	(click	on	the	semicircle)	to	the	
‘tra’	port	of	the	‘Decision	Trees’	(click	on	the	semicircle)	
–  Connect	both	output	ports	of	the	Decision	Tree	to	the		process	output	
port 		
G. Gray 37
About	ports	.	.	.	
G. Gray 3838
Process input
port
Process
output
ports
Operator
input ports Operator
output ports
Mandatory	input	port	
Op9onal	input	port	
Output	port	has	a	value	
Output	port	does		
not	have	a	value	
Ports represents input to an operator, and outputs from
an operator.
Data an other objects are passed from one operator to
the next in a process, as indicated by ports that are
connected.
Colors are used to indicate the type of data/object, e.g:
purple: dataset
green: model
brown: model performance
Hover over a port to see the type of object required.
Connect	matching	colours
Run	the	process	to	build	the	model	
•  Run	the	process.	Rapidminer	will	automa9cally	bring	you	to	the	results	
view.	
•  There	are	two	tabs	in	the	results	view	(because	we	had	two	outputs	from	
the	process:	
–  The	dataset	itself	
–  The	decision	tree	classifica9on	model	
•  Click	on	the	Decision	Tree	tab	
G. Gray 39
Classifica9on	model	
The	text	on	Leaf	nodes	is	the	predicted	class	
label.	
G. Gray 40
AUributes:	
a1:	Sepal	Length	
a2:	Sepal	Width	
a3:	Petal	Length	
a4:	Petal	Width	
The	height	of	the	
bar	indicates	the	
number	of	rows	
that	matched	this	
branch.	Hover	
over	the	node	to	
get	the	actual	
numbers	
A	mix	of	colours	
indicates	that	not	all	
rows	matching	this	
branch	were	in	the	
same	class	
Branches	on	the	
decision	tree	
represent	
if..then..	rules,	e.g.	
if	a3	<=	2.450	then	
the	flower	is	Iris	
Setosa	
	
Which	aUributes	were	most	predic9ve	of	the	class	
label?
Topic	5	
Model	accuracy	
	(and	building	blocks)	
G. Gray 41
Model	accuracy	
A	decision	tree	produces	a	nice	visualisa9on	of	the	rules	that	predict	class	
membership.	Its	can	be	used	as	a	way	to	explore	historic	data	(Descrip9ve	
modeling).	
	
However,	the	decision	tree	itself	does	not	tell	us	how	accurate	the	model	will	
be	when	applied	to	new	data	(i.e.	data	that	was	not	available	to	it	during	
training.).		
	i.e.	can	we	reply	on	the	accuracy	of	its	predic9ons?	(Predic9ve	modeling)	
	
To	determine	model	accuracy	when	making	predic9ons	on	new	data,	we	do	
the	following:	
G. Gray 42
Model	accuracy	
G. Gray 43
1.	Split	the	dataset	into	a	training	
dataset	and	a	test	dataset	
2.	Training	a	model	on	the	training	
dataset	
3.	Apply	the	model	to	the	test	
dataset		
4.	Calculate	how	many	rows	were	
predicted	correctly.
Model	accuracy	
G.Gray 44
Label	 A1	 A2	 A3	 A4	
Iris-versicolor	 6	 2.2	 4	 1	
Iris-setosa	 4.6	 3.6	 1	 0.2	
Iris-versicolor	 5.7	 2.9	 4.2	 1.3	
Iris-versicolor	 5.7	 3	 4.2	 1.2	
Iris-virginica	 7.1	 3	 5.9	 2.1	
Iris-virginica	 6	 3	 4.8	 1.8	
Iris-versicolor	 6.7	 3.1	 4.4	 1.4	
Iris-virginica	 6.5	 3.2	 5.1	 2	
Iris-setosa	 5	 3.3	 1.4	 0.2	
Iris-virginica	 6.7	 3.3	 5.7	 2.1	
Iris-setosa	 5.1	 3.5	 1.4	 0.2	
Training data
Label	 A1	 A2	 A3	 A4	
Predicted	
value	
Iris-setosa	 5	 3.6	 1.4	 0.2	 ?	
Iris-versicolor	 6.8	 2.8	 4.8	 1.4	 ?	
Iris-virginica	 7.2	 3.6	 6.1	 2.5	 ?	
Iris-setosa	 5.7	 3.8	 1.7	 0.3	 ?	
Test data
Classifica9on	
algorithm	
Train		
model	
Classifica9on	
model	
Apply	model	
True	Label	 Predicted	label	
Iris-setosa	 Iris-setosa	
Iris-versicolor	 Iris-virginica	
Iris-virginica	 Iris-versicolor	
Iris-setosa	 Iris-setosa	
Accuracy: 50%
Labeled data
Model	accuracy	in	RM	
•  Return	to	the	Design	View	
•  Right	click	on	the	Decision	Tree	operator	and	delete	it	
•  Right	click	anywhere	in	the	process	window,	select	Insert		
						Building	Block,	and	then	Nominal	X-Valida9on.	
•  A	Valida9on	operator	is	added	to	the	process	window.	Move	it	to	the	right	
of	the	retrieve	operator	and	connect	the	ports.	
G. Gray 45
Building	blocks	are	groups	of	operators	frequently	used	together.	
You	can	define	your	own,	or	use	the	5	predefined	building	blocks		
The	icon	on	the	boUom	right	corner	of	
the	operator	indicates	there	are	other	
operators	embedded	within	this	
operator.	
Click	on	the	operator	to	view	its	sub-
processes
Model	accuracy	
1.	The	valida9on	operator	splits	the	dataset	into	par99ons:	some	are	used	for	
training	while	others	are	used	for	tes9ng	
G. Gray 46
2. Train a Decision Tree on the
training portion of the dataset
3. Apply the decision tree
model to the test portion of
the dataset
4. Calculate how many
predictions were correct
Model	accuracy	
•  Return	up	to	the	root	level.	
•  Output	the	model	(mod)	and	the	performance	(ave)	port.	
•  	Run	the	process	
G. Gray 47
Model	accuracy	–	confusion	matrix	
The	performance	operator	gives	the	overall	model	accuracy,	and	accuracy	
within	each	class	depicted	as	a	confusion	matrix:	
G. Gray 48
pred.: refers to the
class label
predicted by the
decision tree
true: Refers to the
actual class label
in the original
dataset
4 rows in the
dataset were
predicted as being
Iris-virginica, but
were actually iris-
veriscolor
5 rows in the
dataset were
predicted as being
Iris-veriscolor, but
were actually iris-
virginica
The diagonal represents correct predictions
Topic	6:	Data	cleaning	
Crea9ng	a	Rapidminer	process	to	
1.  	Remove	aUributes	
2.  Remove	Rows	
3.  Fill	missing	values	
G. Gray 49
Data	cleaning	
•  The	iris	dataset	is	a	clean	dataset,	with	classes	that	are	easy	to	
dis9nguish.	
•  Datasets	are	not	usually	so	clean,	or	easy	to	model.		
•  The	next	sec9on	will	build	a	Rapidminer	process	to	clean	a	dataset	and	
then	train	a	classifica9on	model	.	.	.	
•  Return	to	the	Design	View.		
•  Save	your	current	process	to	your	repository,	and	call	it	DT-IRIS	
•  Start	a	new	process	
•  Chose	a	blank	template		
G. Gray 50
Data	cleaning	
•  The	process	will	start	by	retrieving		a	dataset.	
–  We	will	use	the	9tanic	dataset,	and	sort	out	the	missing	values	
•  Navigate	to	the	9tanic	dataset	in	the	data/samples	repository,	and	drag	
it	into	the	process	window.	
–  This	adds	a	Retrieve	operator,	which	retrieves	a	dataset	from	the	repository.	
•  The	9tanic	dataset	has	1309	rows.	5	aUributes	had	missing	values	
G. Gray 51
AEeibutes	 Number	missing	 %age	missing	
Passenger	Fare	 1	 0.08%	
Port	of	Embarka9on	 2	 0.15%	
Age	 263	 20.09%	
Life	Boat	 823	 62.87%	
Cabin	 1014	 77.46%
Data	cleaning	
Step	1:		Remove	aUributes	with	>40%	missing	
–  Drag	‘select	aUributes’	on	to	the	process	window	aner	‘Retrieve’.	
–  Connect	the	output	from	Retrieve	(click	on	the	semicircle)	to	the	Input	of	
‘Select	AUributes’	(click	on	the	semicircle)	
–  Click	on	‘Select	AUributes’	to	view	its	parameters	on	the	right	hand	pane.	
We	must	specify	what	aUributes	in	include/exclude	in	the	process.	
G. Gray 52
•  Set	aUribute	filter	to	‘subset’;	click	on	‘select	
aUributes’,	and	double	click	on	Cabin	and	Lifeboat	
to	move	them	to	the	right	hand	list.	Click	apply.	
•  Click	on	‘invert	select’	as	these	are	the	aUributes	
we	do	NOT	want	to	select.	
RUN THE PROCESS
Data	cleaning	
Step	2:		Replace	missing	values	in	AGE	
–  Drag	‘replace	missing	values’	on	to	the	process	window	aner	
‘Select	AUributes’.	
–  Connect	the	‘exa’	output	from	select	aUributes	to	the	‘exa’		
input	of	‘replace	missing	values’	
–  Click	on	‘replace	missing	values’	to	view	its	parameters	on	the	
right	hand	pane.		
G. Gray 53
•  Set	aUribute	filter	to	‘single’;	click	the	drop	
down	box	below,	and	select	‘age’	
•  The	default	is	that	missing	values	will	be	
replaced	by	the	average	value	for	age	
RUN THE PROCESS
Data	cleaning	
Step	3:		Remove	rows	for	aUributes	with	<	5%	missing	
–  The	only	aUributes	len	with	missing	values	are	Passenger	Fare	and	
Port	of	Embarka9on.	Removing	ALL	rows	with	missing	values	will	
handle	the	remaining	missing	values	
–  Drag	Filter	Examples	on	to	the	process	window	aner	Replace	
missing.	Select	filter	examples	to	view	its	parameters:	
•  	Click	the	custom_filters	drop	down	box	in	the	operators	
parameters,	and	select	no_missing_aUributes	
G. Gray 54
RUN THE PROCESS
Build	a	predic9ve	model	on	the	
cleaned	data	
•  Right	click	on	the	process	window,	and	add	a	Nominal	X-Valida9on	block	
to	the	end	of	the	process.		
•  Connect	the	ports,	ensuring	model	and	the	accuracy	(ave)	are	oupuUed	
from	the	process.	
G. Gray 55
A red port indicates there may
be an error. Run the process to
check . . .
Build	a	predic9ve	model	on	the	
cleaned	data	
•  Look	for	the	Set	Role	operator,	and	drop	it	on	to	the	process	window.		
•  Connect	it	in	between	Retrieve	and	Select	AUributes.		
•  Click	on	set	role	to	view	its	parameters.	Set	aUribute	name	to	survived,	
and	target	role	to	label.	The	dataset	not	has	a	class	label.	
G. Gray 56
How	accurate	is	the	Decision	Tree?	
Which	aUributes	were	most	
predic9ve	of	the	class	label?	
RUN THE PROCESS
Topic	7:	Adding	R	code	
G. Gray 57
Running	R	script	within	Rapidminer	
•  There	are	a	number	of	extensions	to	RapidMiner	studio	available	free	
from	their	marketplace,	including	an	extension	to	run	R	script	within	
Rapidminer.	Installed	packages	are	listed	under	the	extensions	folder.	
	
•  The	operator	to	run	R	scripts	‘Execute	R’.	The	operators	parameter	
provides	the	editor	for	R	script;	Inputs	are	the	parameters	to	a	mandatory	
main	func9on;	A	return	statement	defines	the	outputs	from	the	operator.		
G. Gray 58
Running	R	script	within	Rapidminer	
The	operators	help	gives	a	link	to	the	example	process.	The	Polynomial	
dataset	is	split	into	two	par99ons.	Learn	Model	contains	R	script	to	
train	a	linear	model;	Apply	R	Model	contains	R	script	to	apply	the	
model	and	record	its	performance.	The	script	for	both	is	on	the	next	
slide	.	.	.	
G. Gray 59
Running	R	script	within	Rapidminer	
•  Learn	Model	
#	train	a	linear	model	on	the	training	data	
and	return	the	learned	model	
	
rm_main	=	func9on(data)	
{	
	linearModel	<-	lm(formula	=label	~	.	,		
data	=data)	
				 	return(linearModel)	
}	
•  Apply	R	model	
##	load	the	trained	model	and	apply	it	on	the	test	
data	
	
rm_main	=	func9on(model,	data)	
{	
				
			#	apply	the	model	and	build	a	predic9on	
			result	<-predict(model,	data)	
	
			#	add	the	predic9on	to	the	example	set	
			data$predic9on	<-	result	
				
			#	update	the	meta	data	
			metaData$data$predic9on	<<-	list(type="real",	
role="predic9on")	
				
			return(data)	
}	G. Gray 60
Learning	more	.	.	.		
We	have	just	touched	on	a	few	of	the	operators	in	Rapidminer.	
•  The	samples/processes	repository	in	Rapidminer	has	many	more	
examples.	
•  The	rapidminer	website	has	training	material.	
•  The	Rapidminer	Resources	website	also	has	training	material,	some	of	
which	is	free.	
•  Neural	market	trends	(Thomas	OU)	also	has	good	videos	on	Rapidminer.	
G. Gray 61
Books:		
1.  Rapidminer	Data	Mining	Use	Cases	and	
Business	Analy9cs	Applica9ons.	Editors:	
Dr.	Markus	Hofmann	&	Ralf	Klinkenberg	
2.  Exploring	data	with	Rapidminer	by	
Andrew	Chisholm	(free	to	download)

Introduction to RapidMiner Studio V7