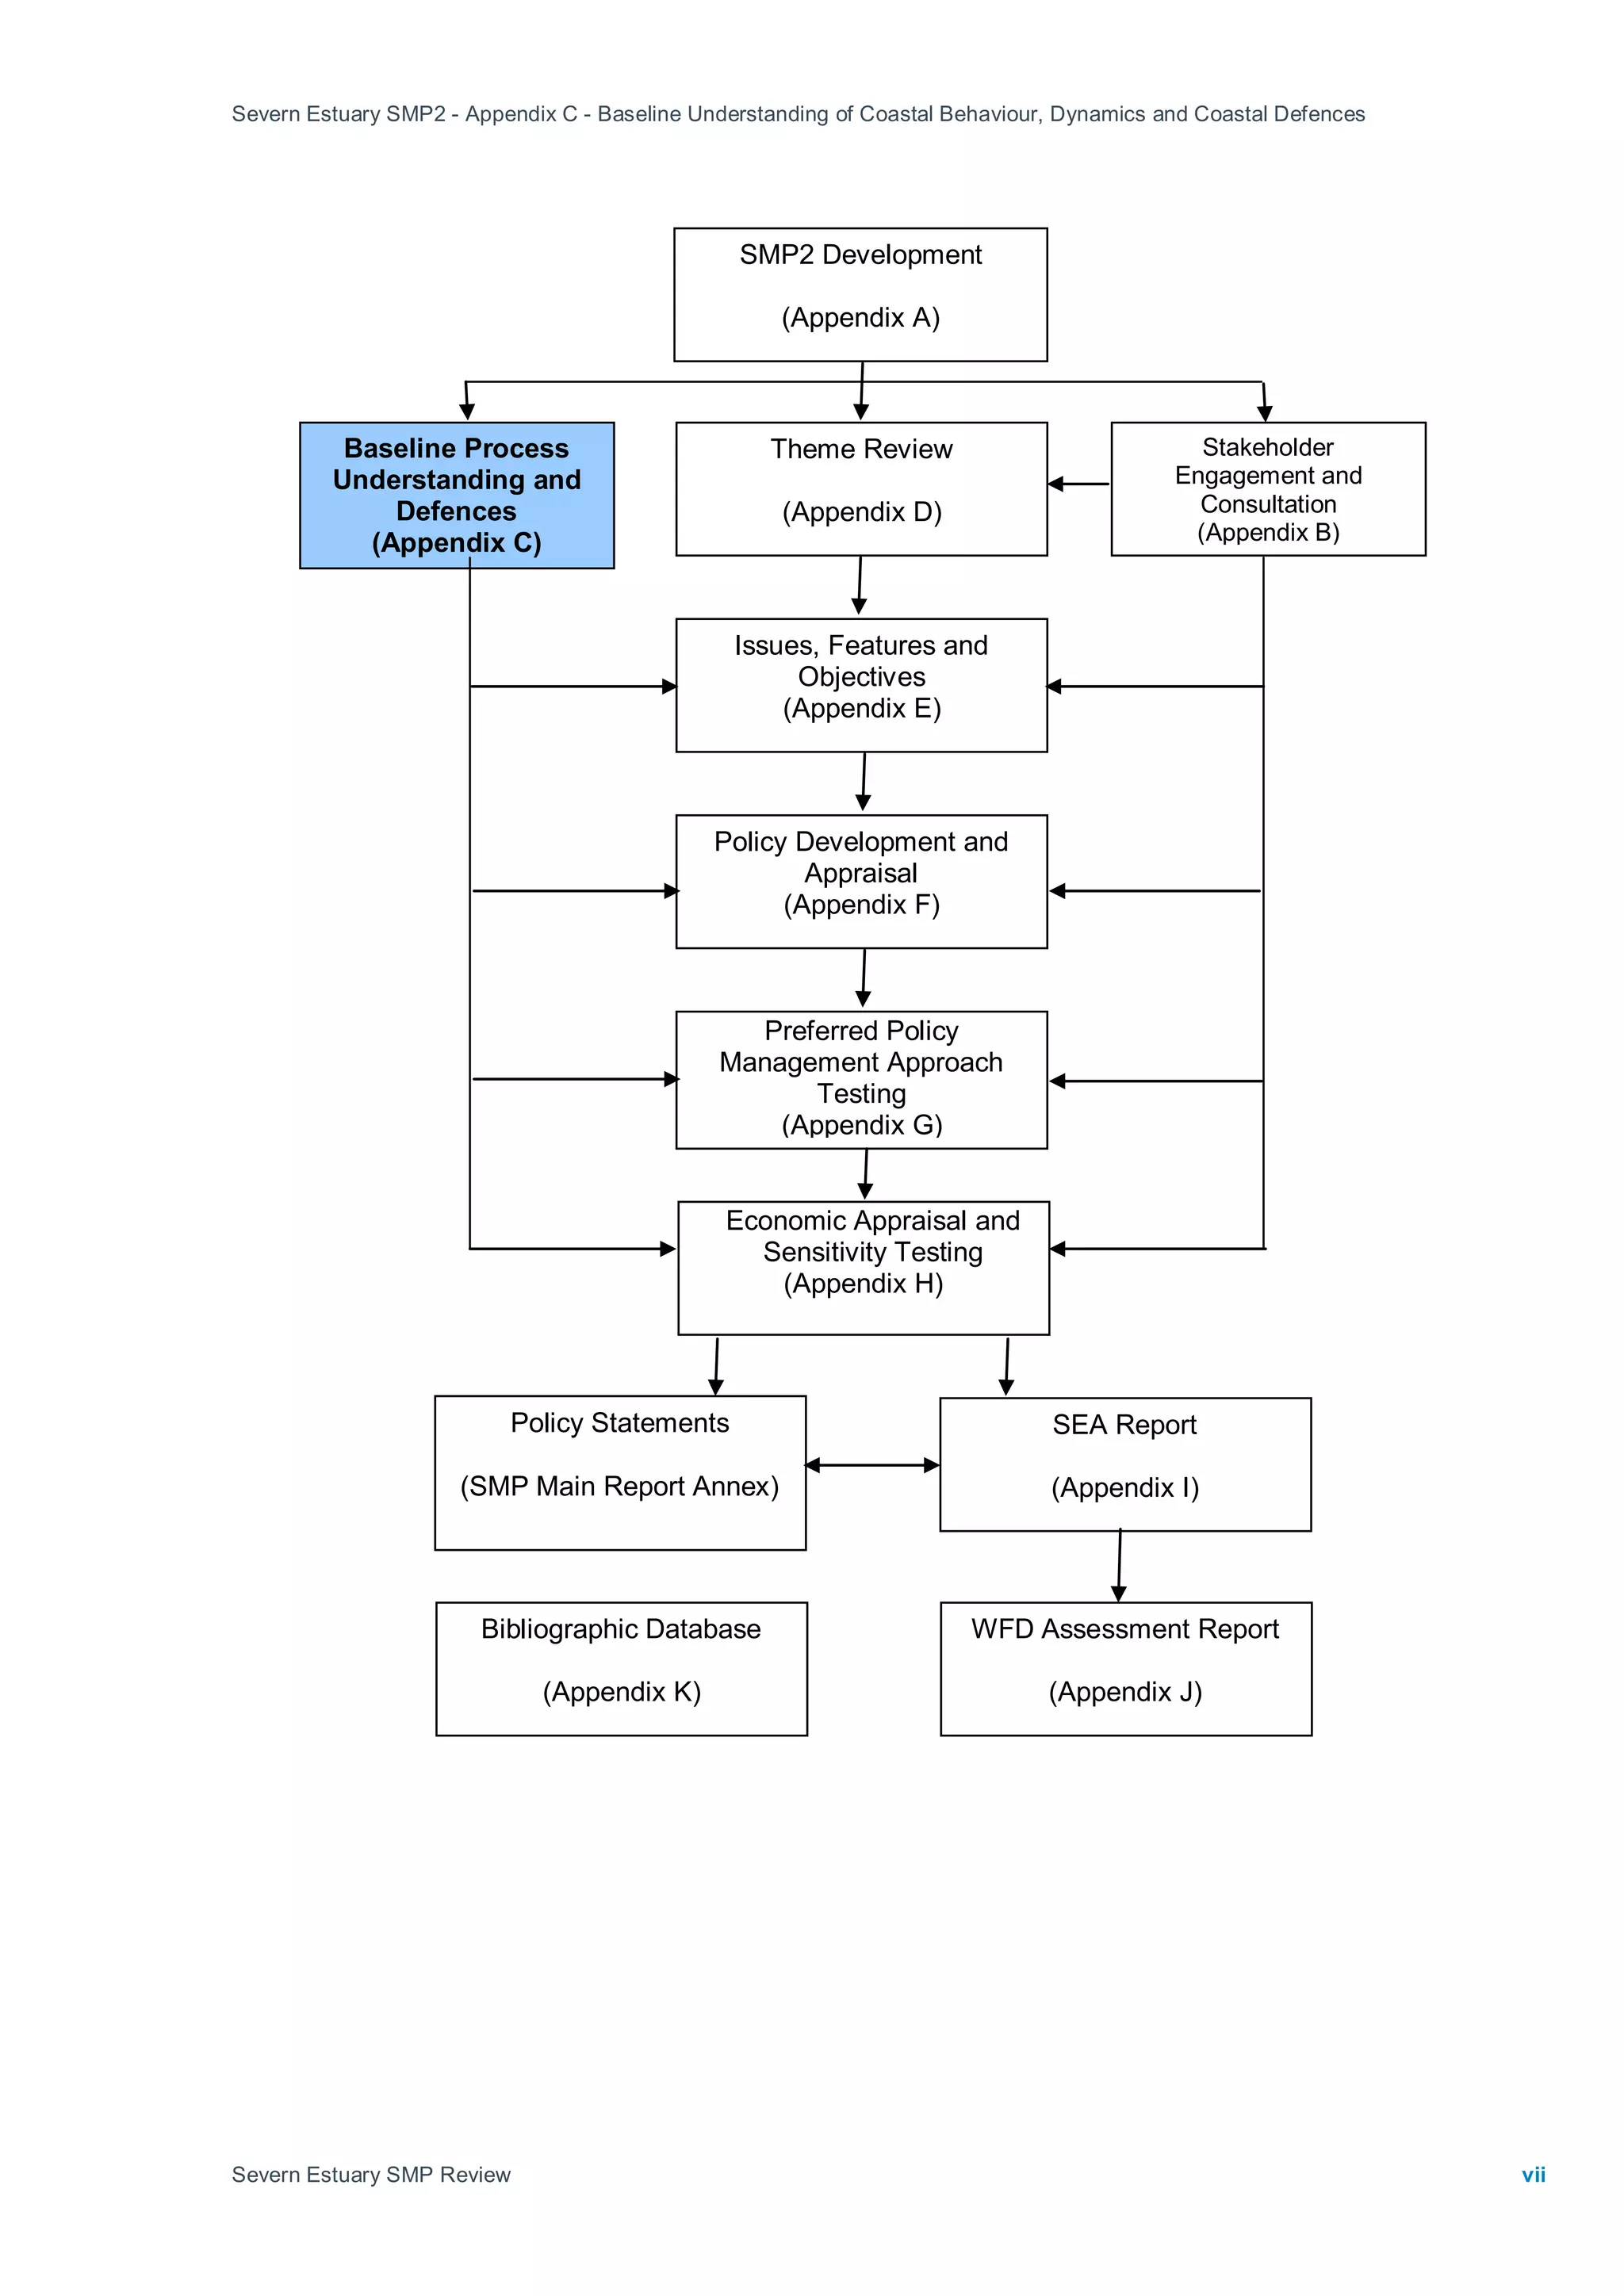
This document contains three parts that provide baseline information for the Severn Estuary Shoreline Management Plan Review (SMP2):
Part A assesses coastal processes and evolution in the estuary based on geology, geomorphology, hydrodynamics, and sediment transport.
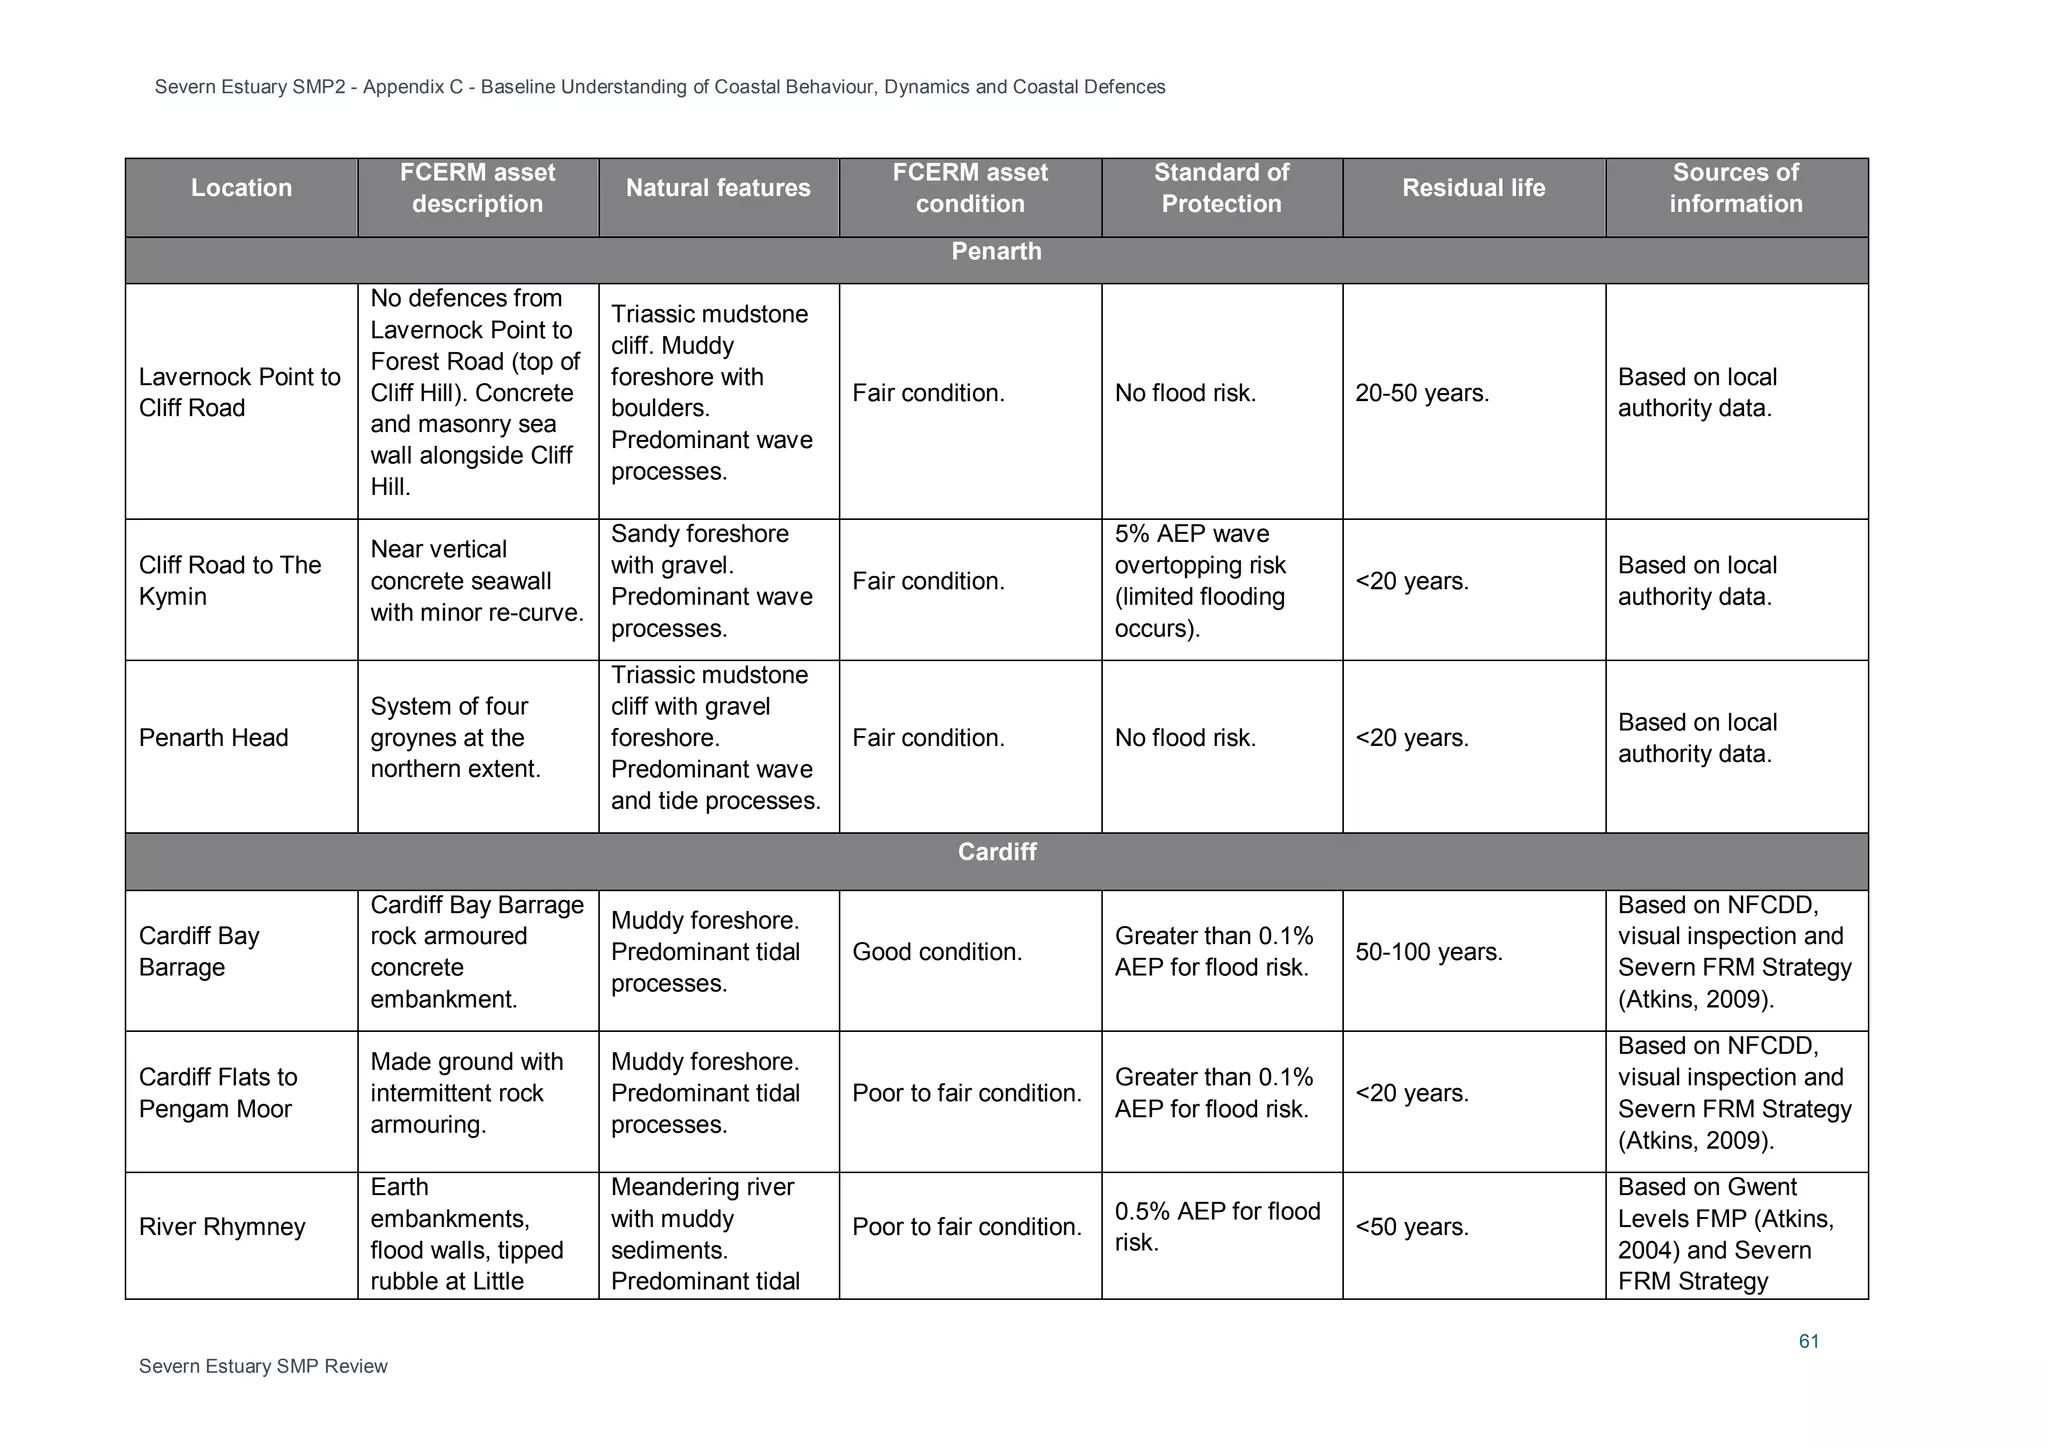
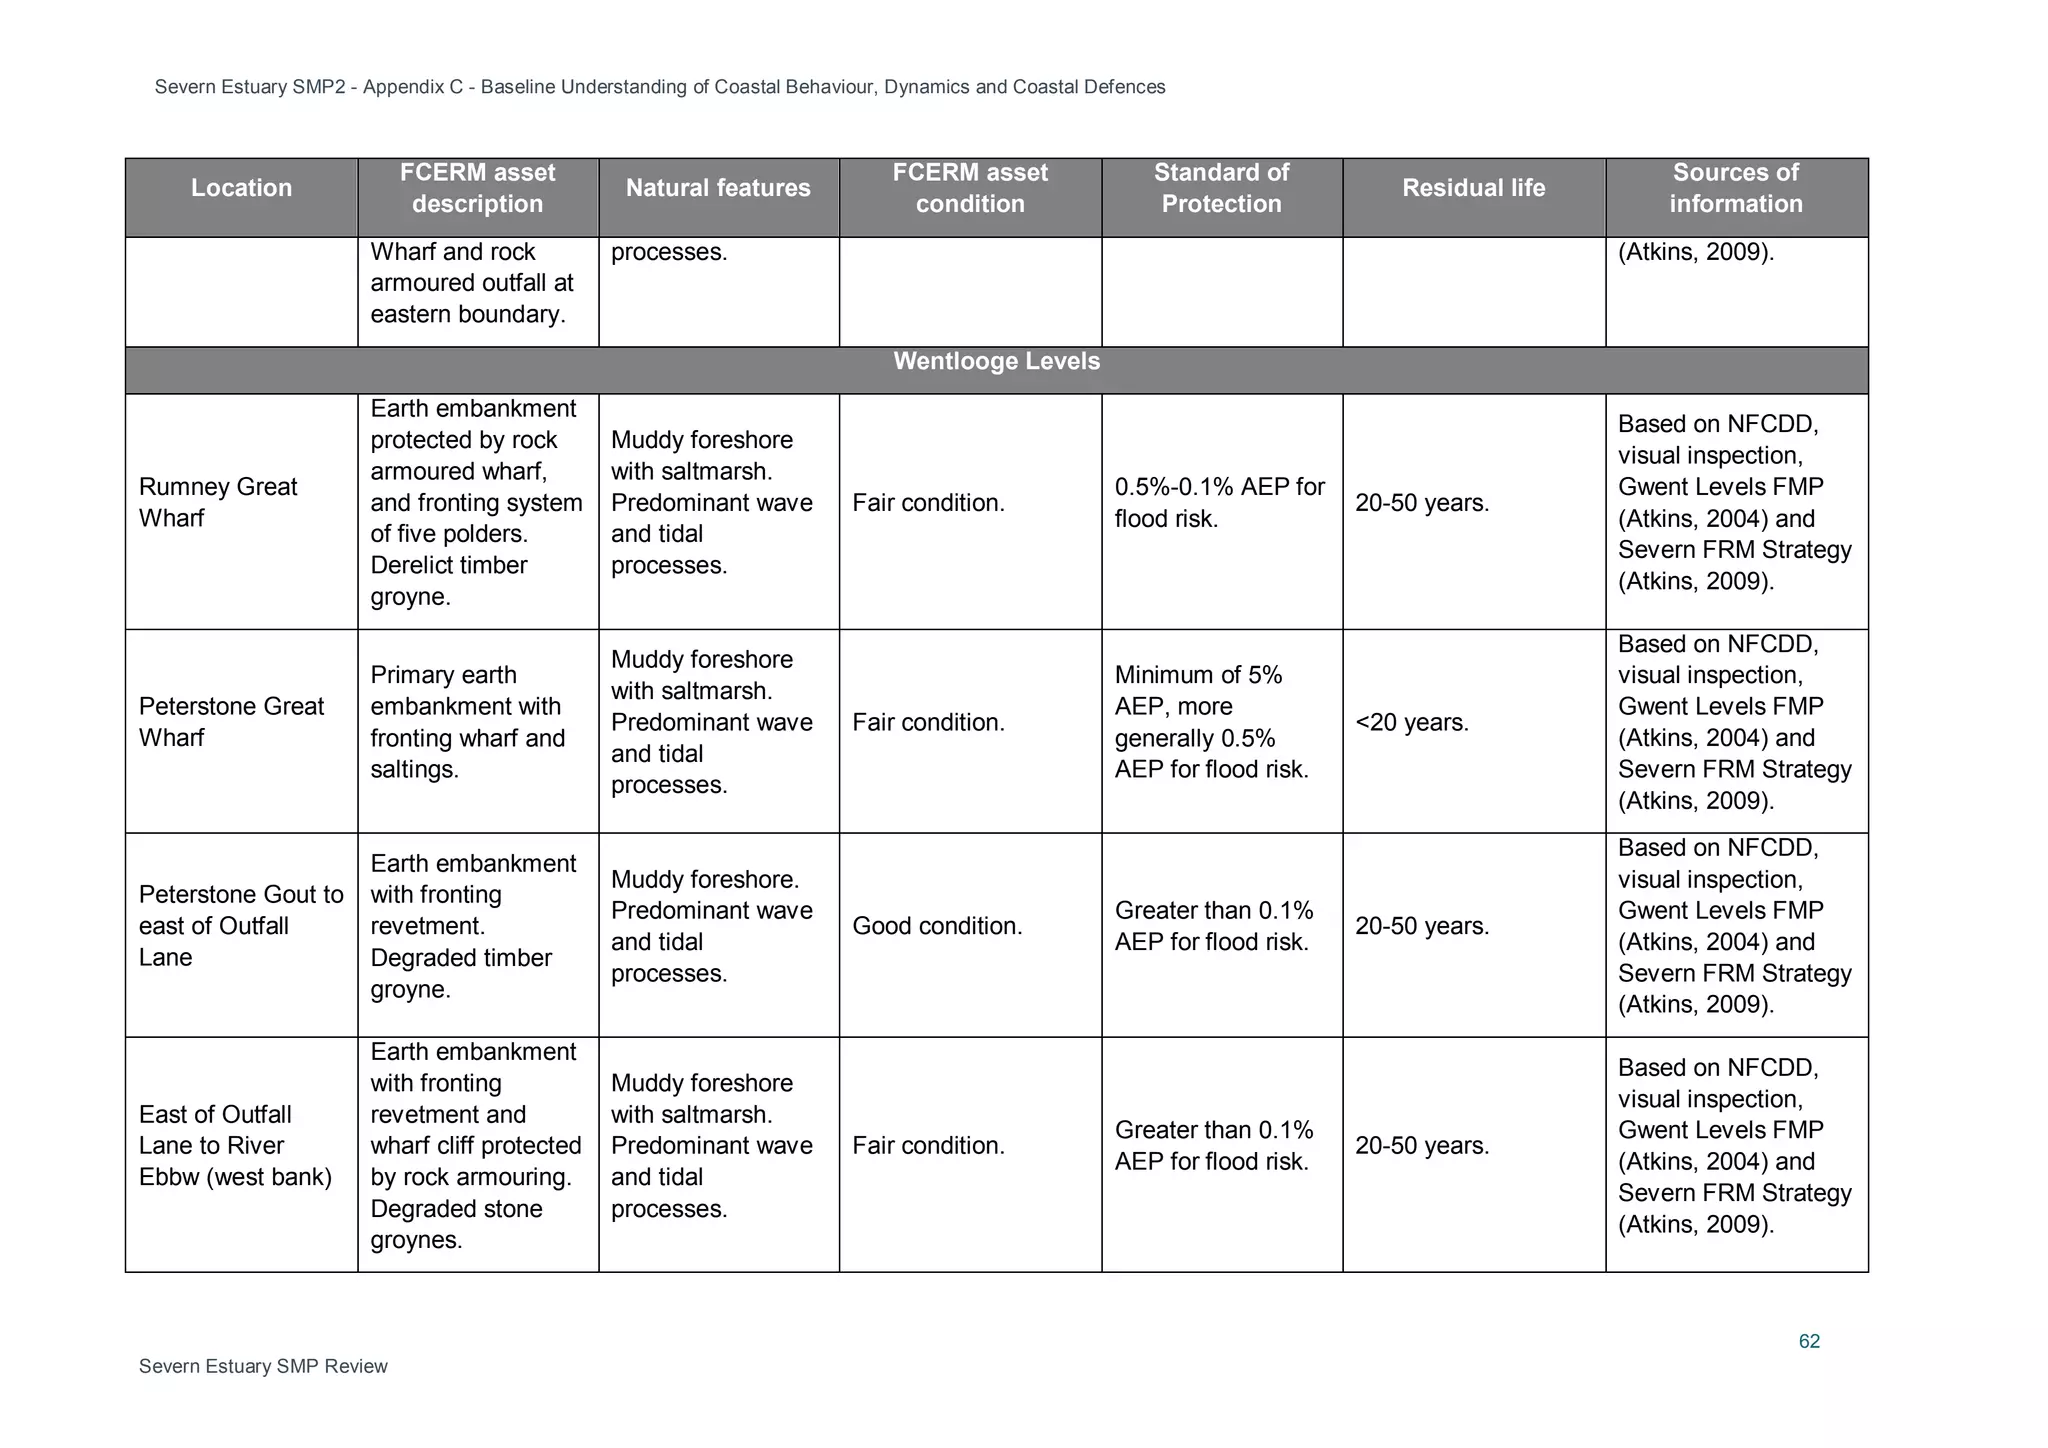
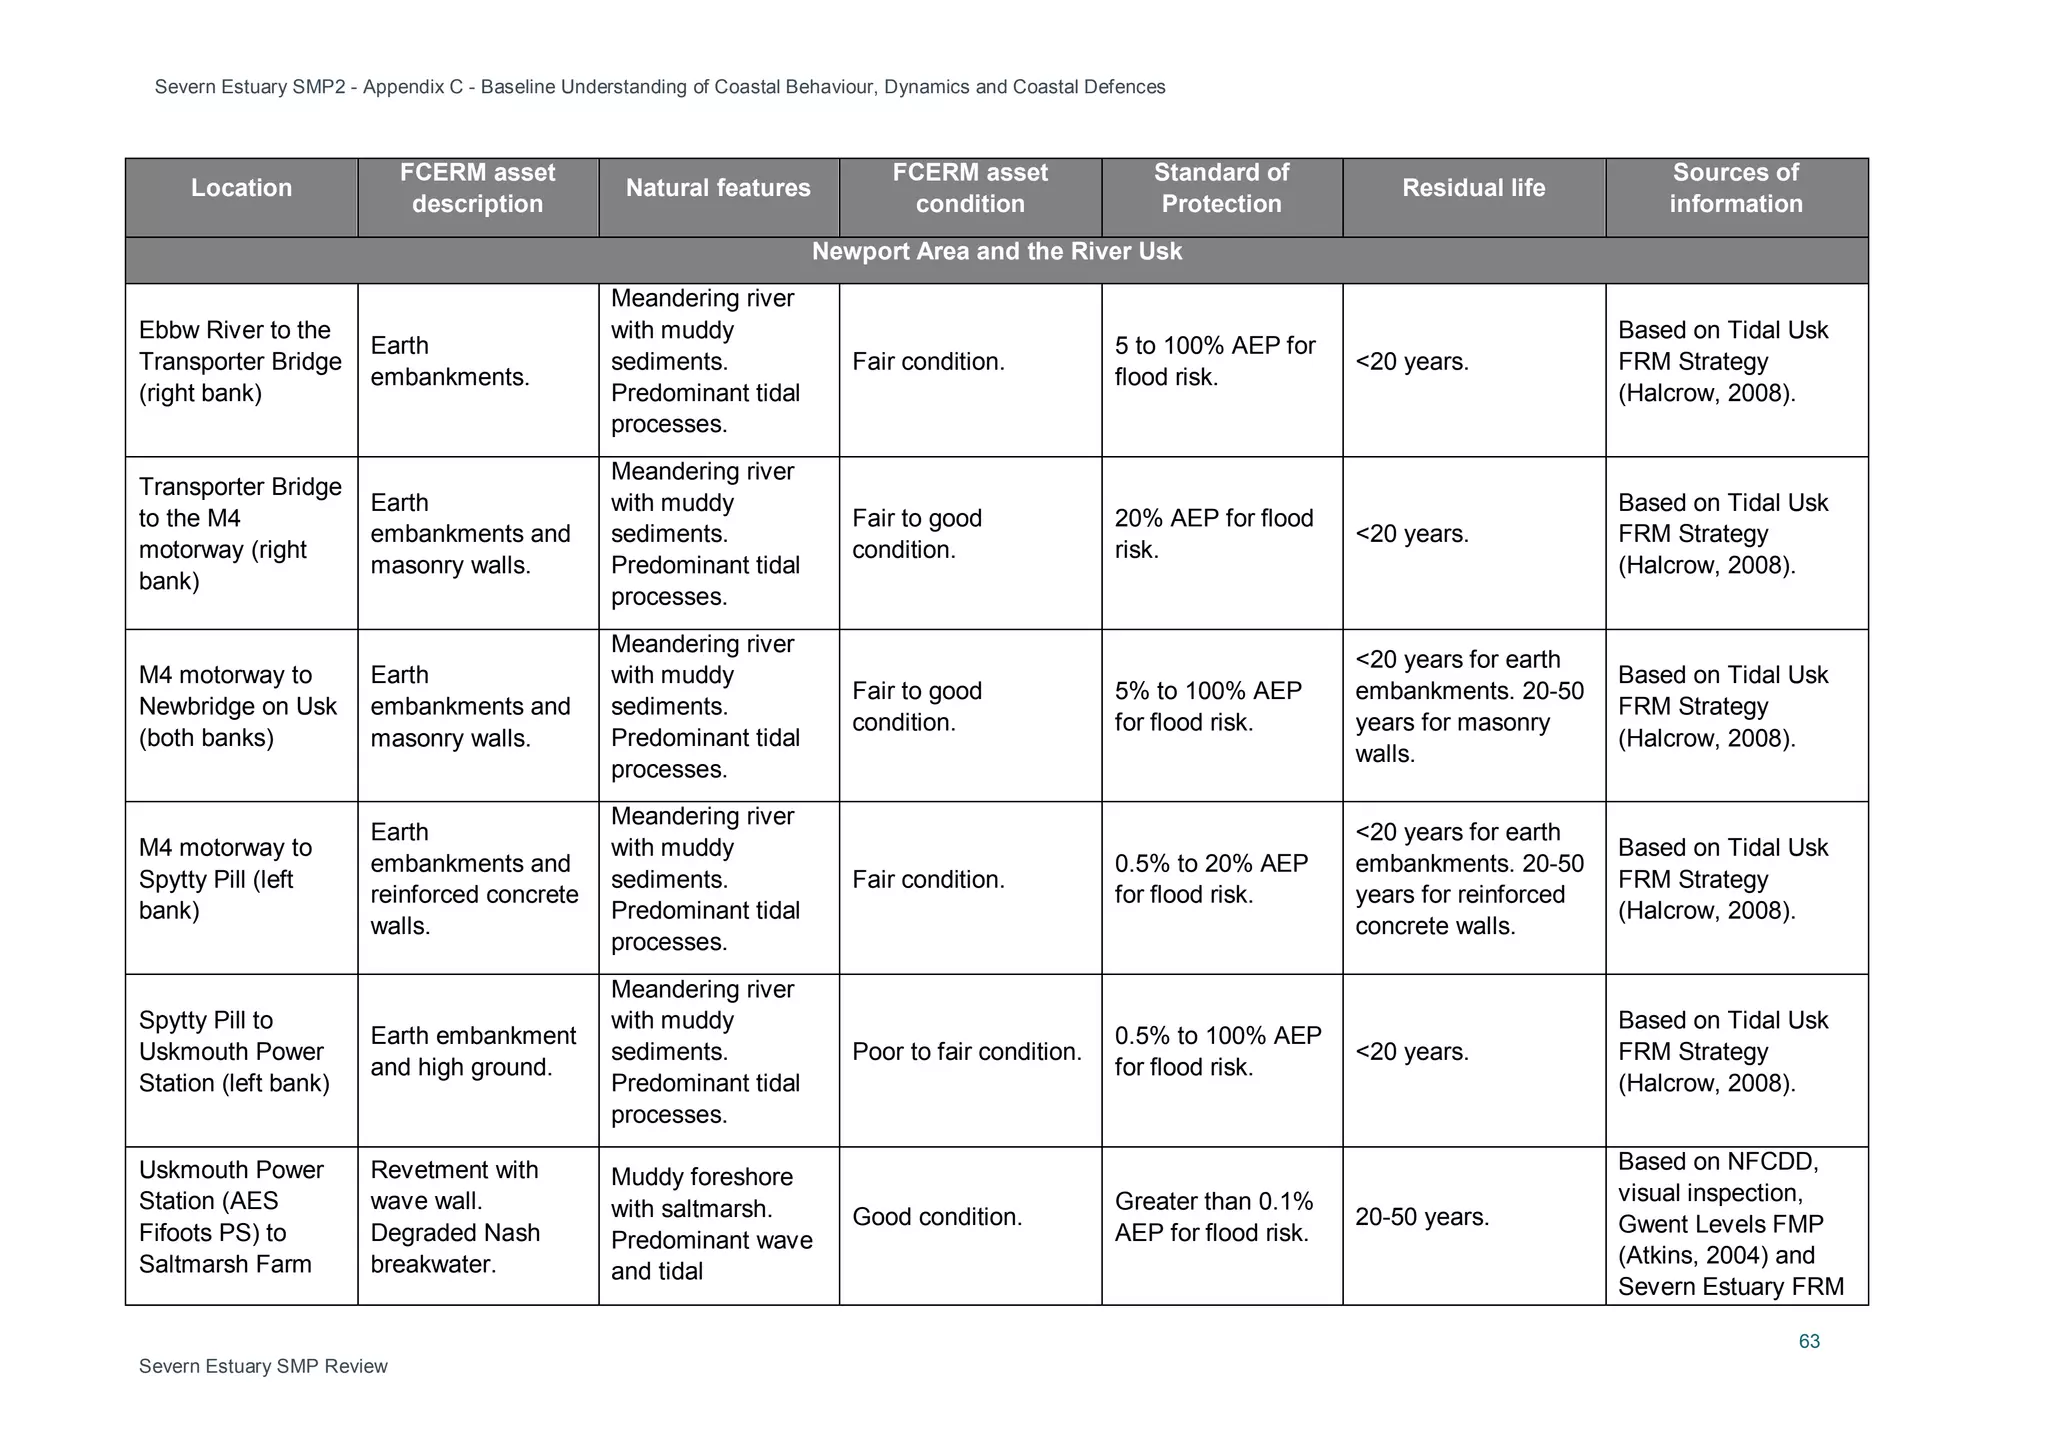
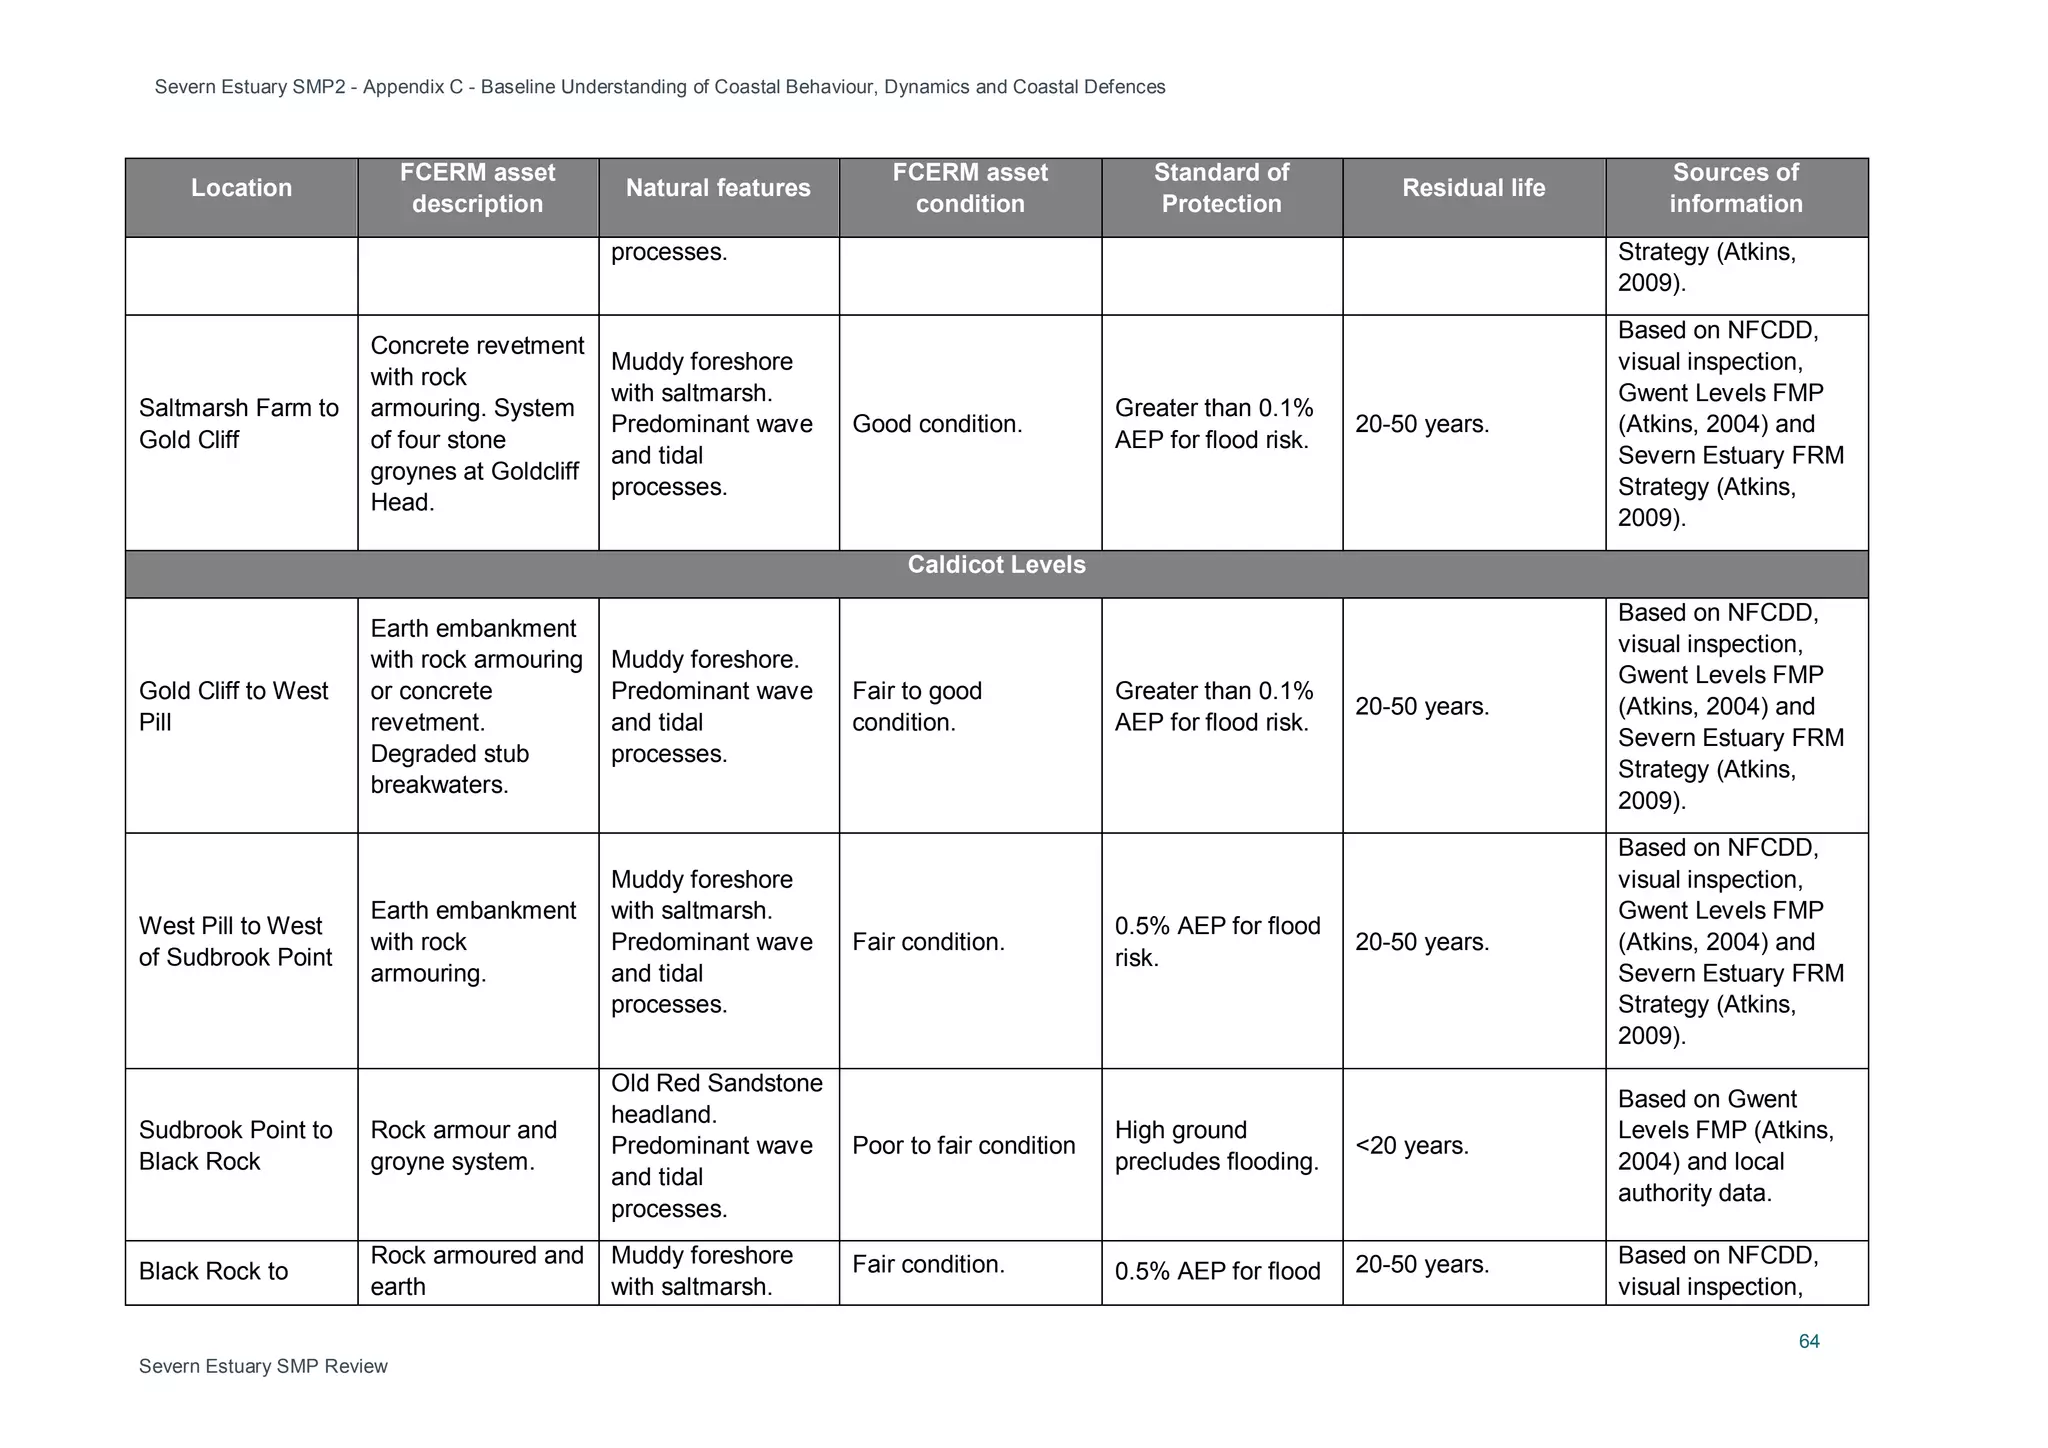
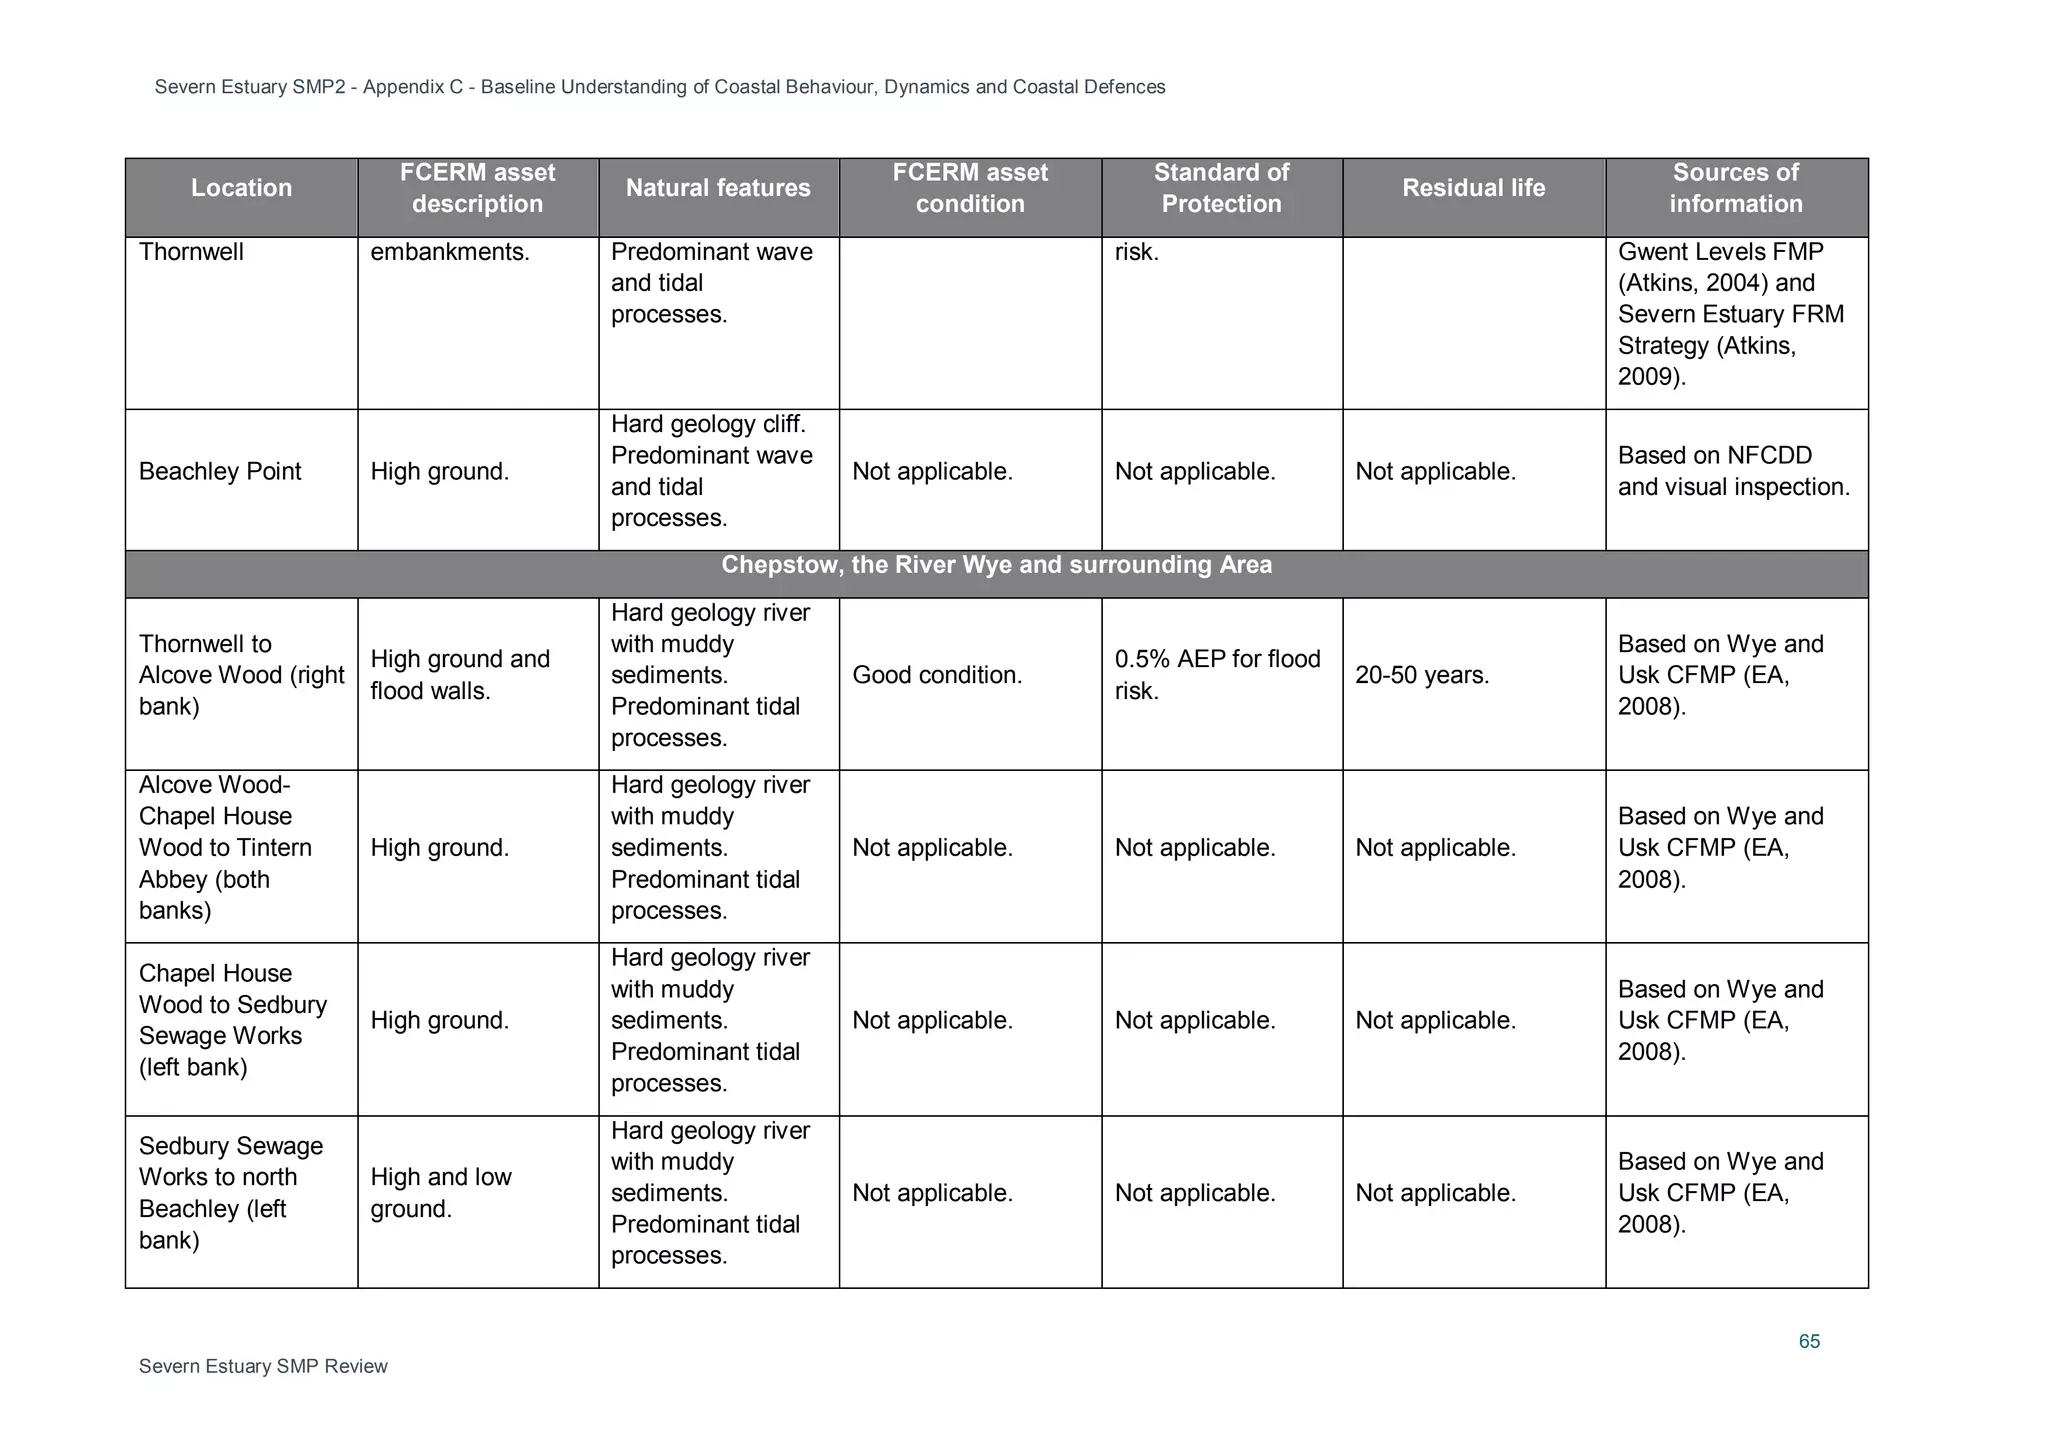
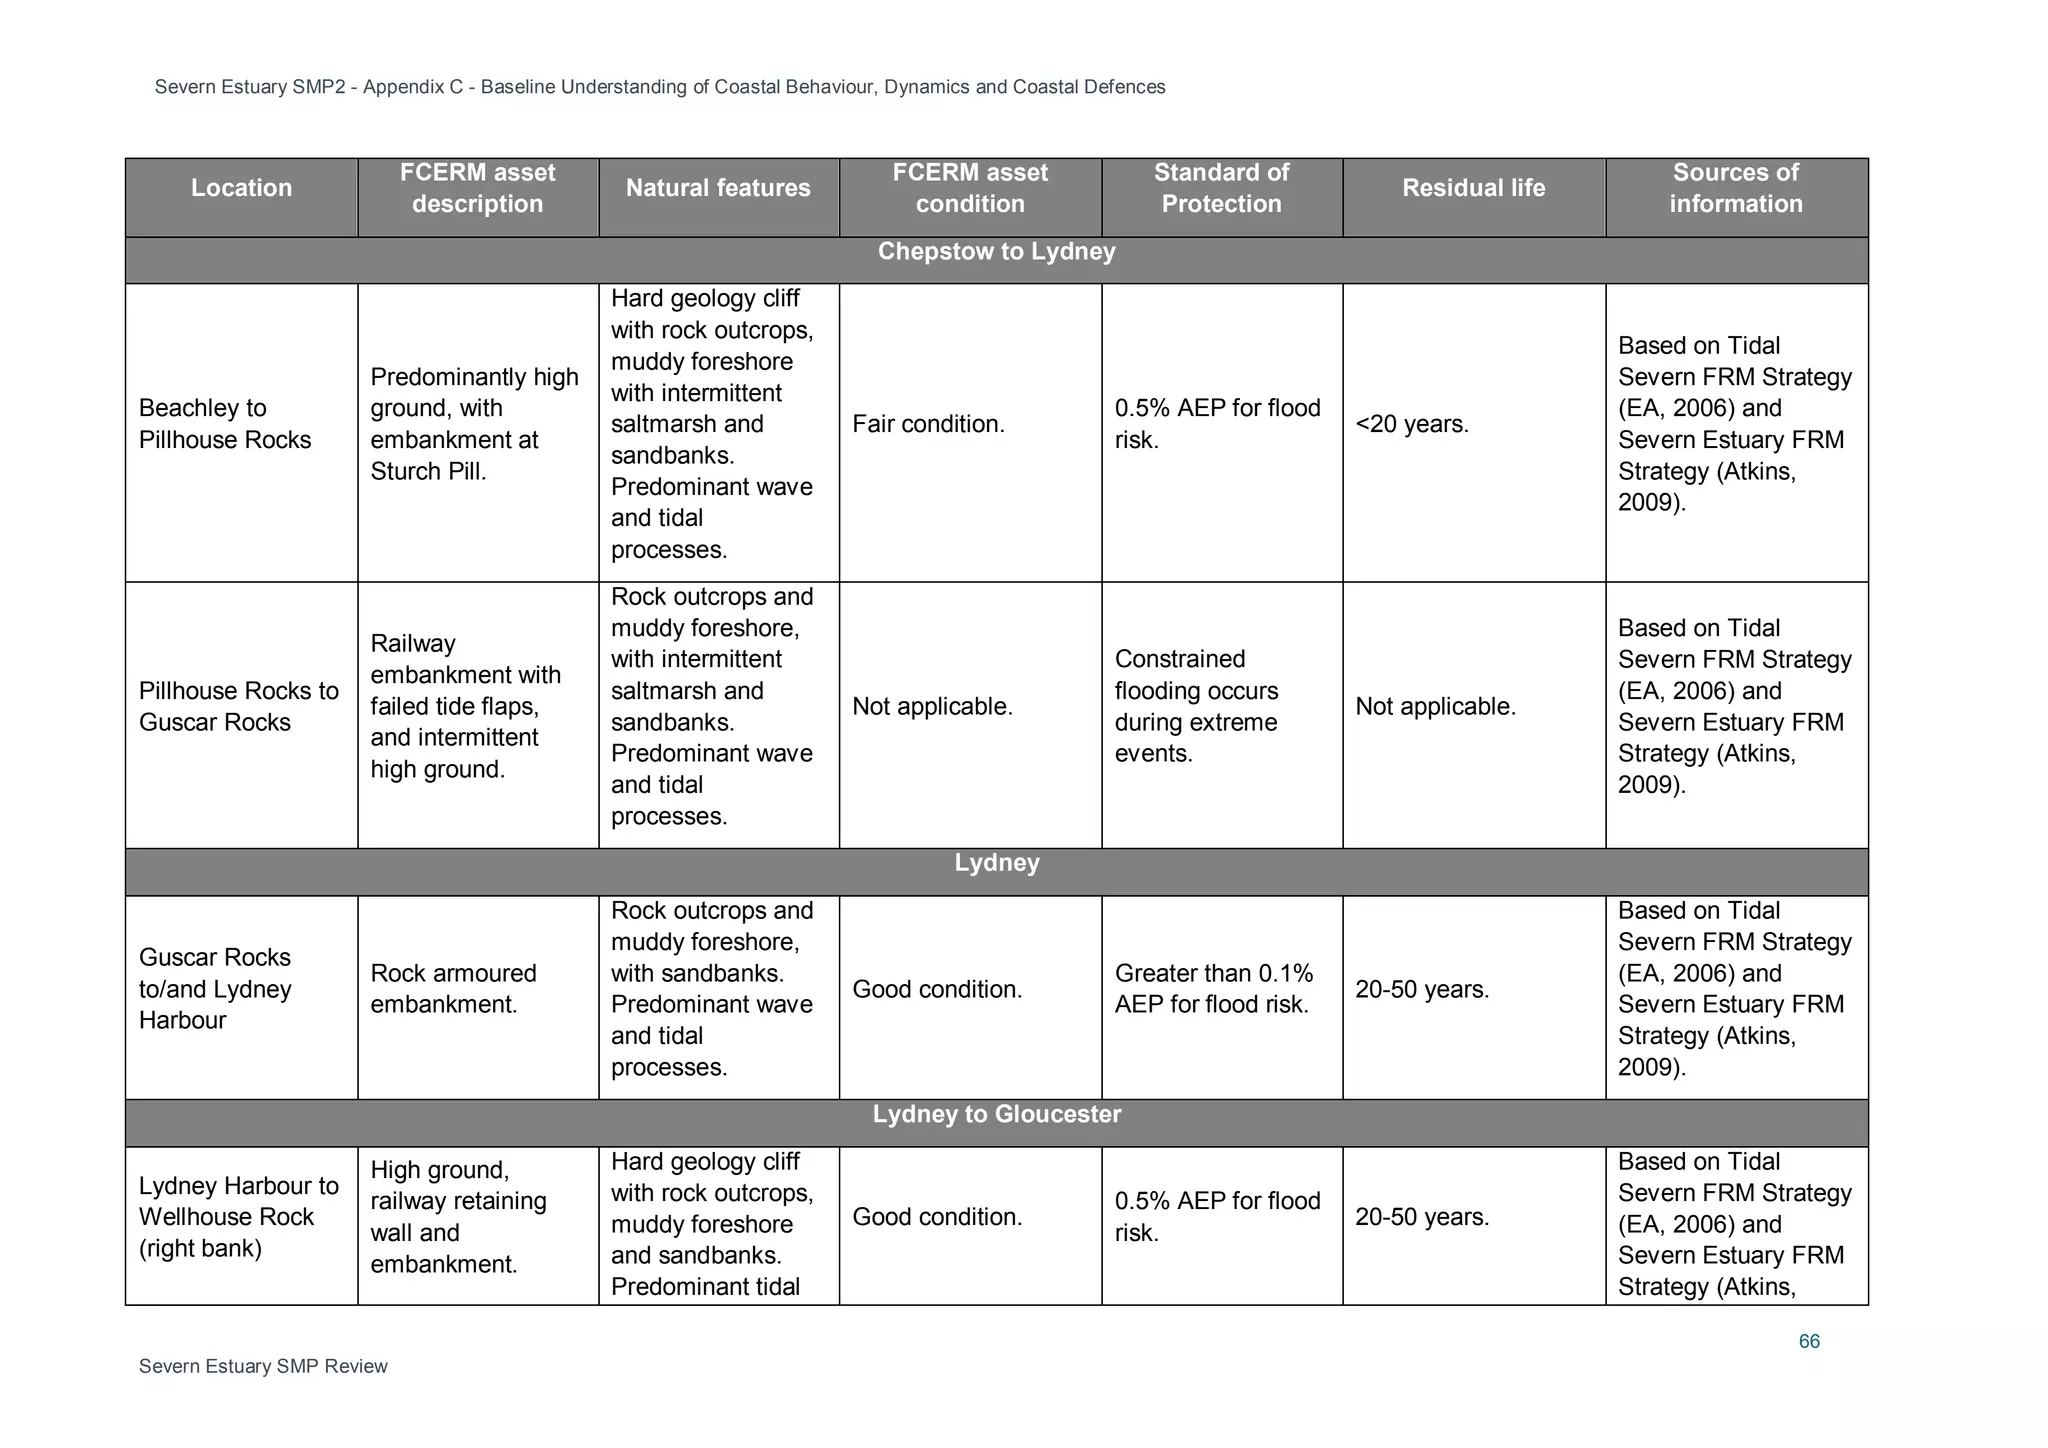
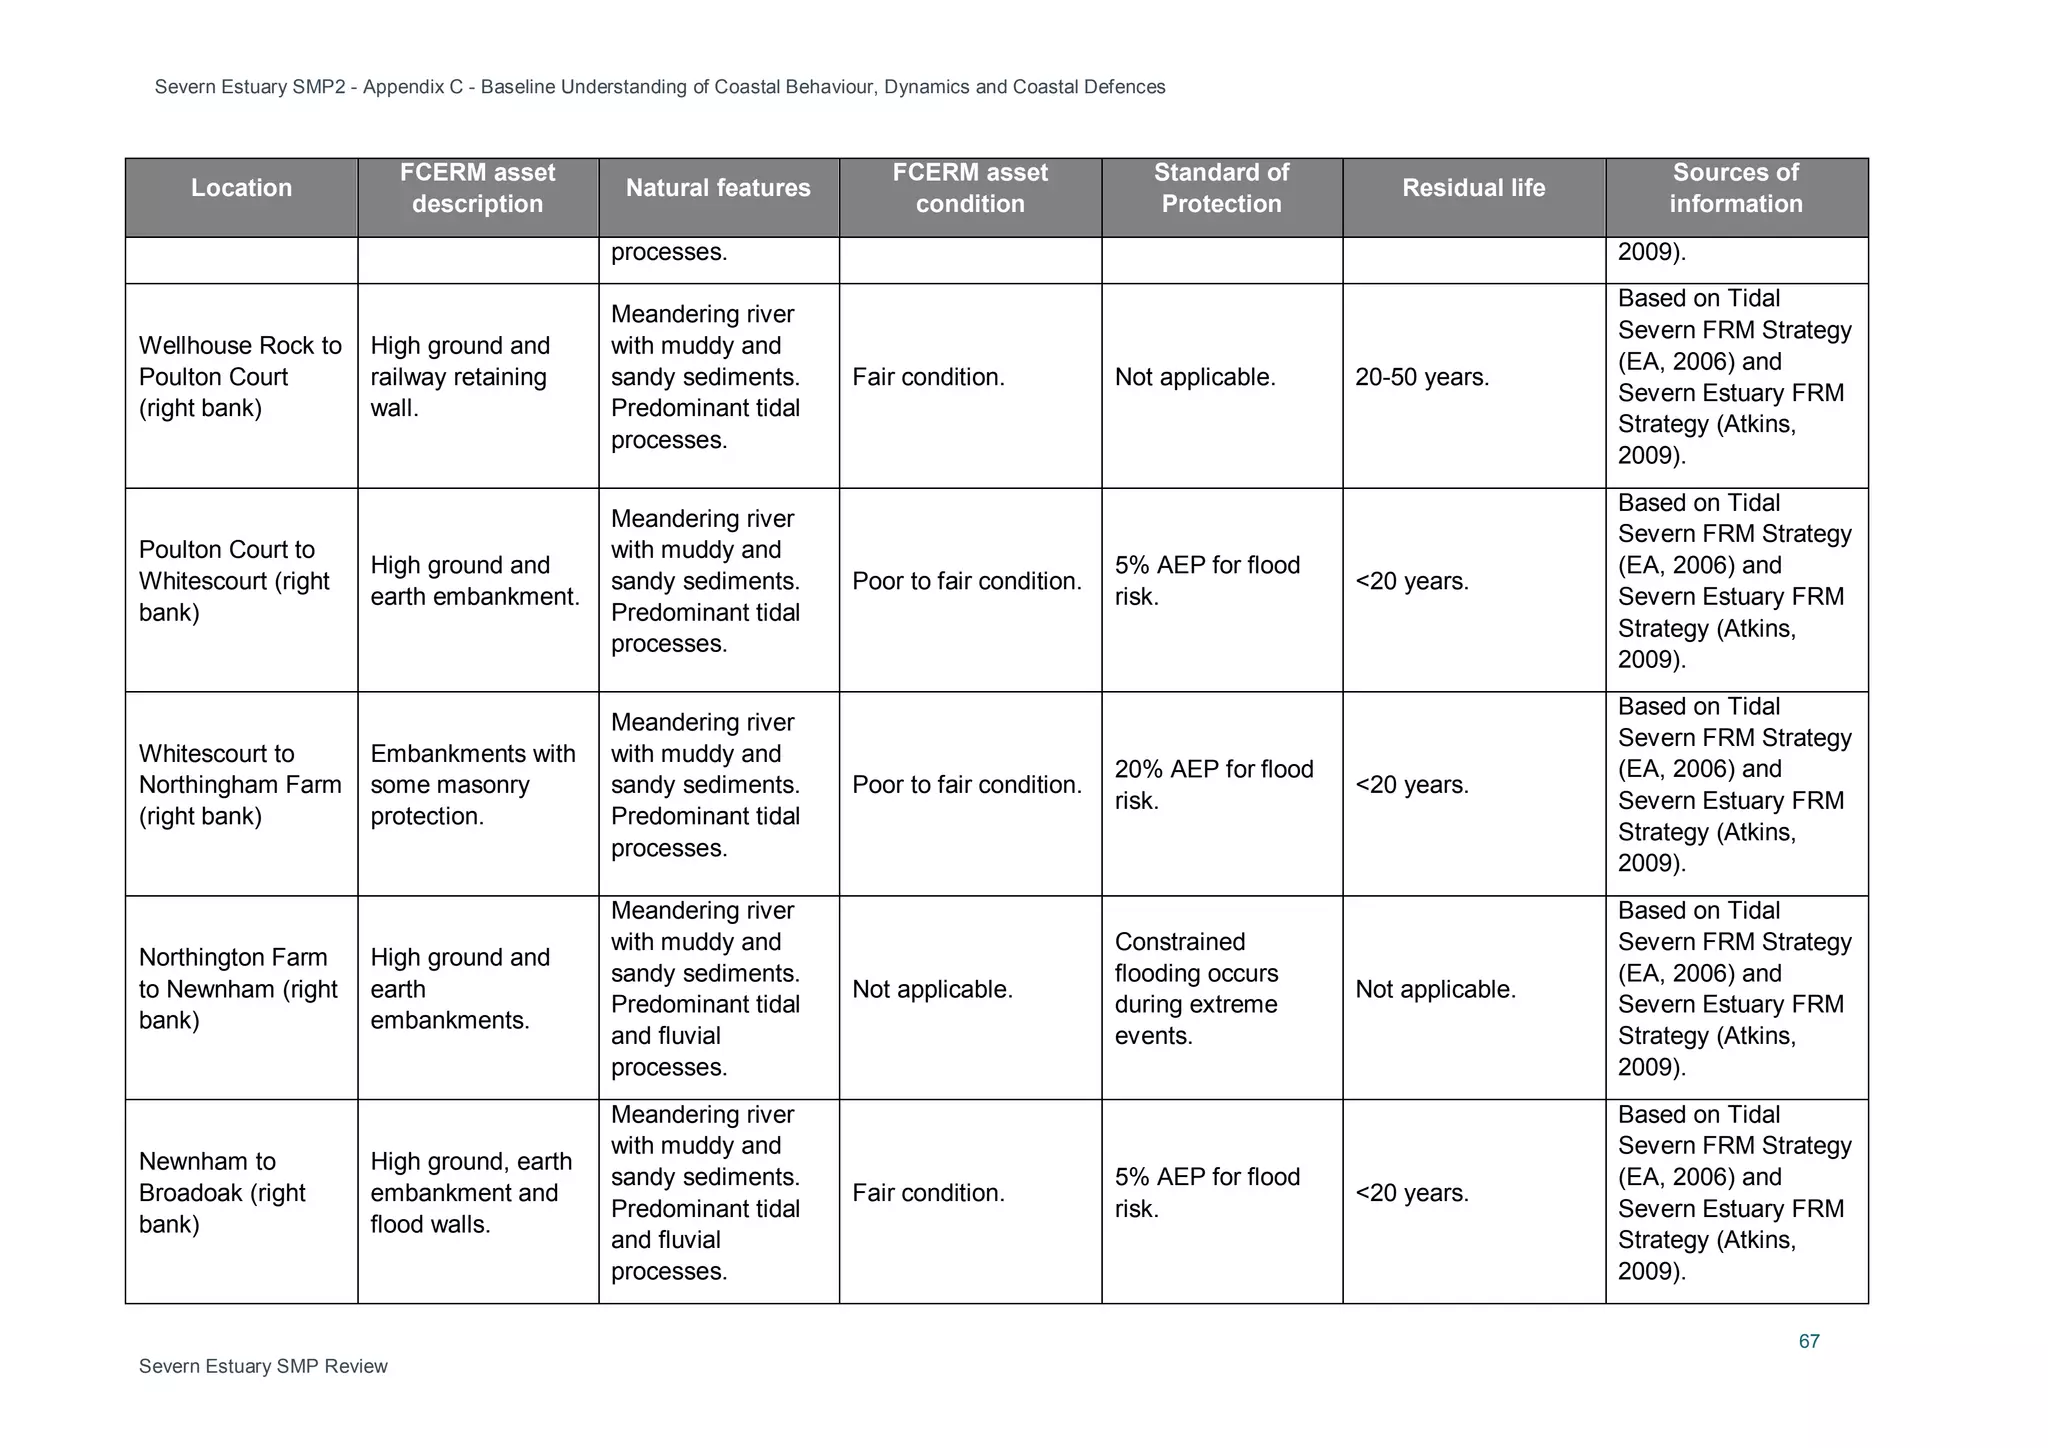
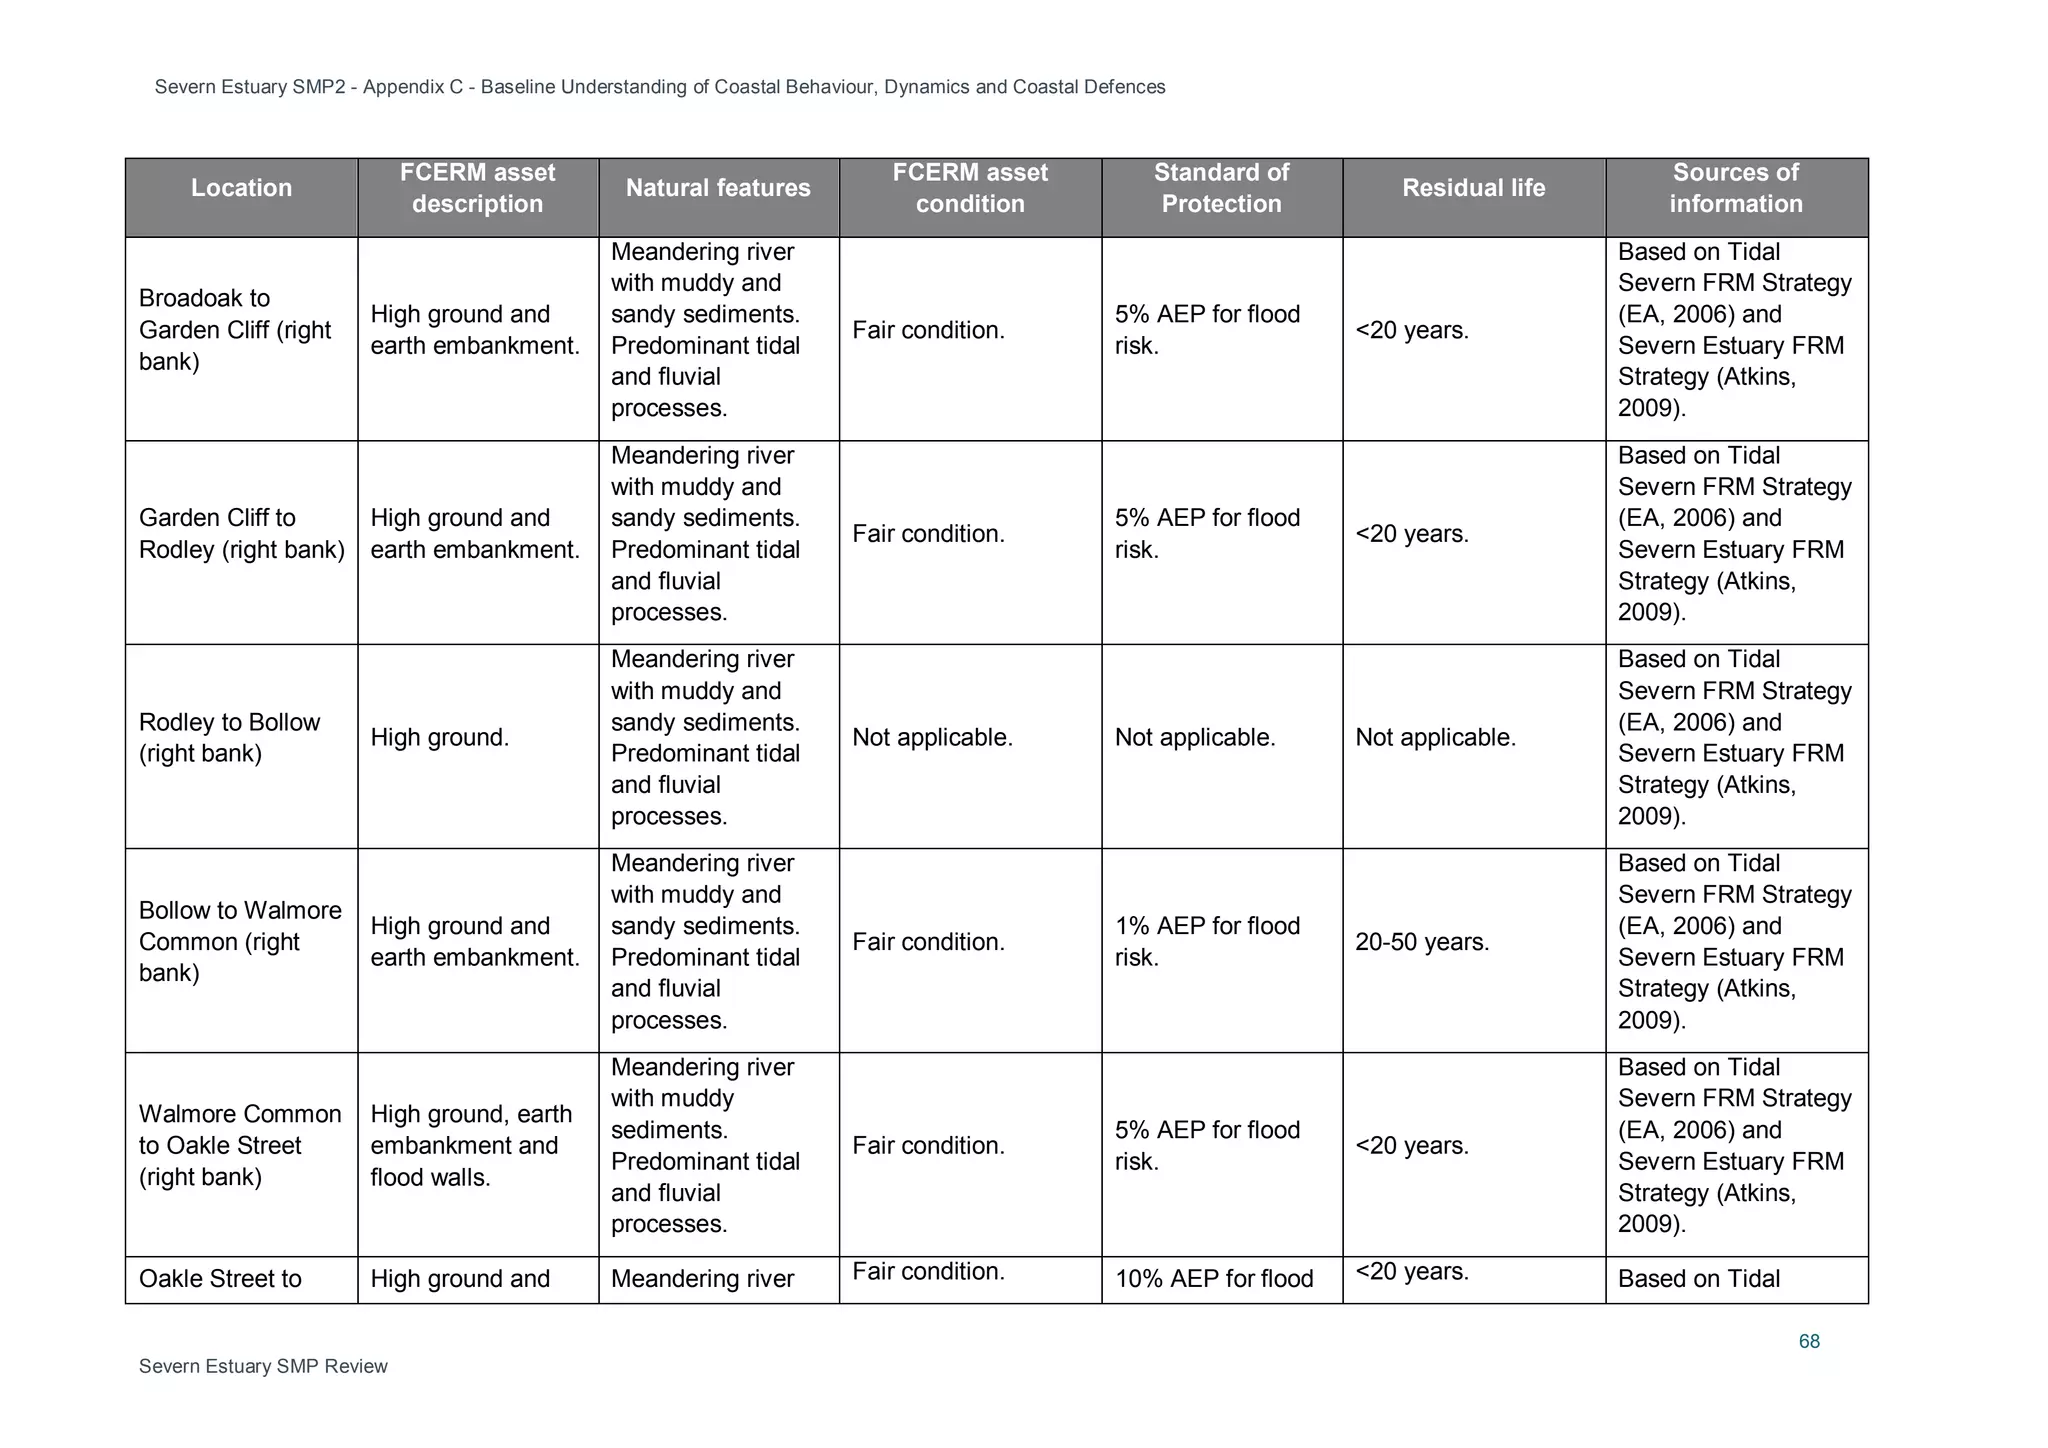
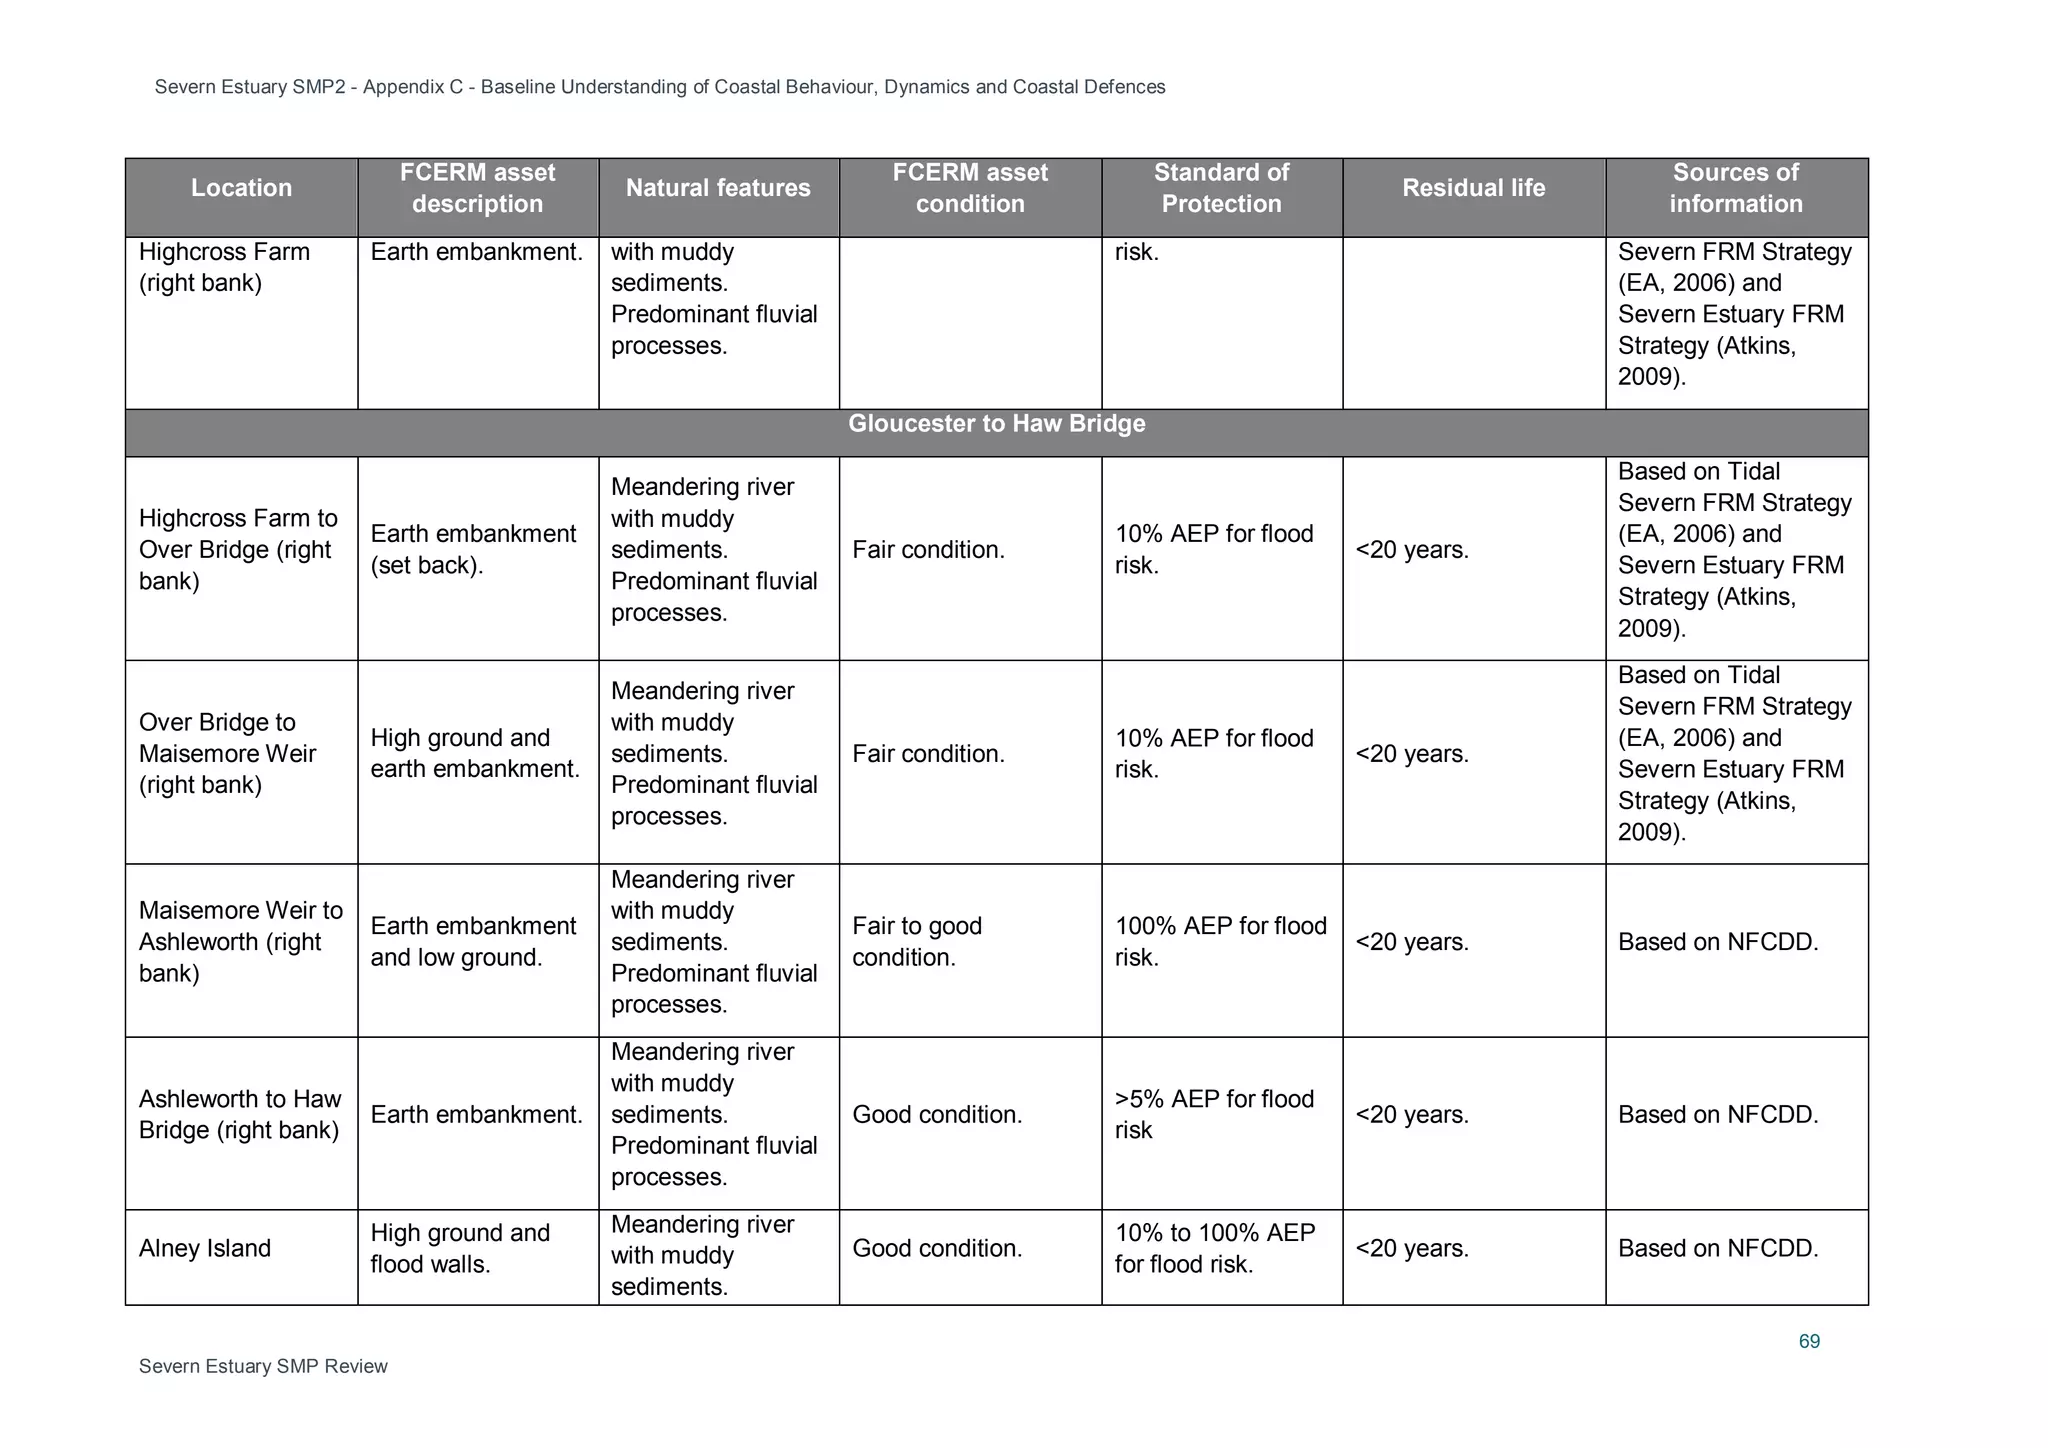
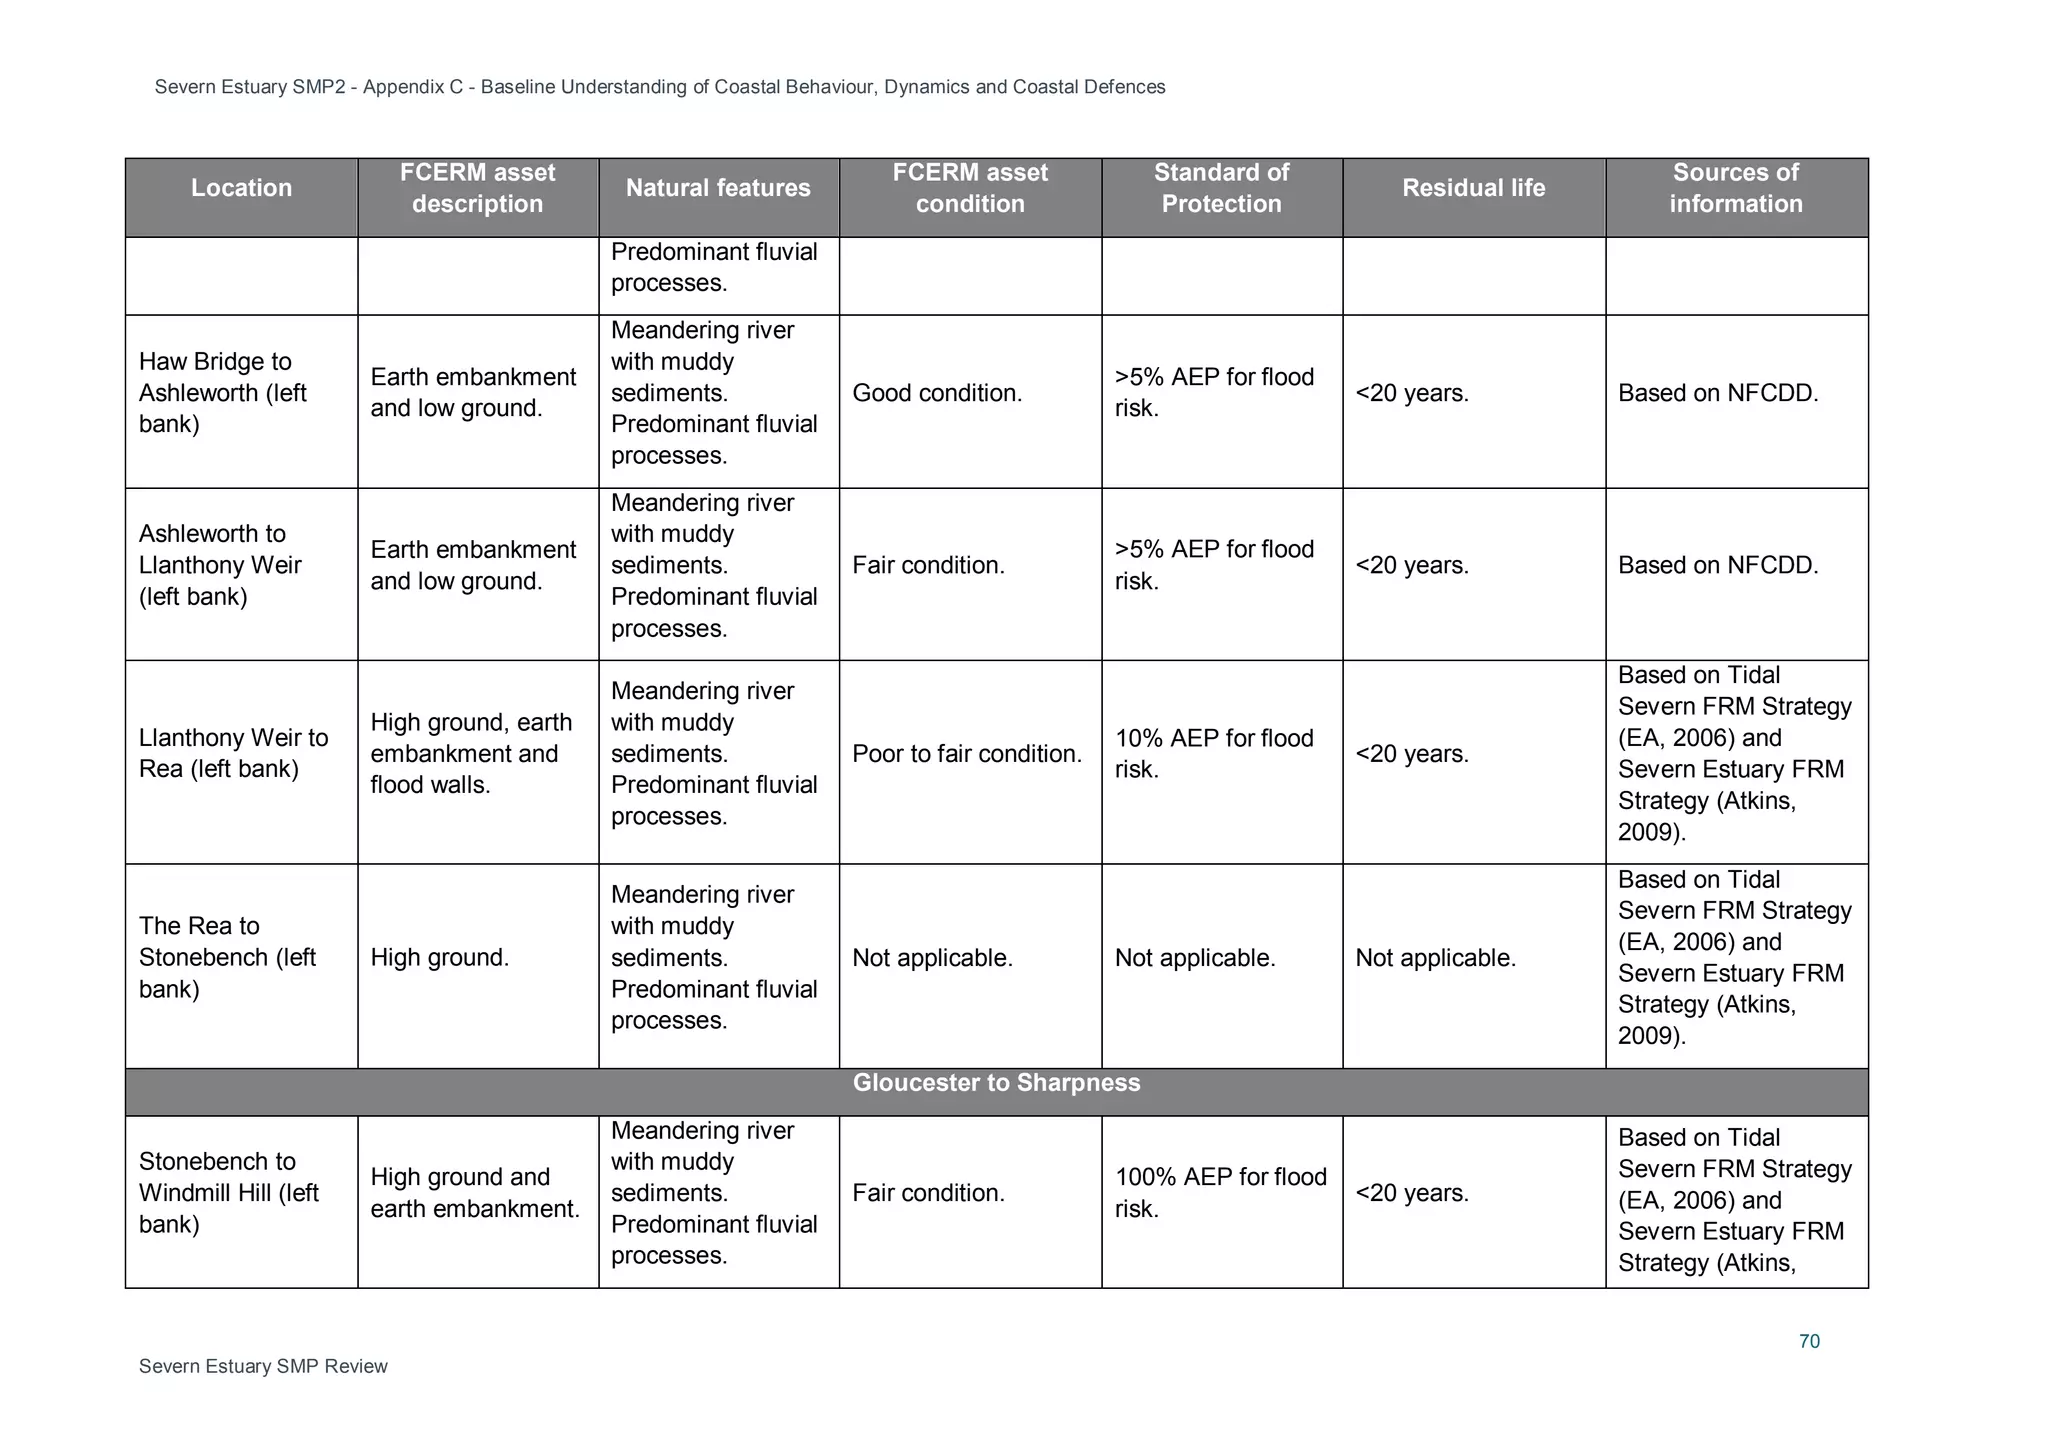
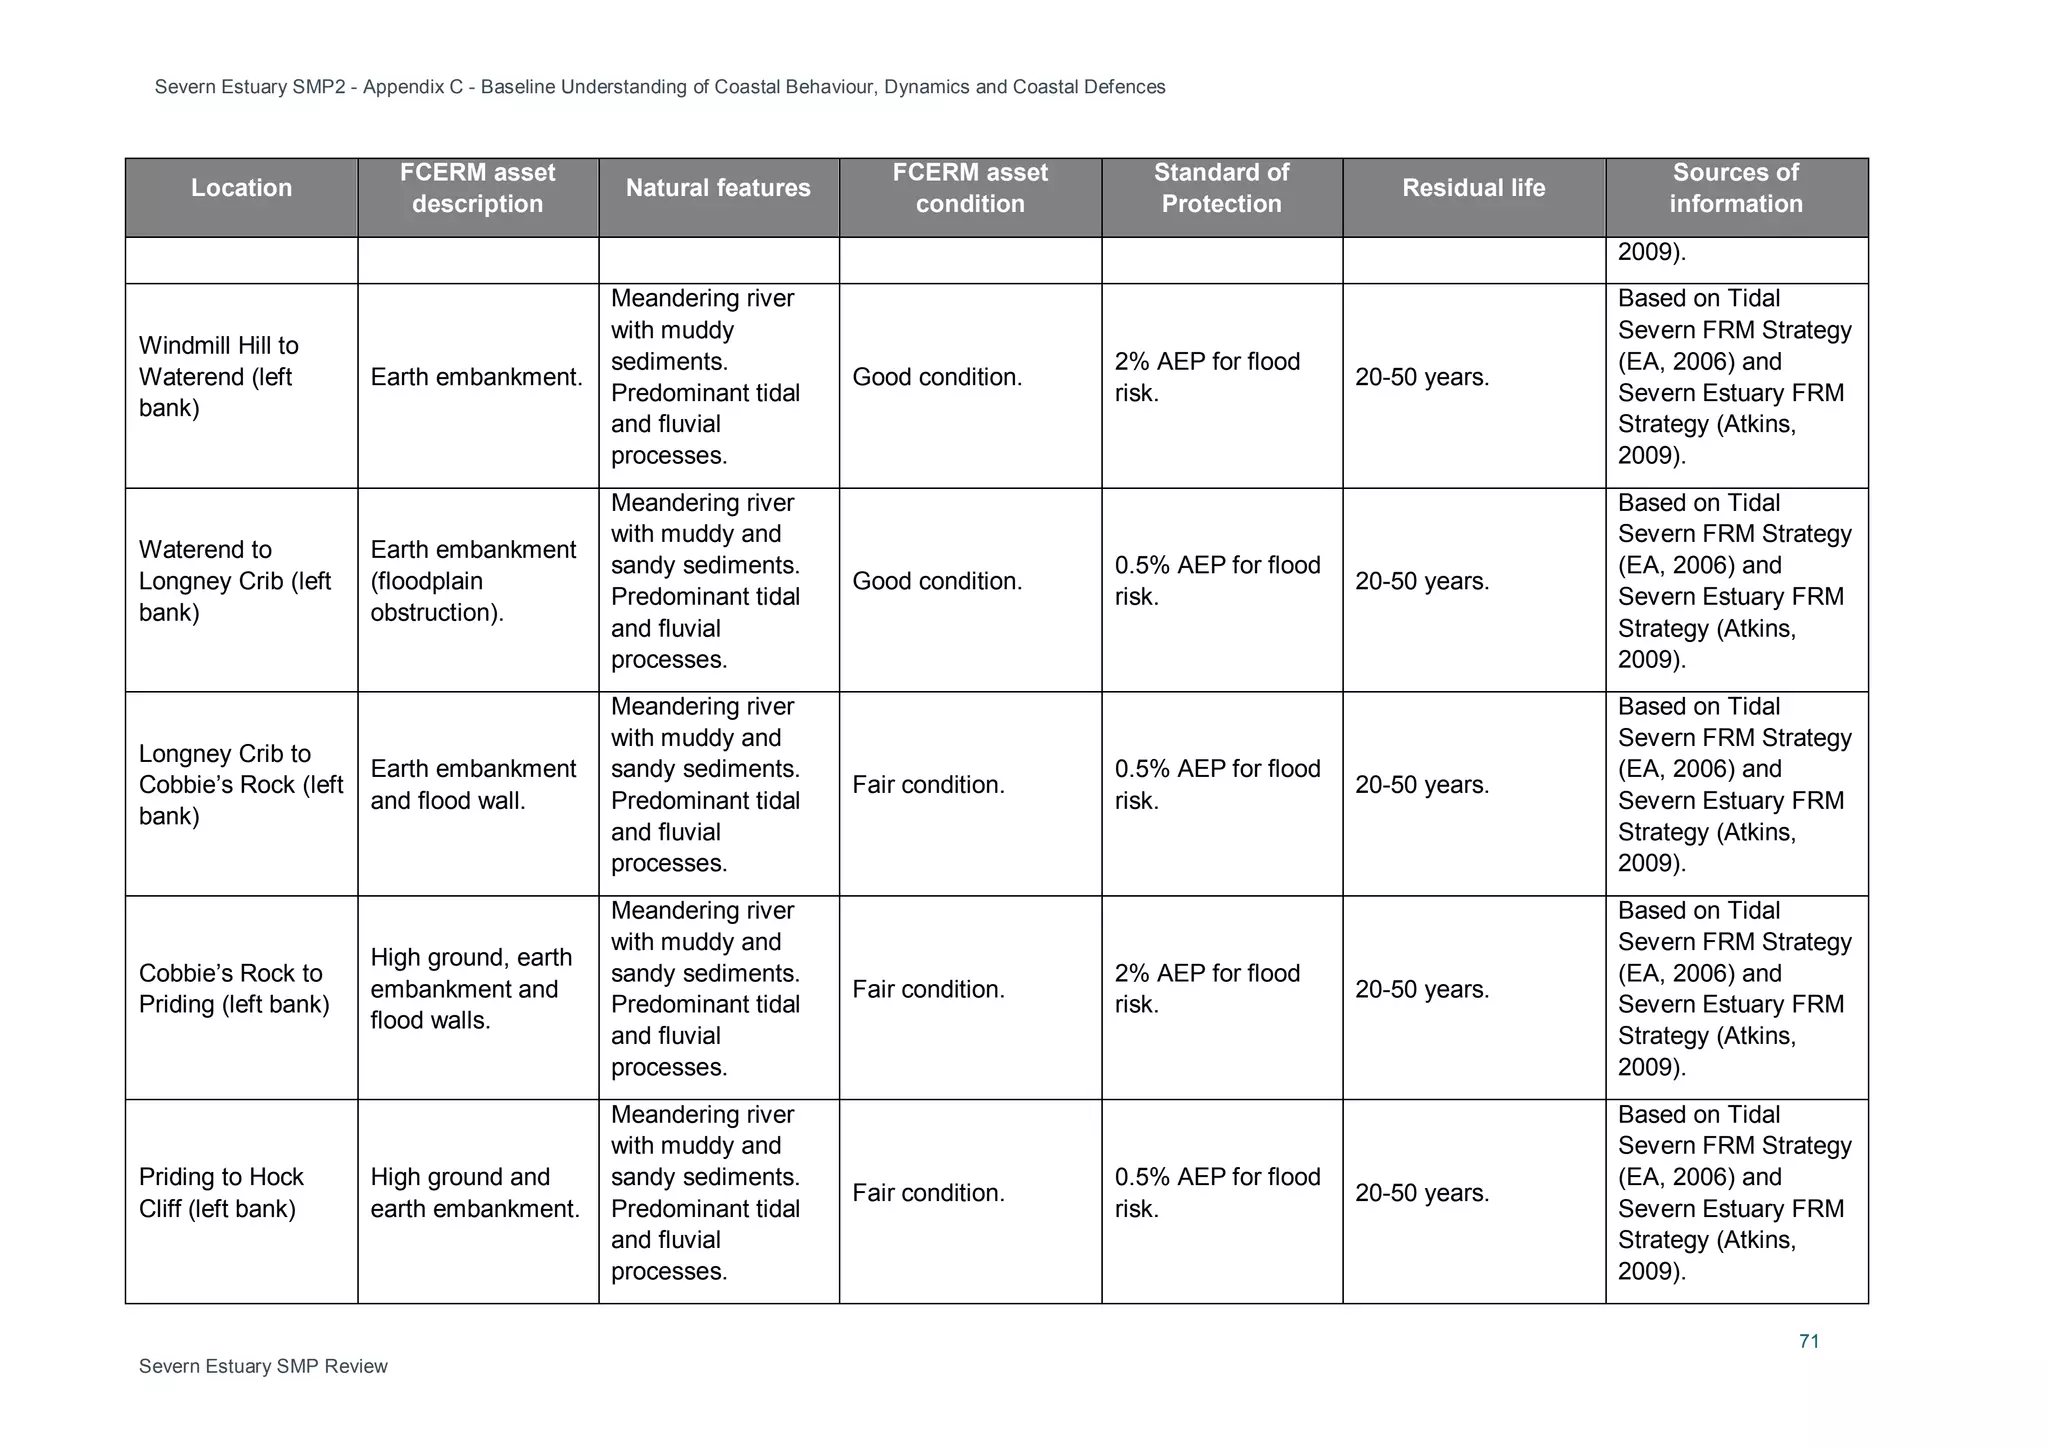
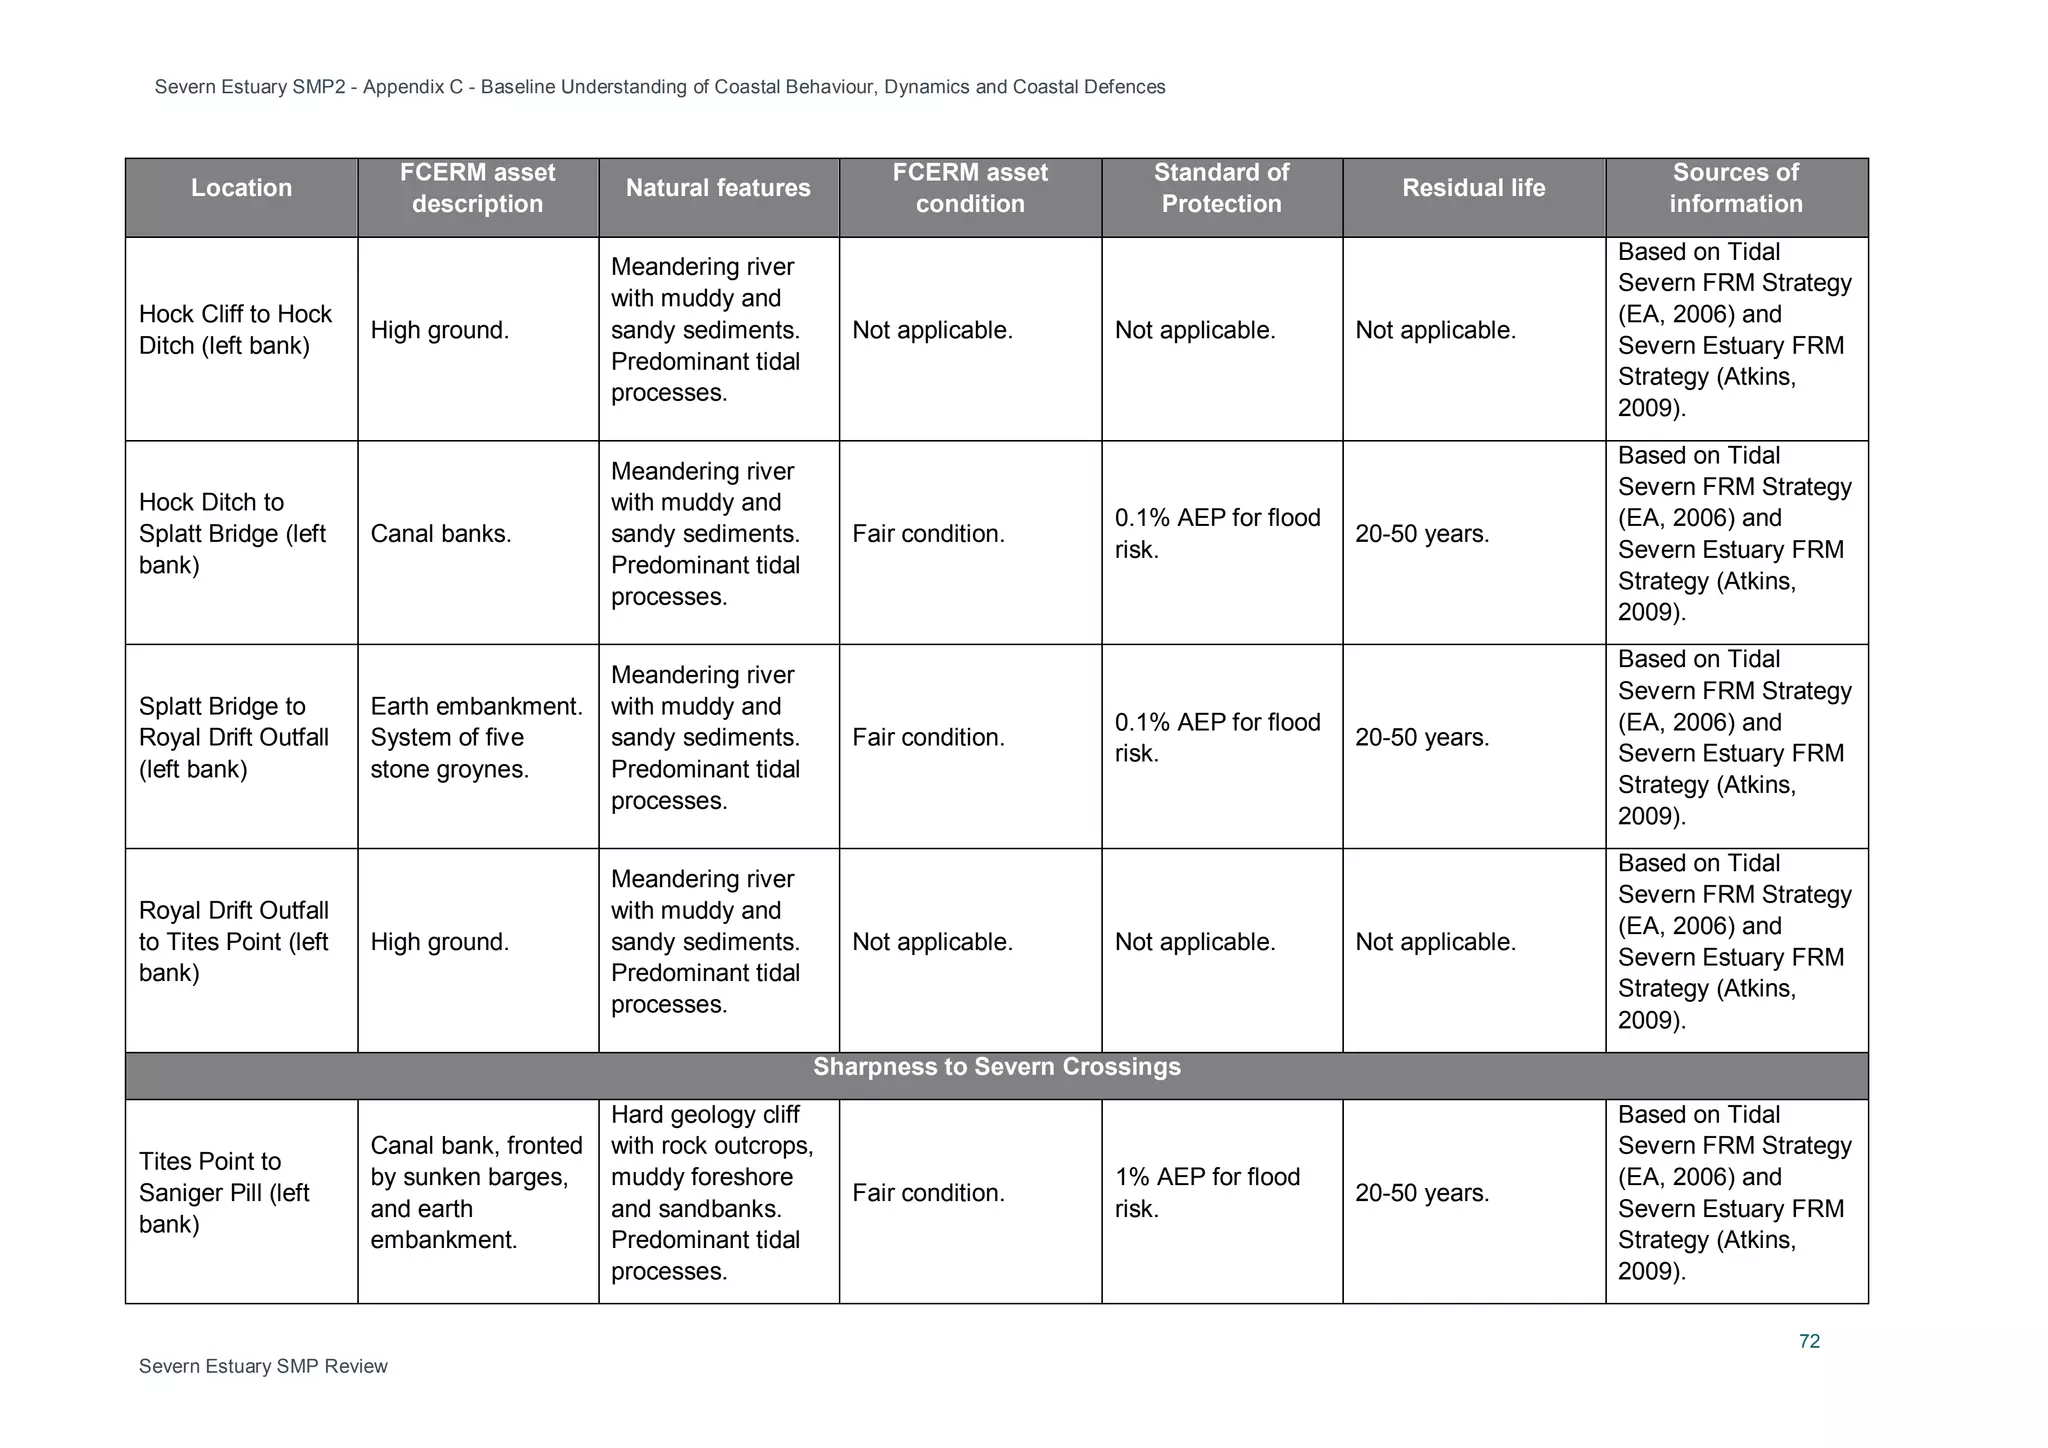
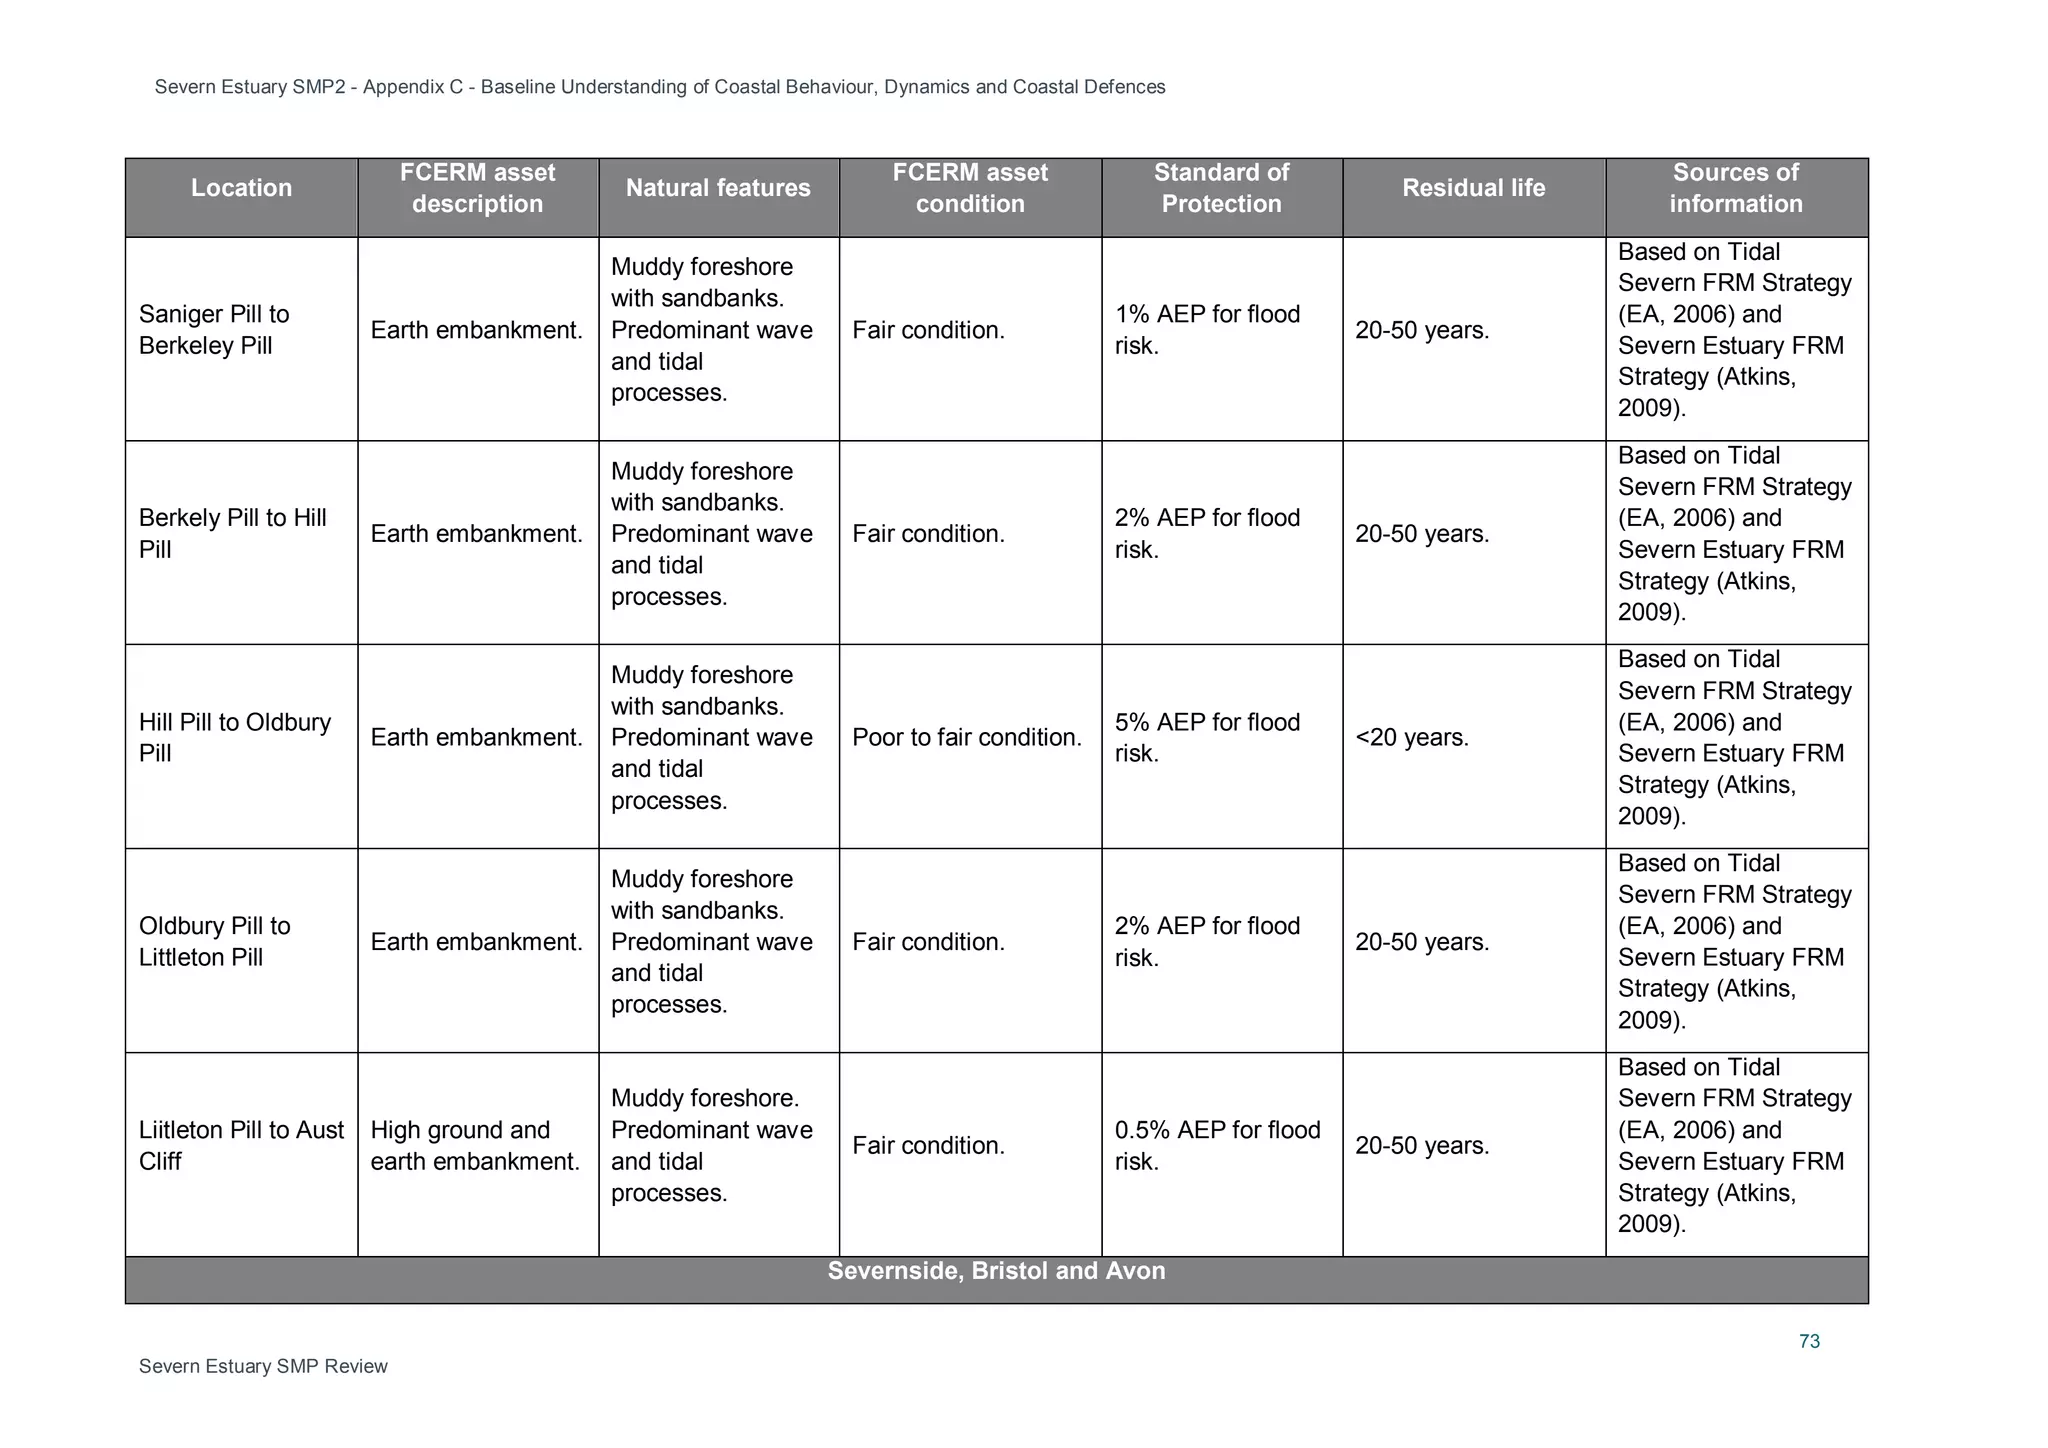
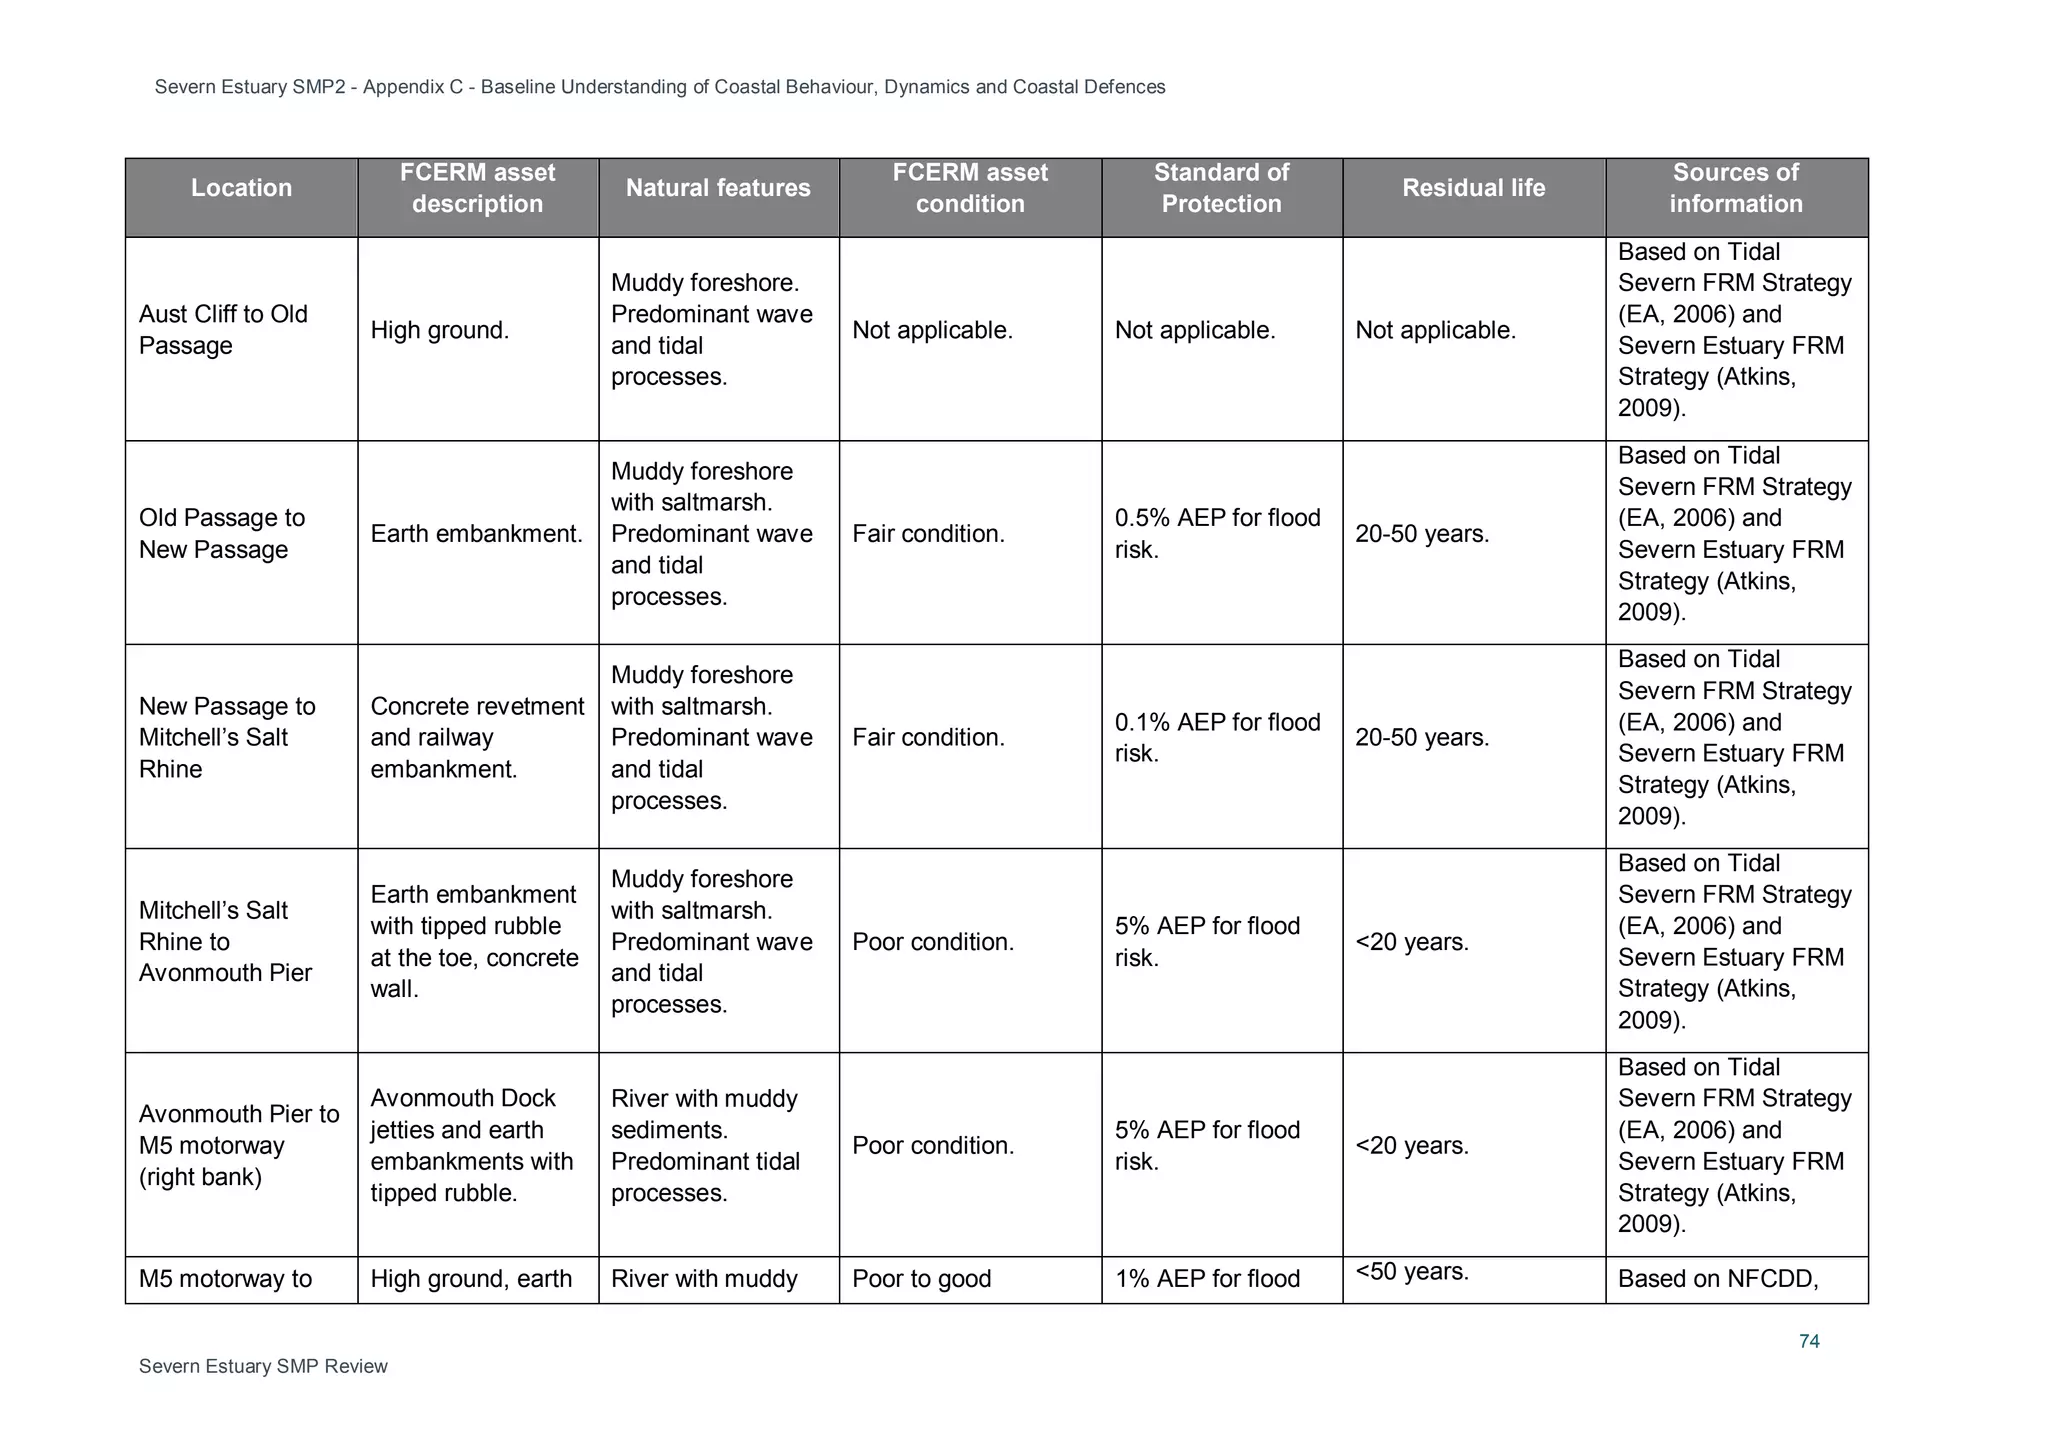
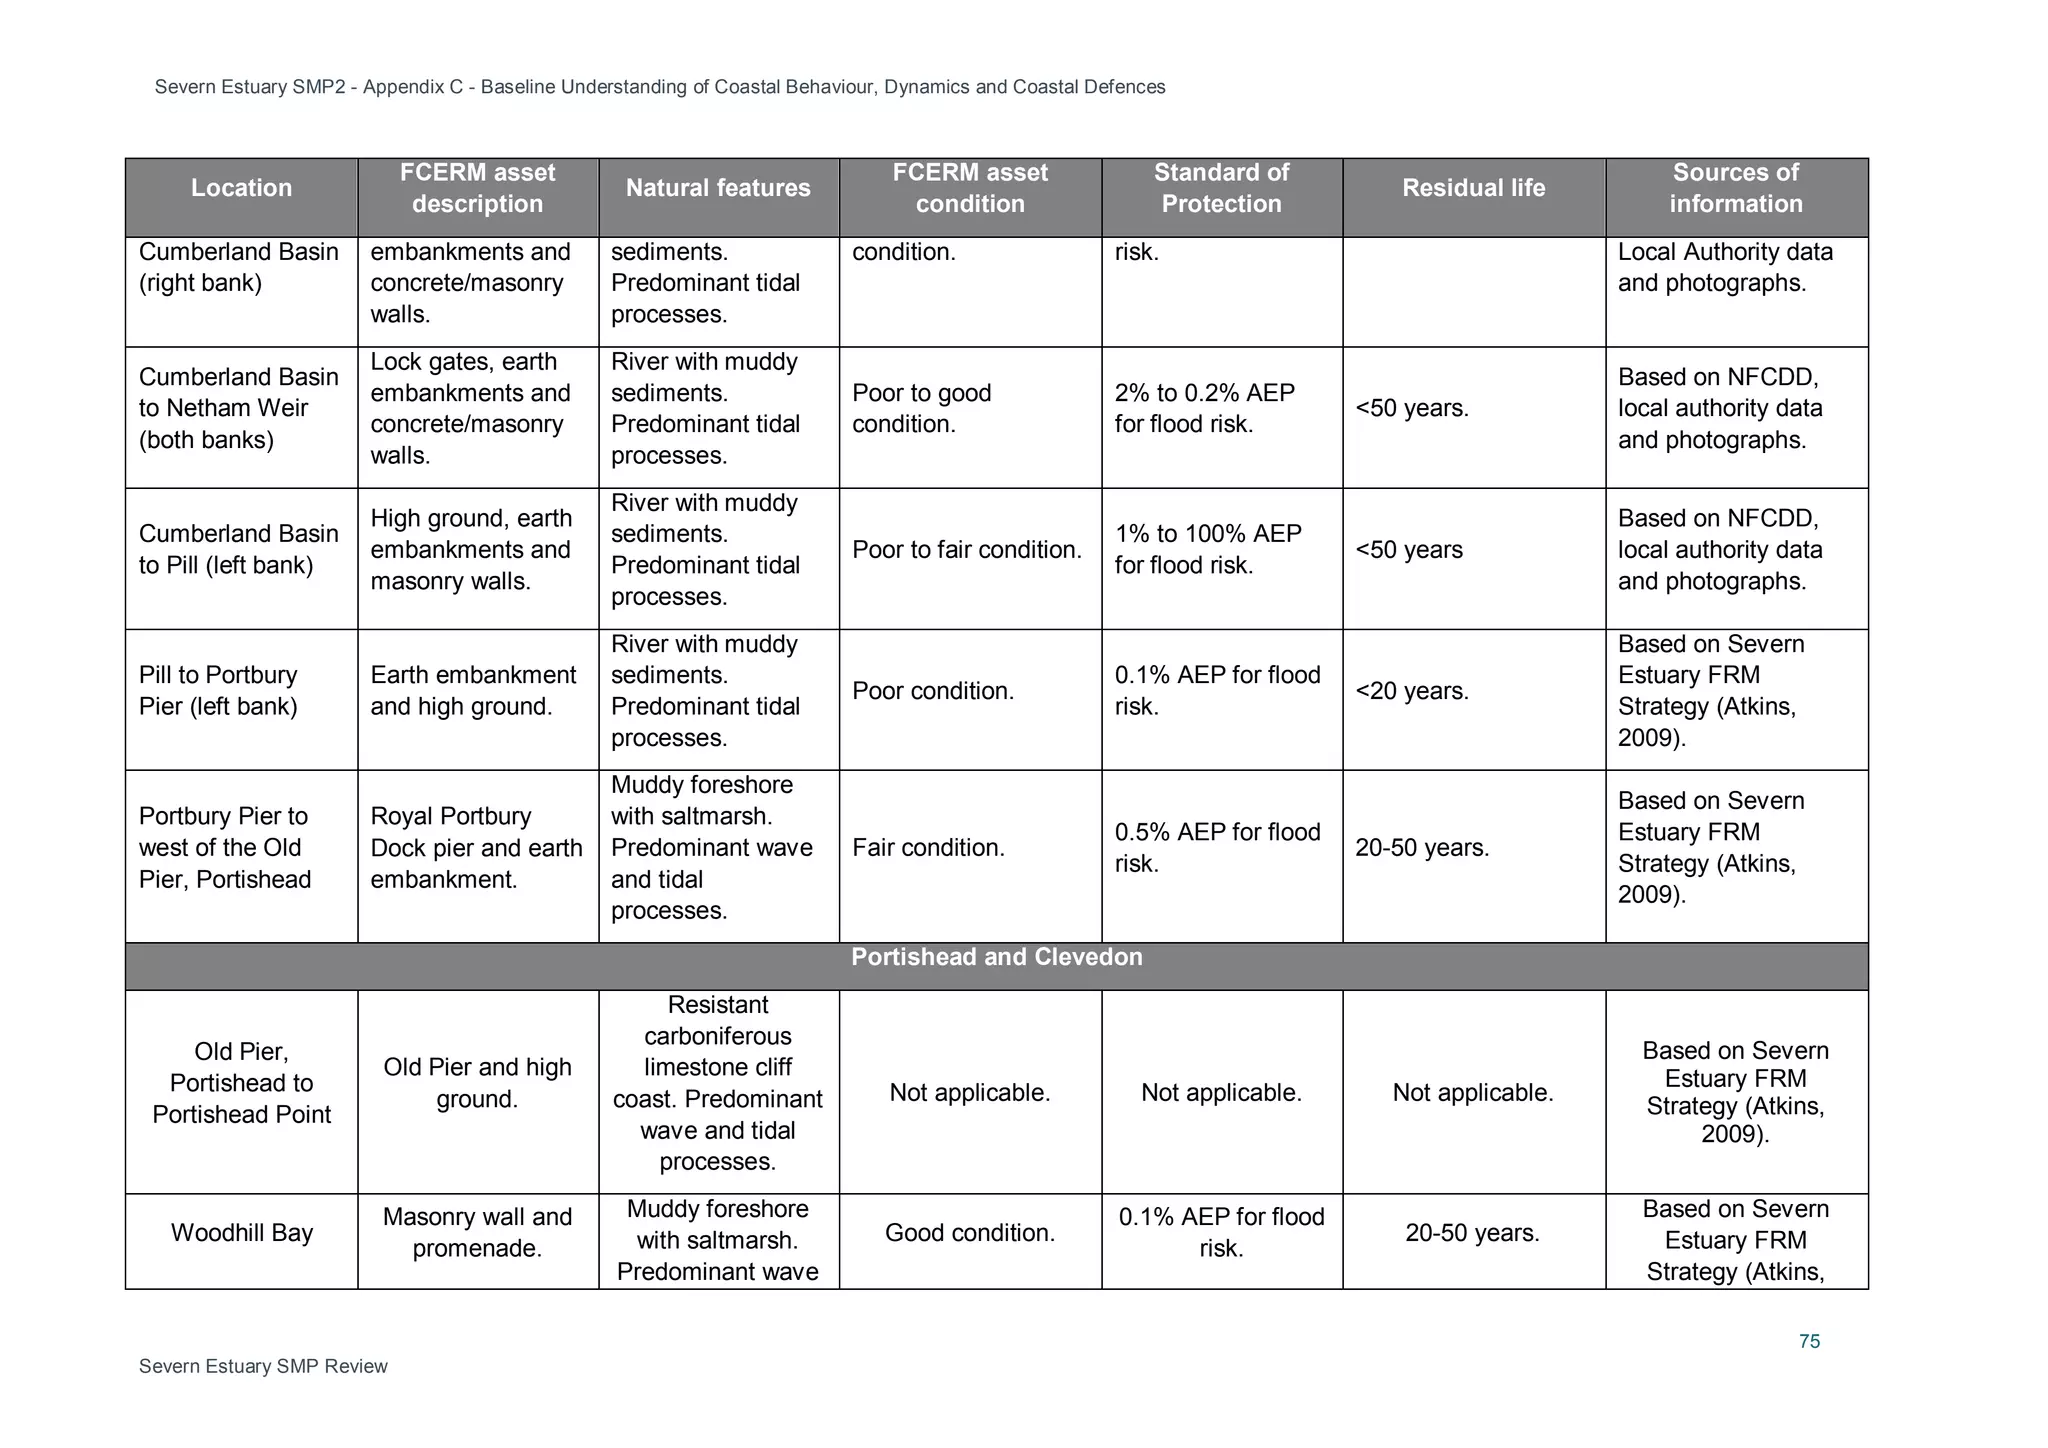
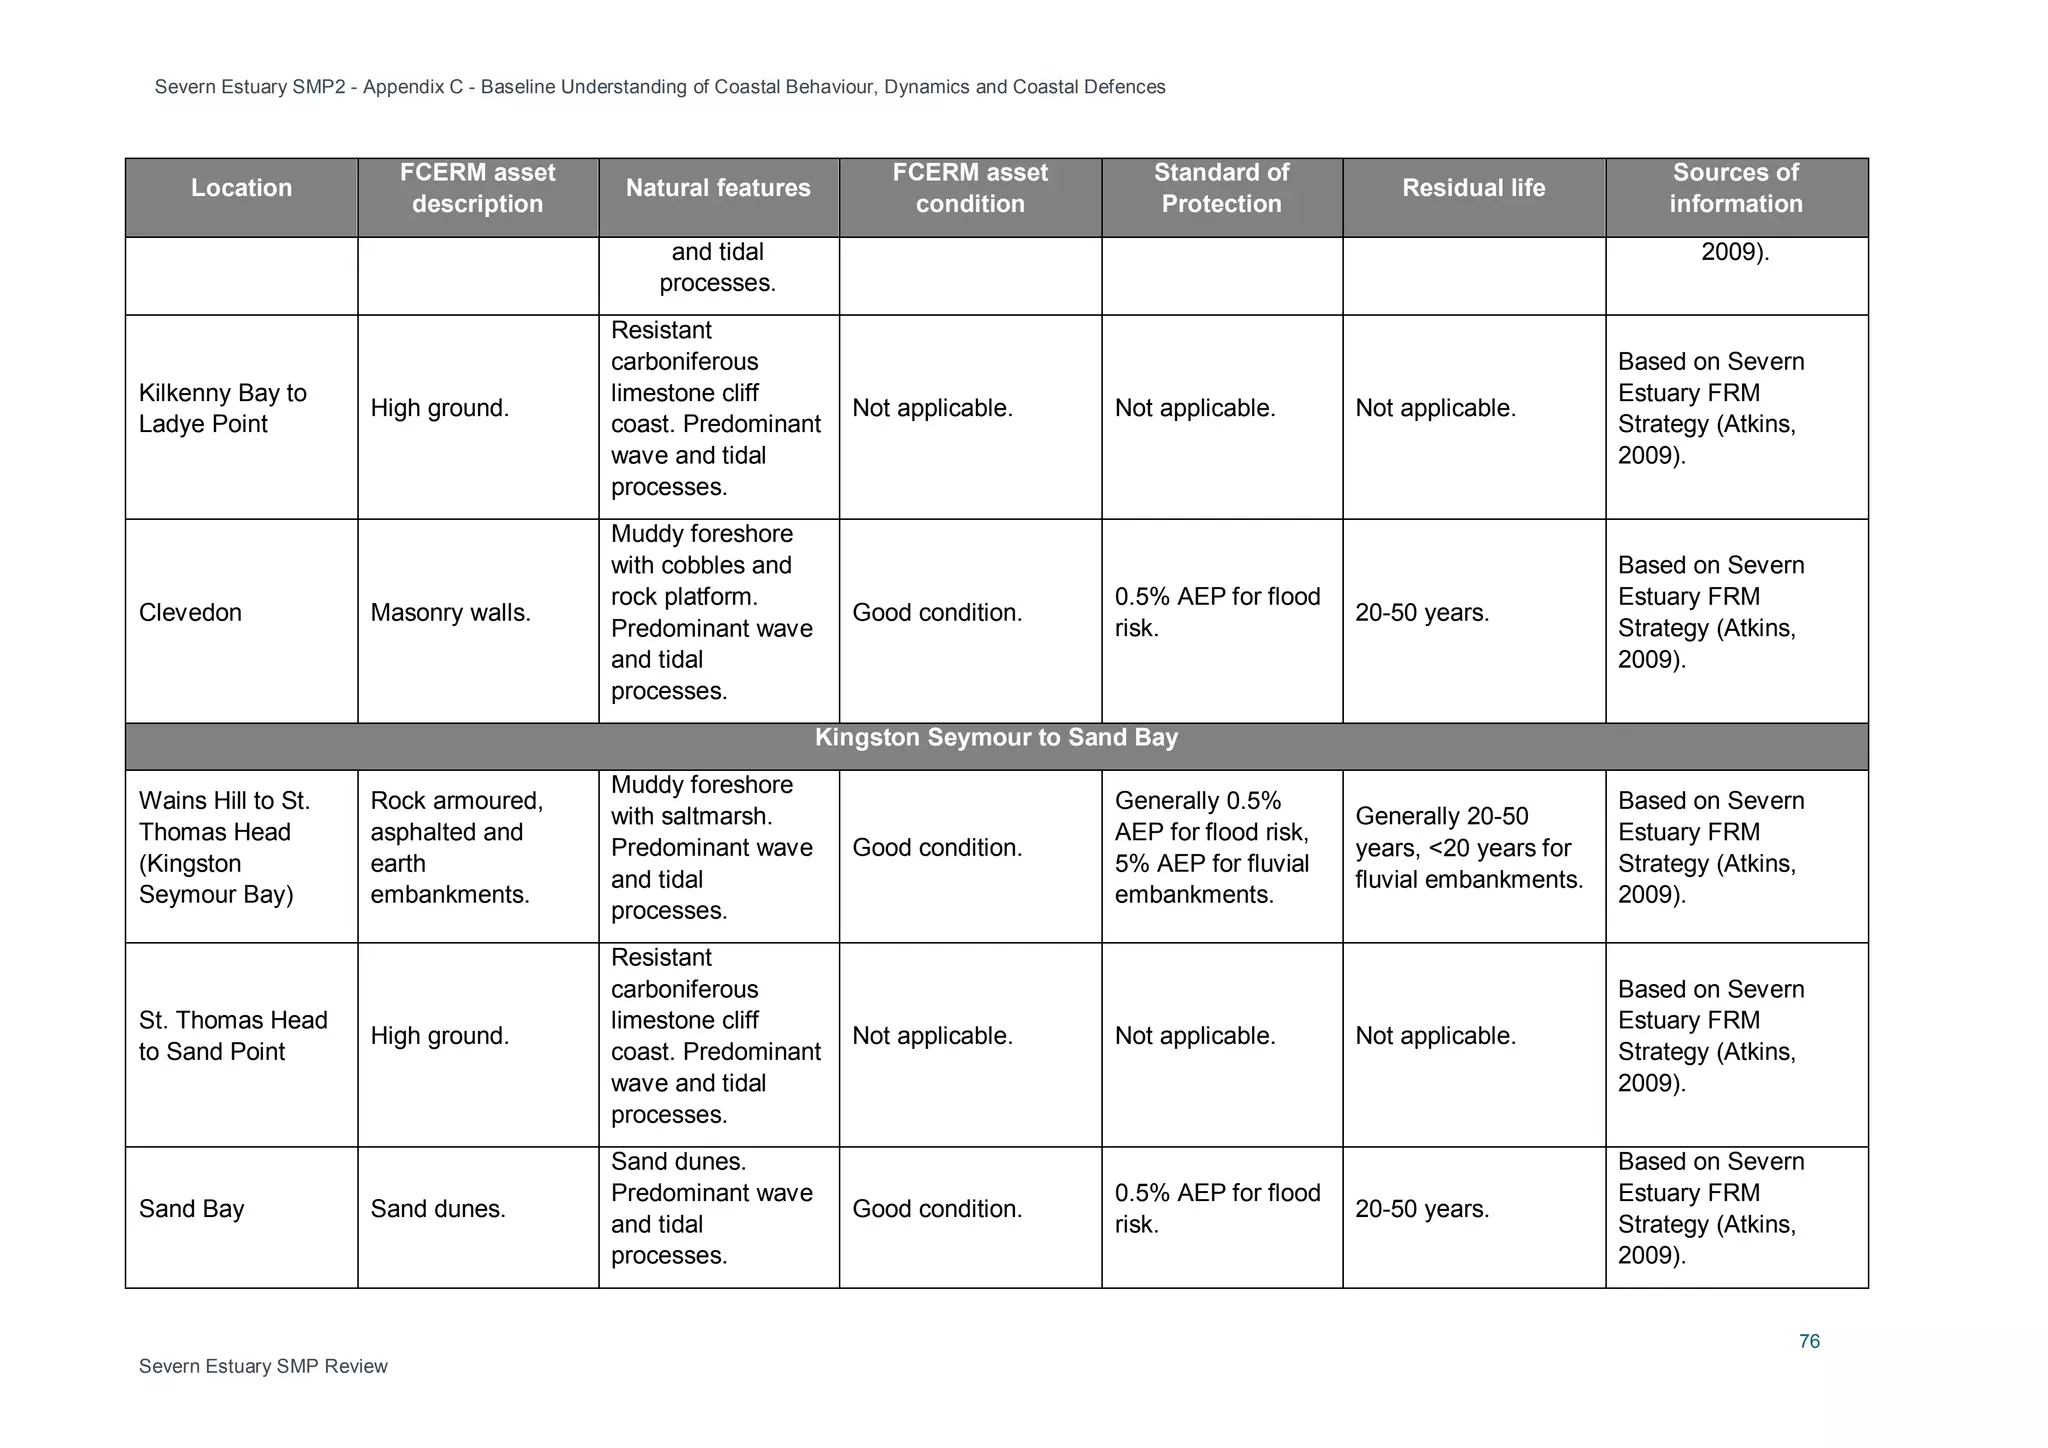
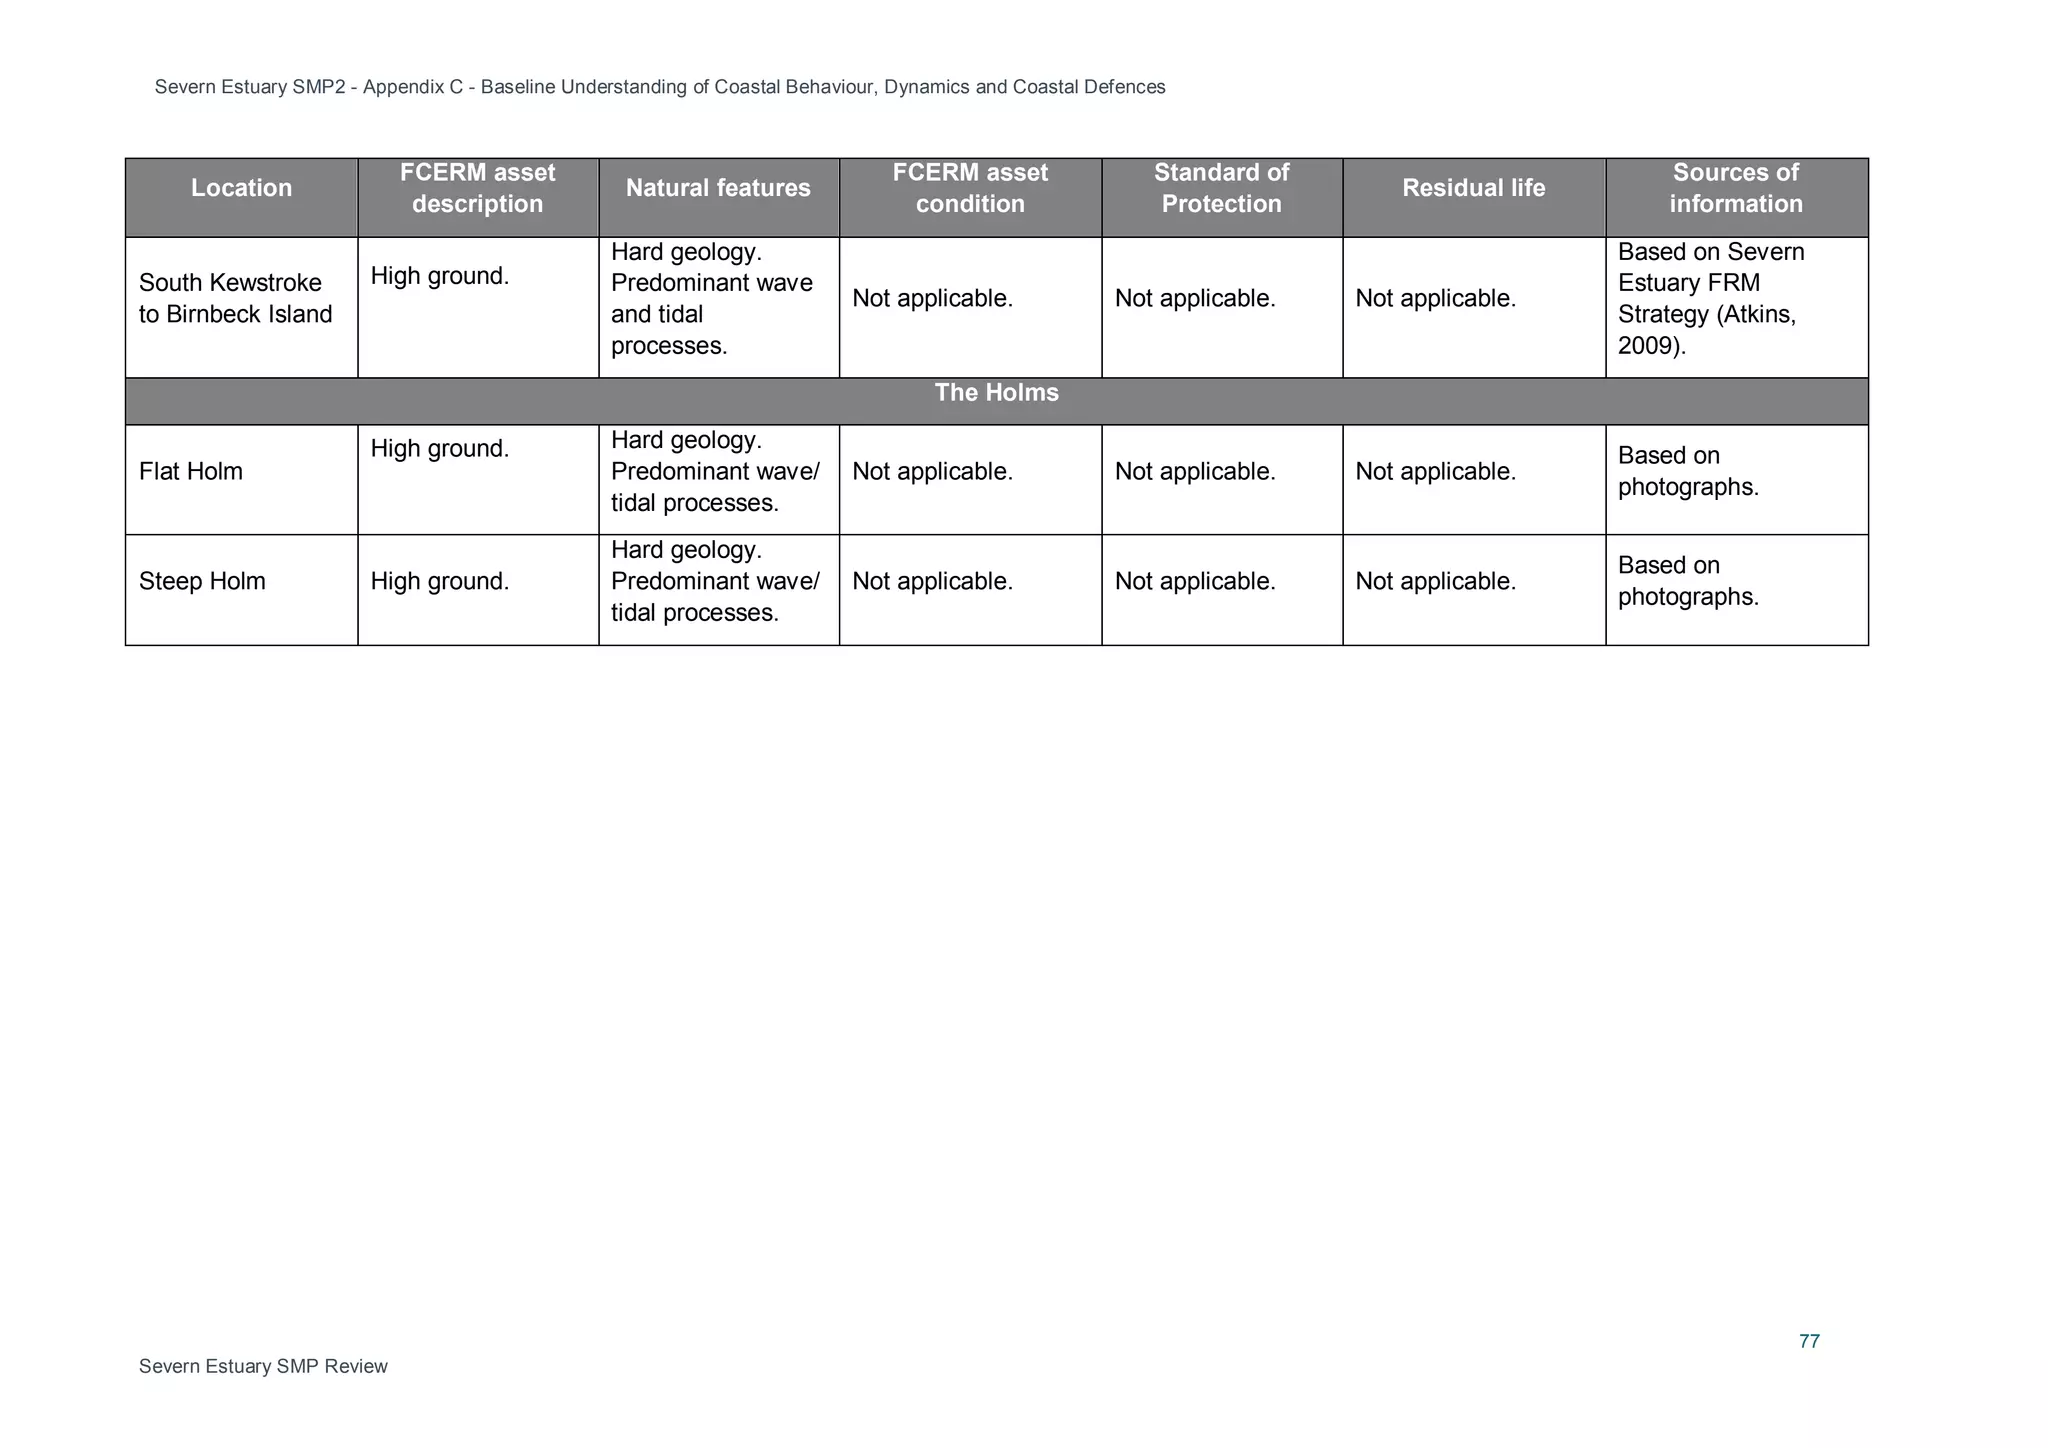
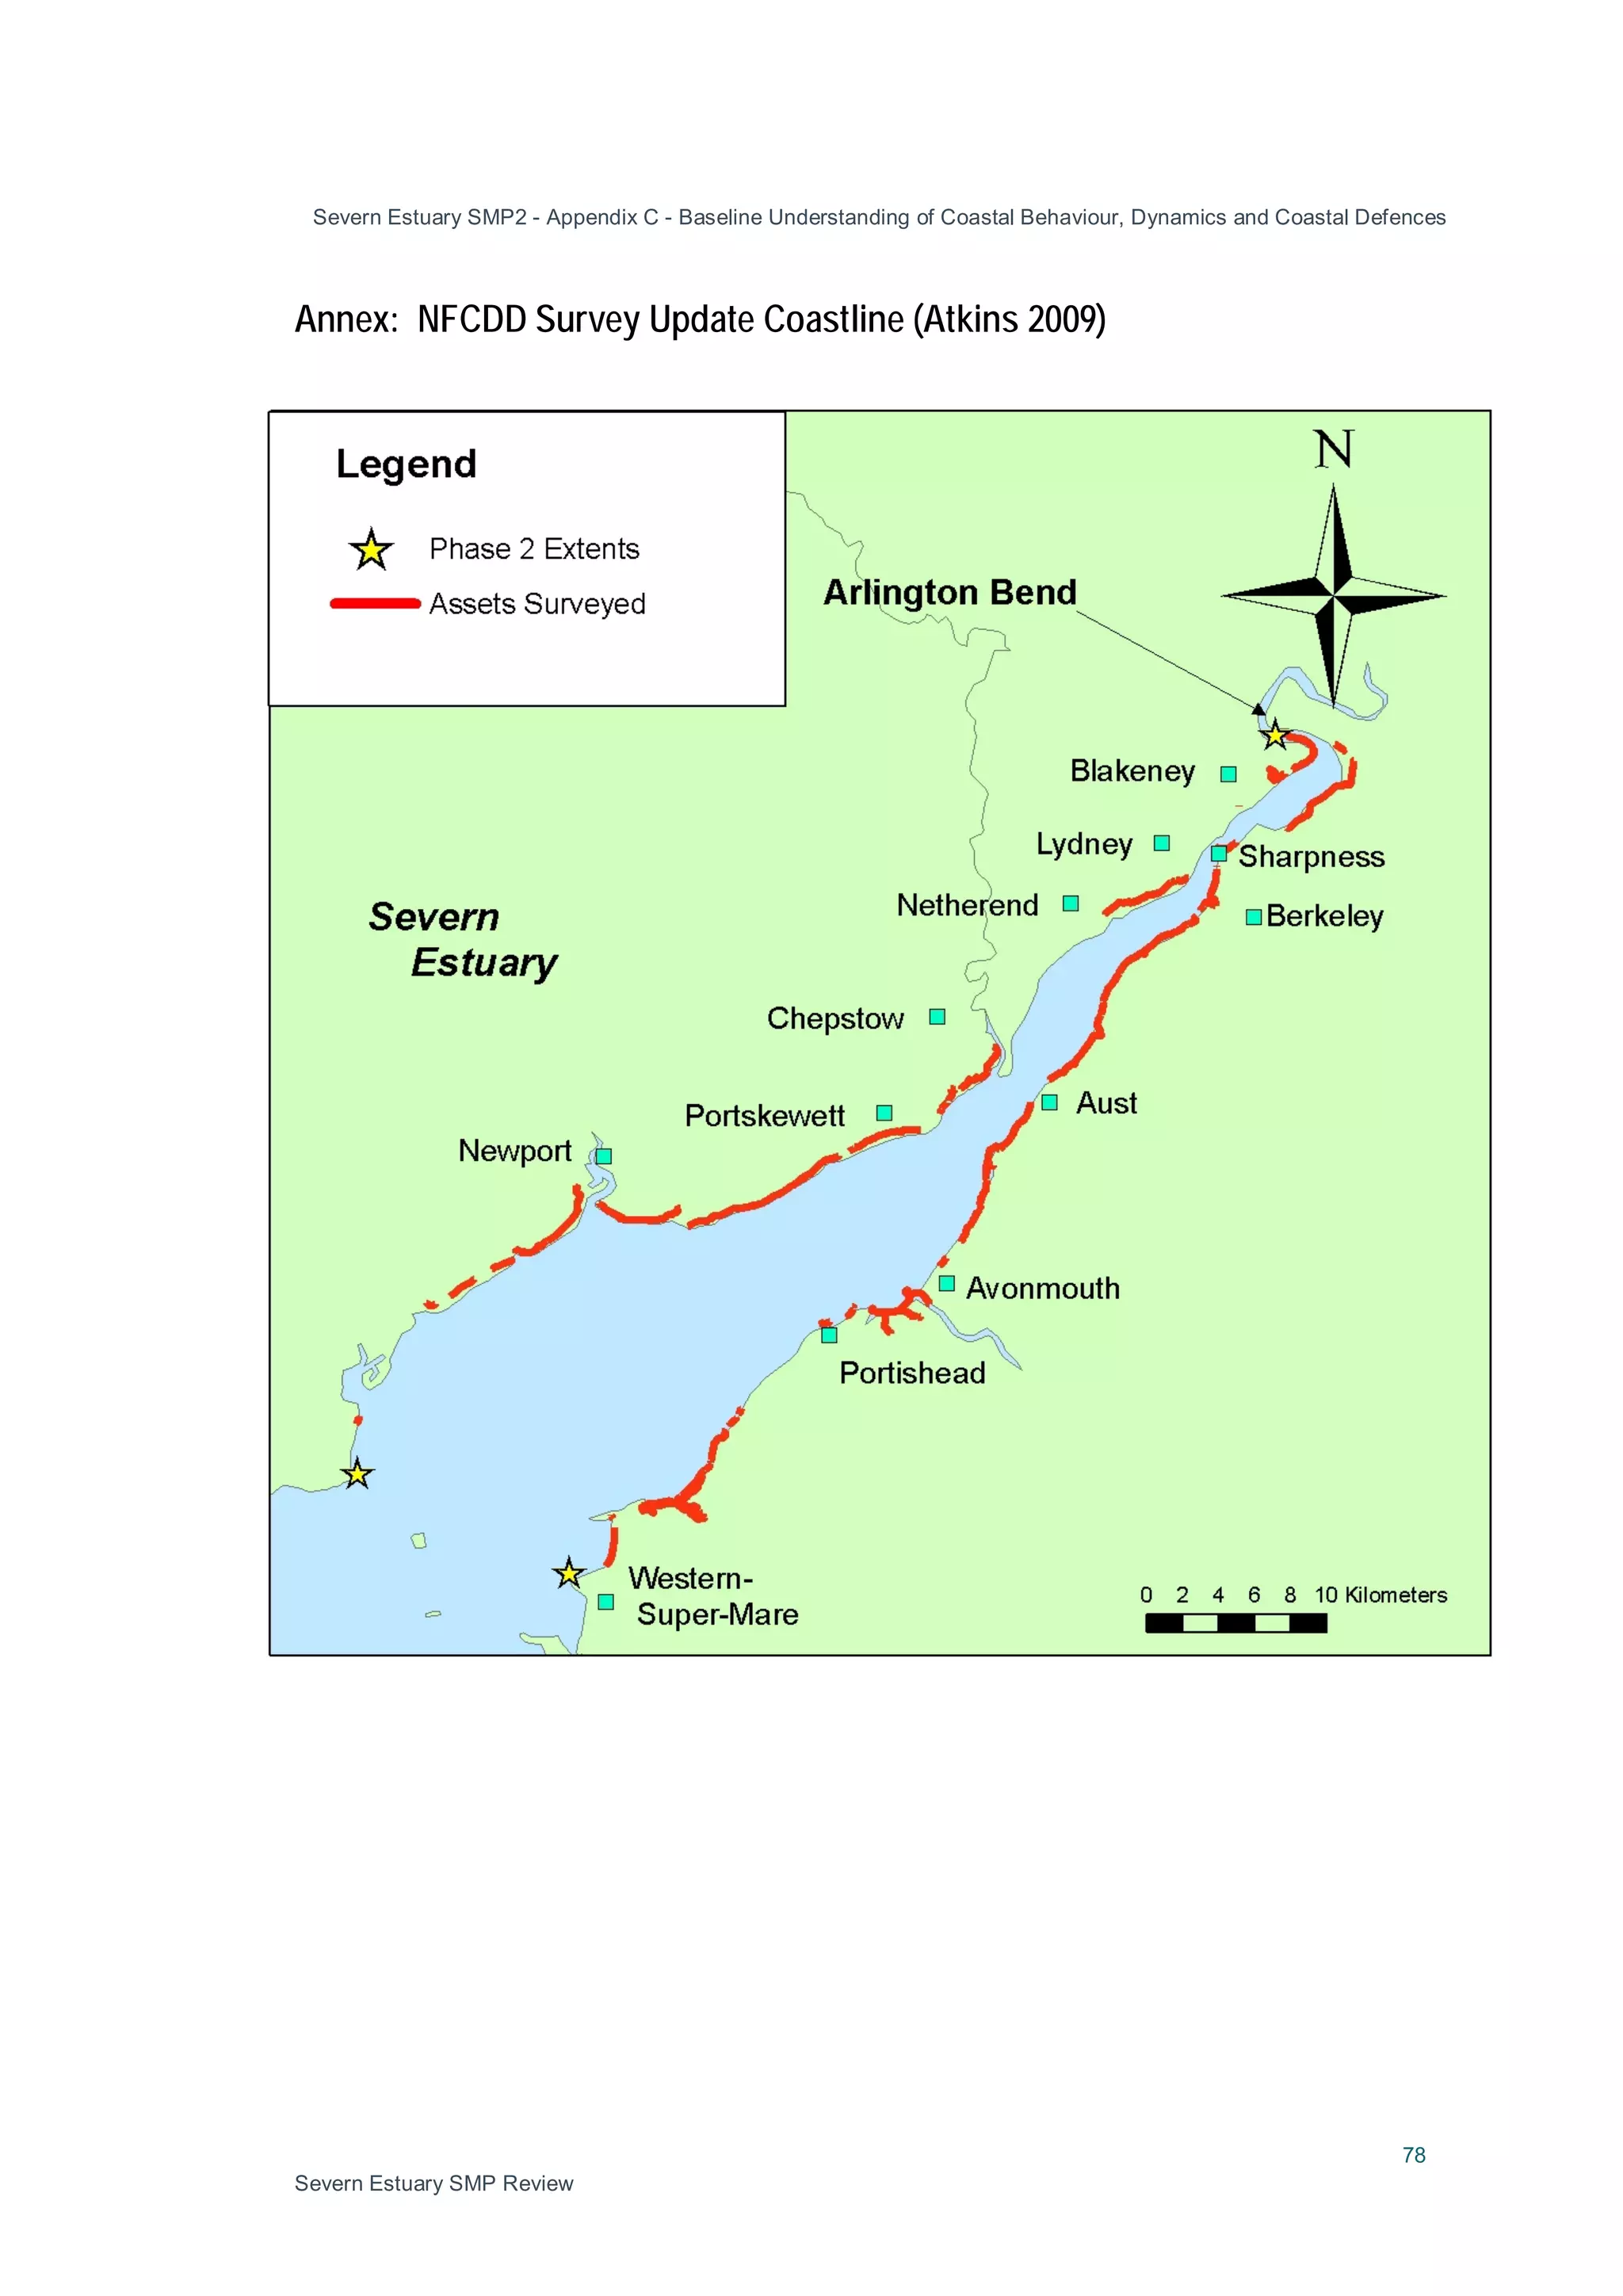
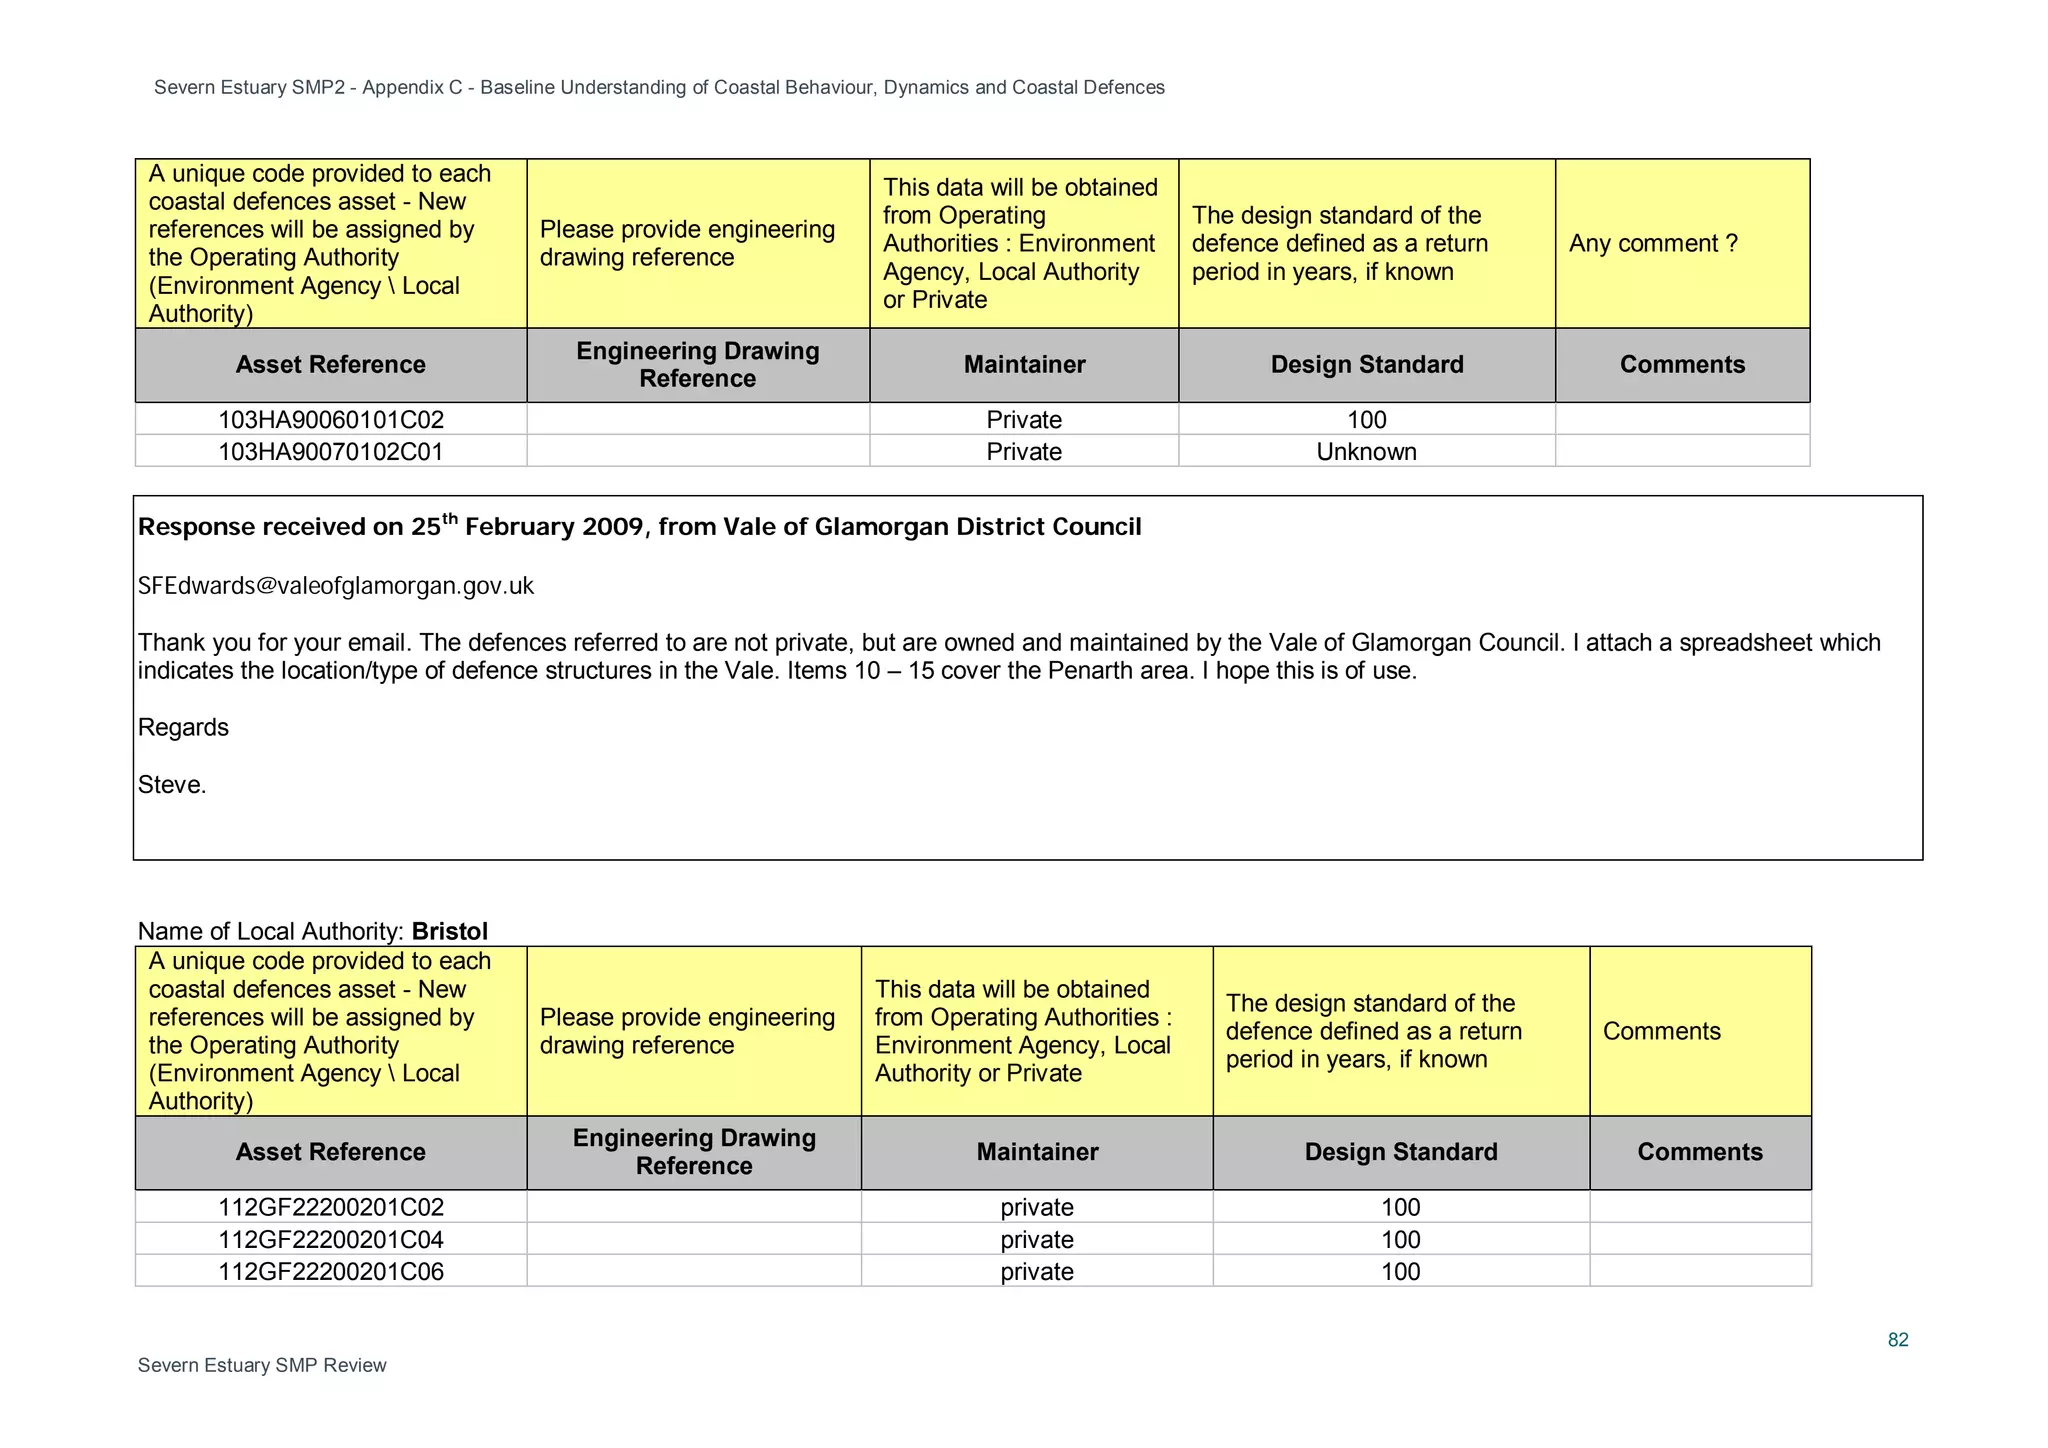
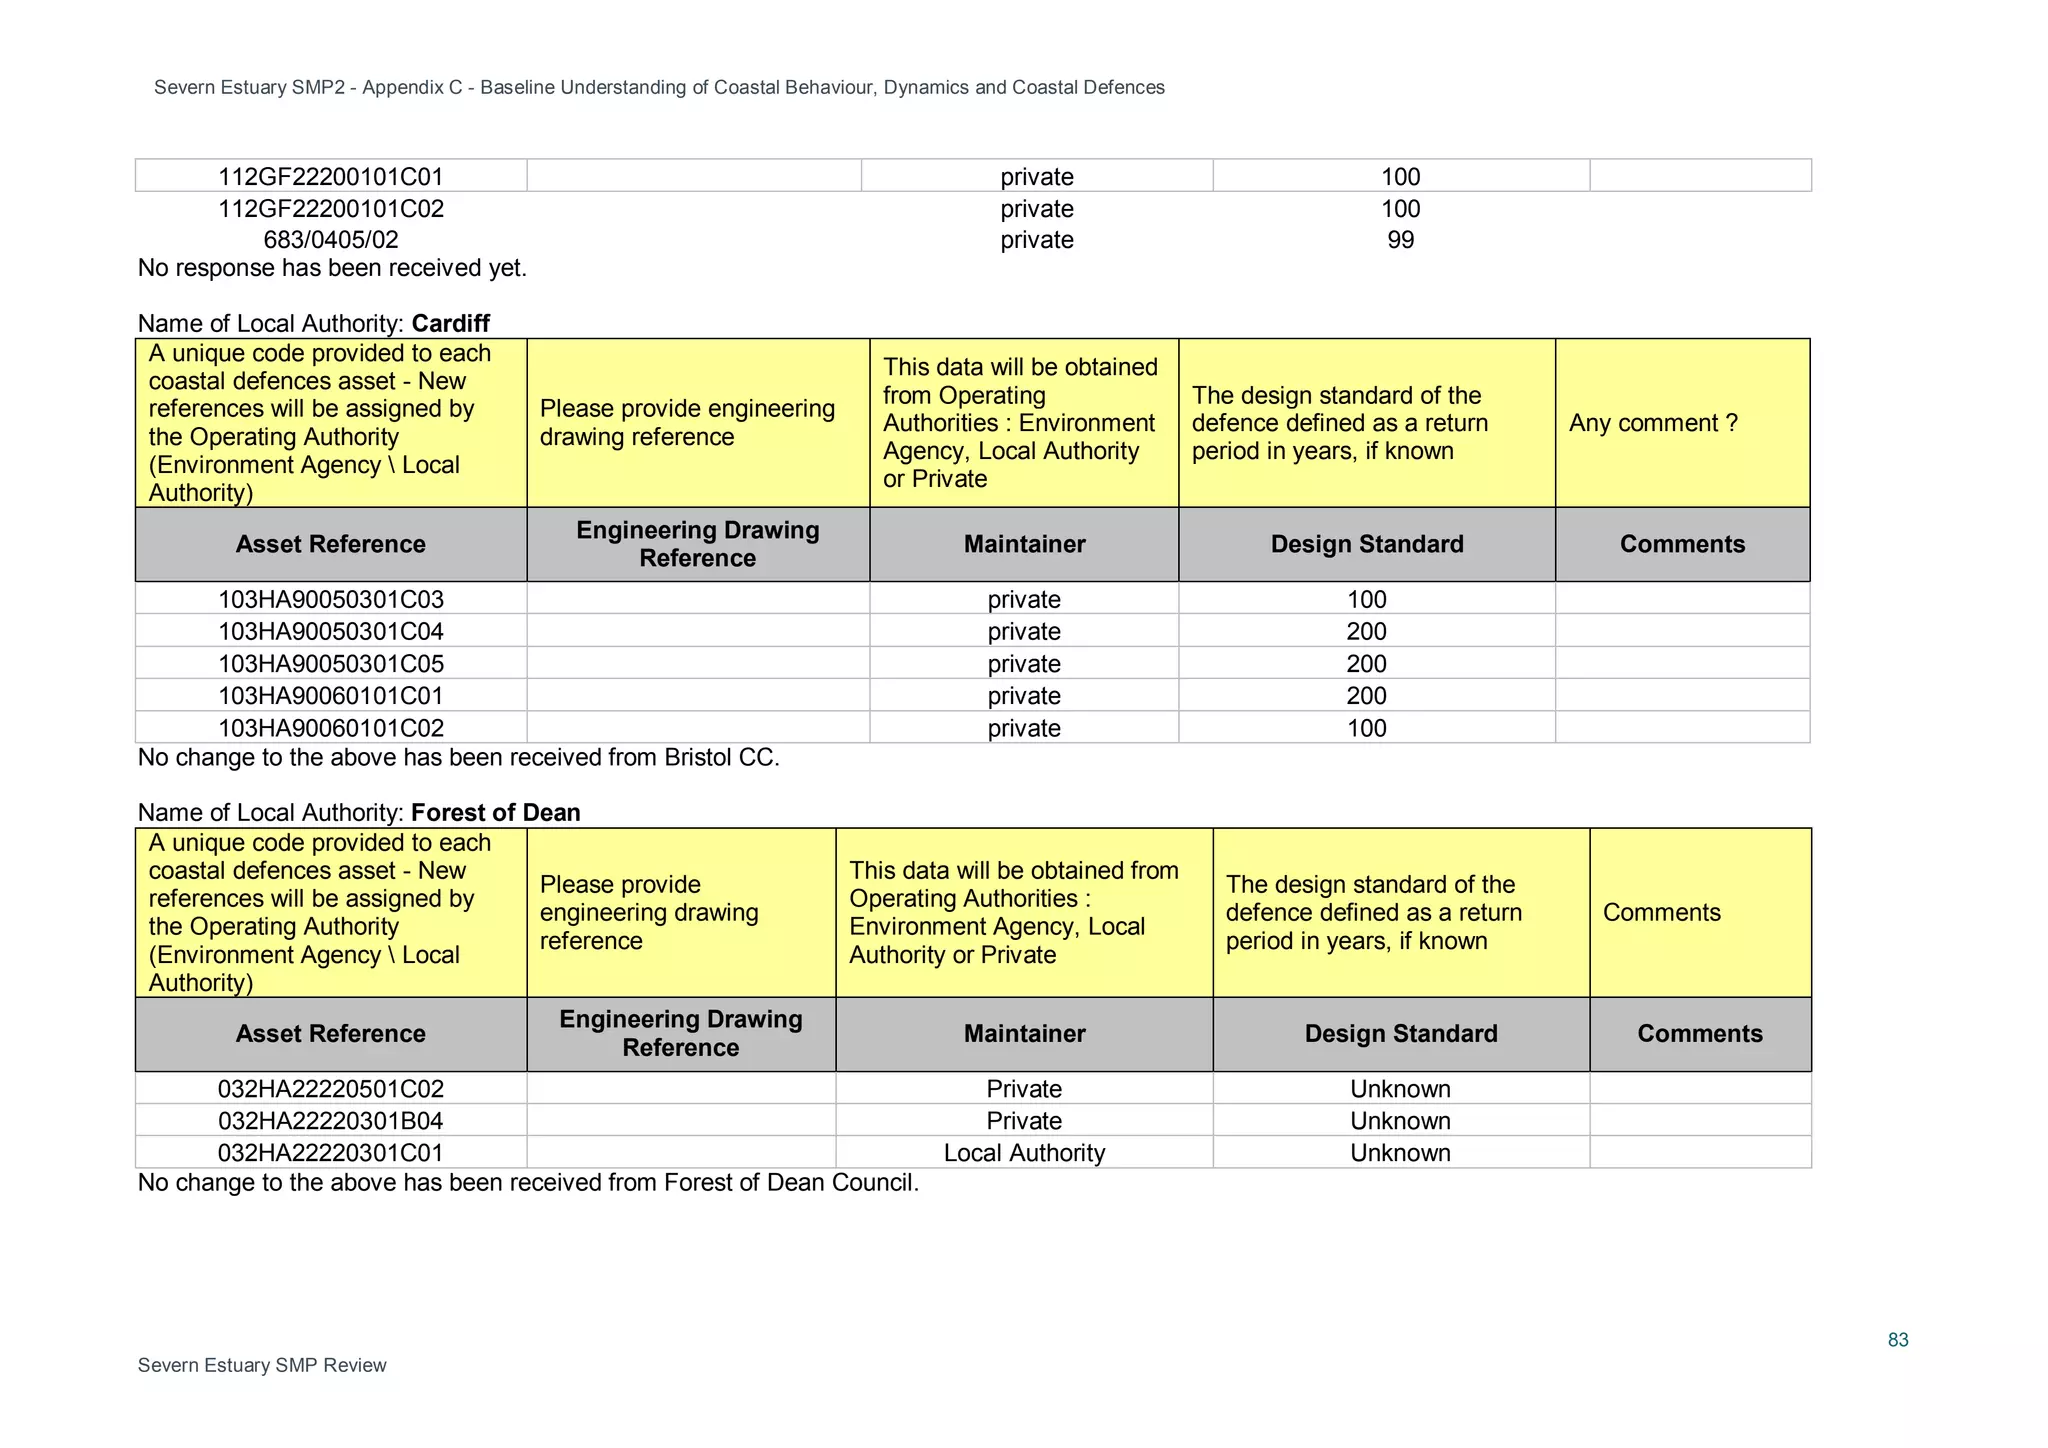
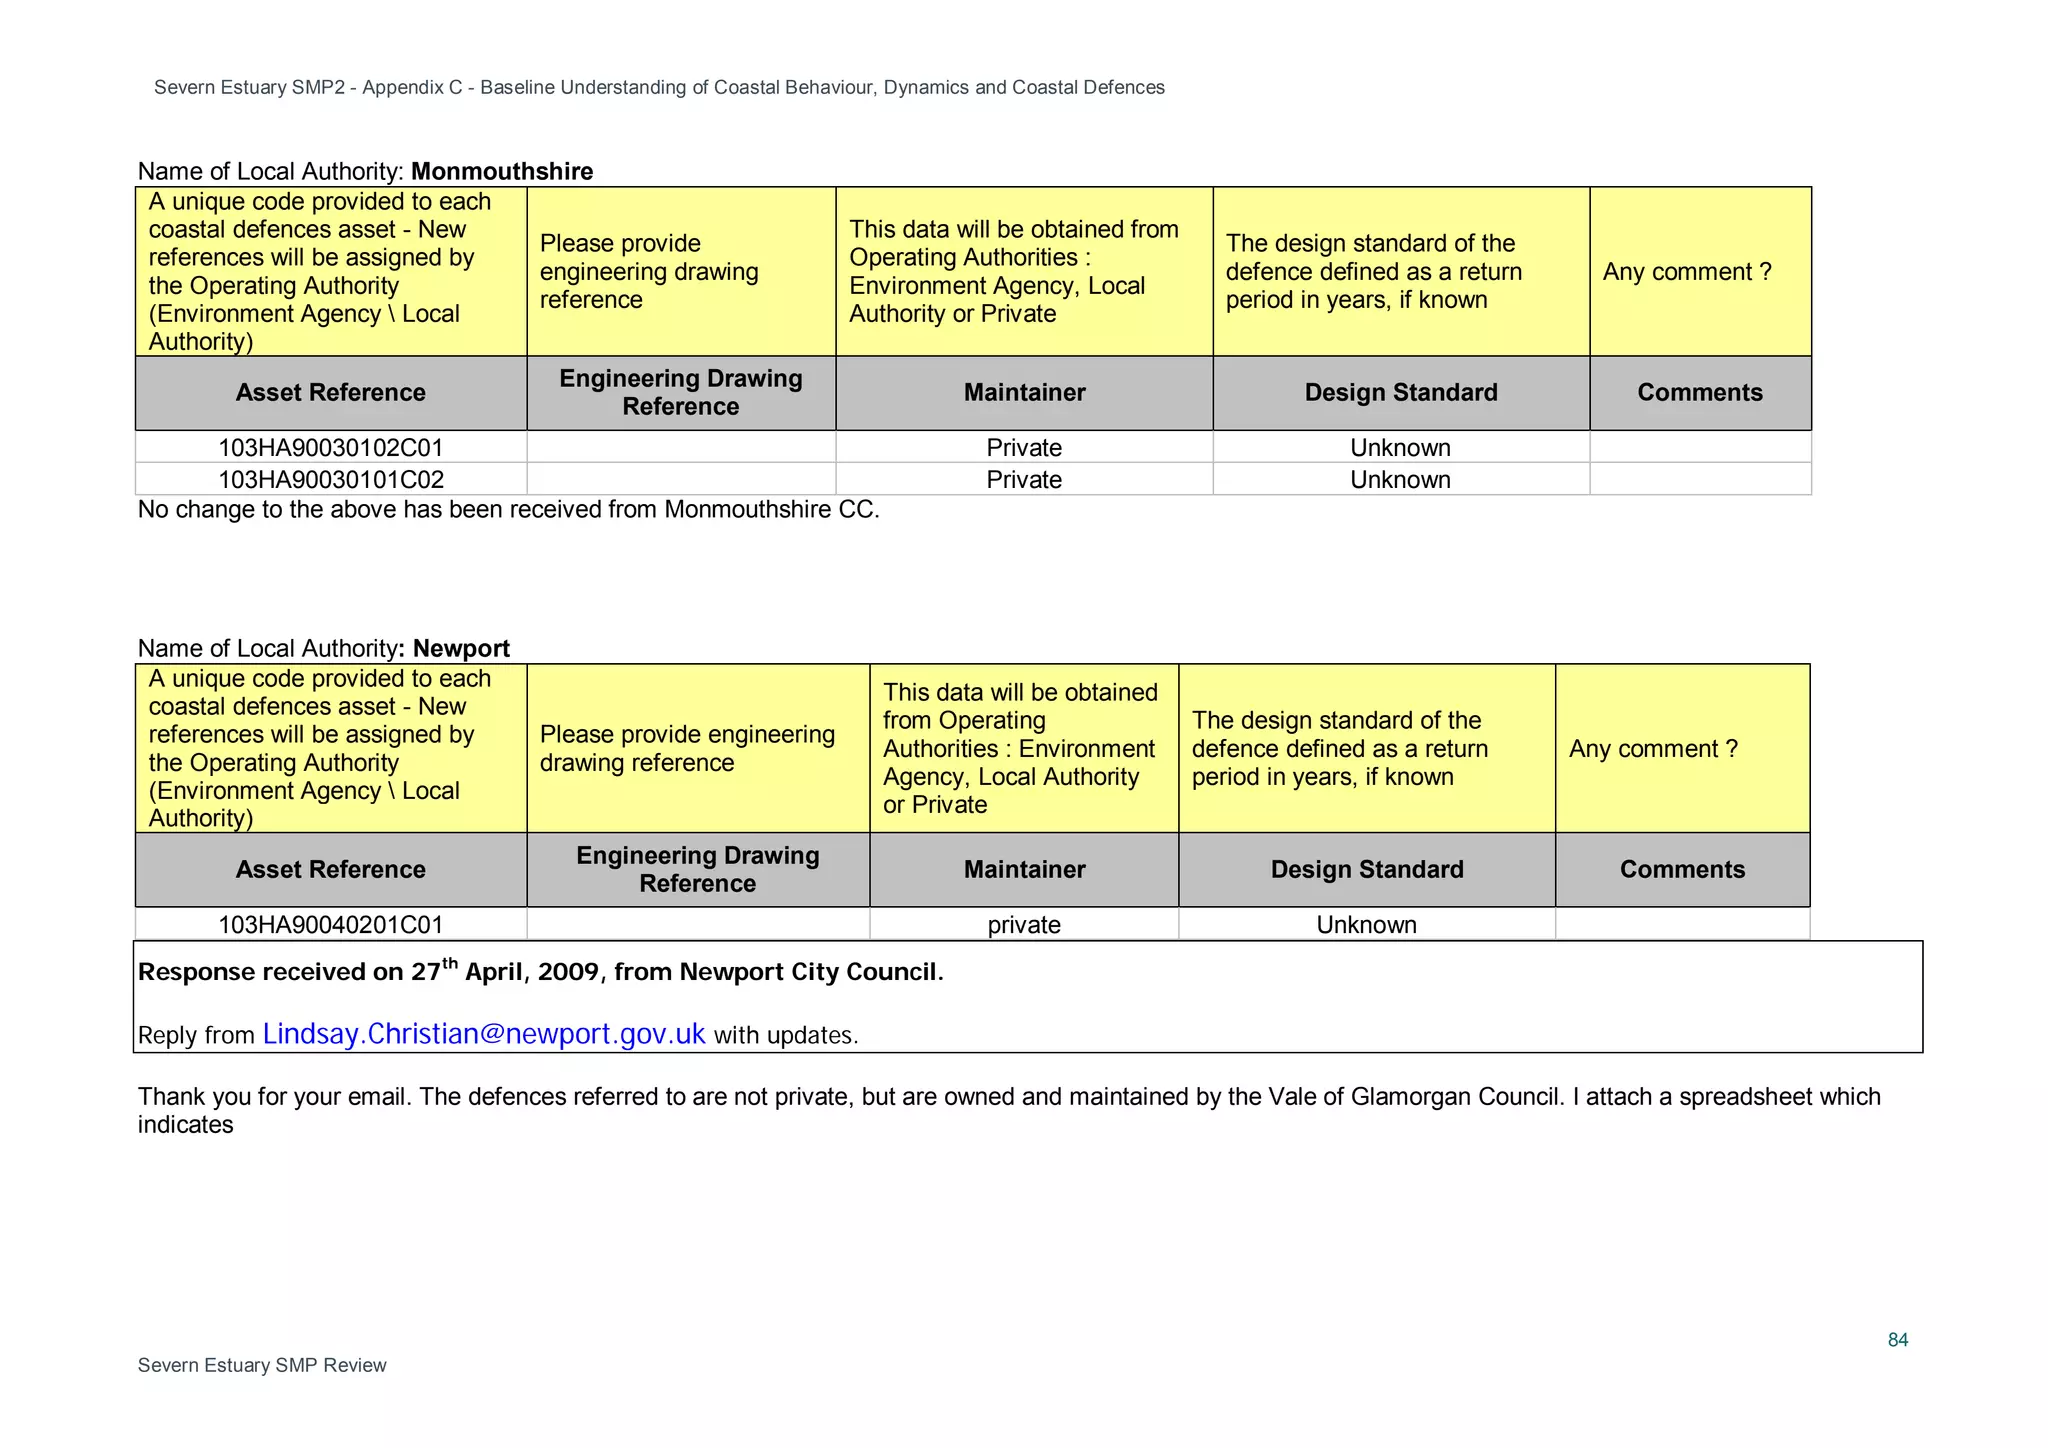
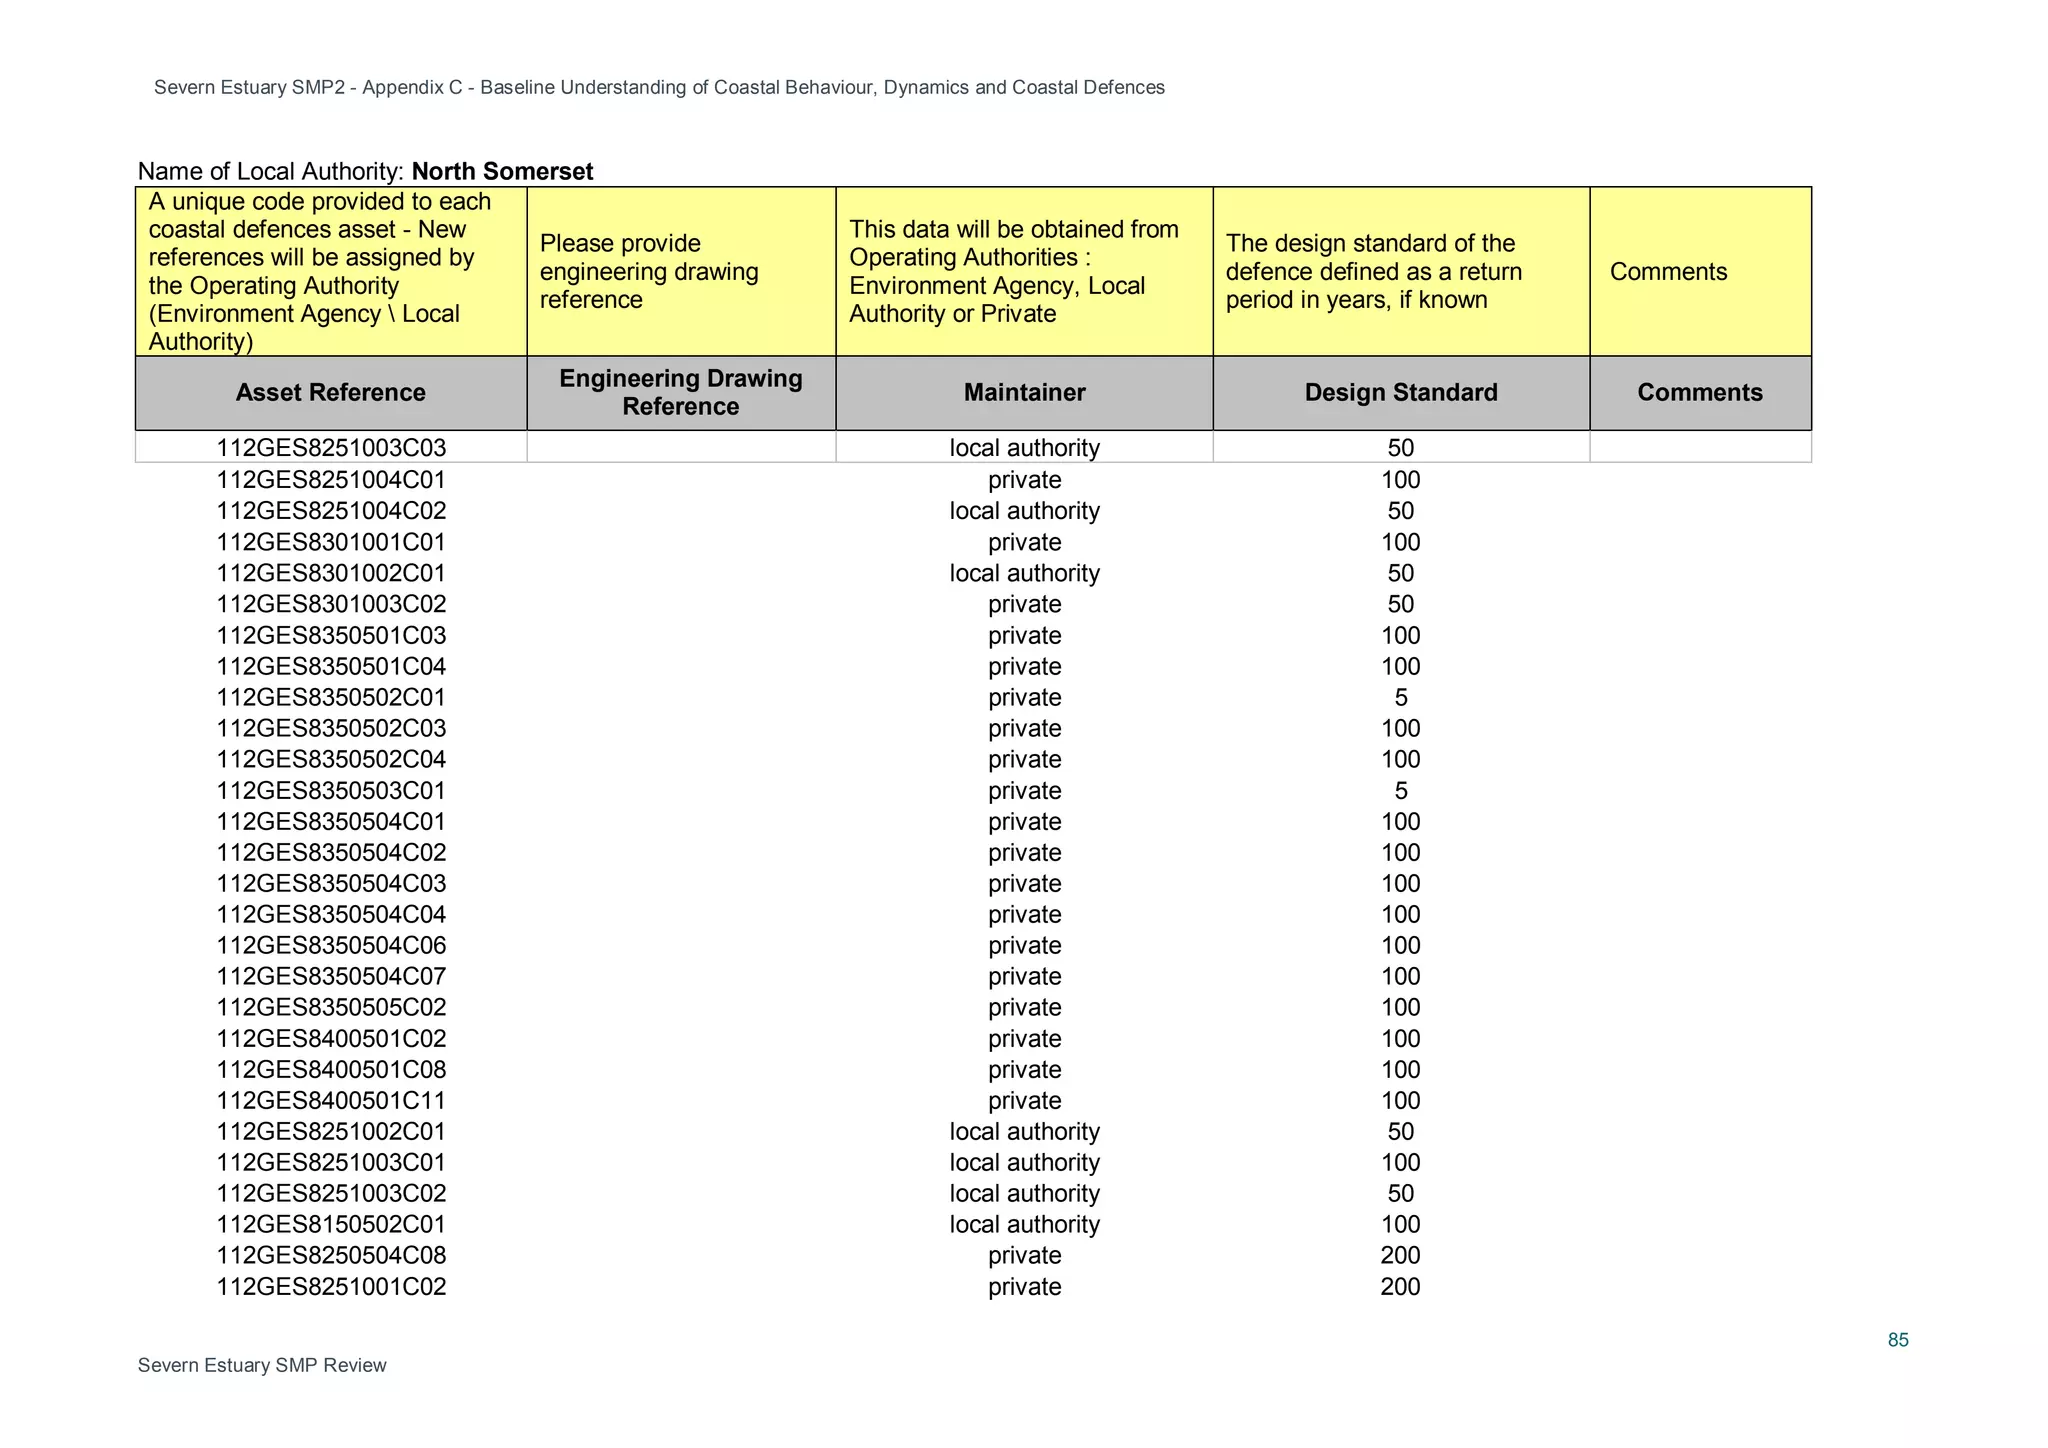
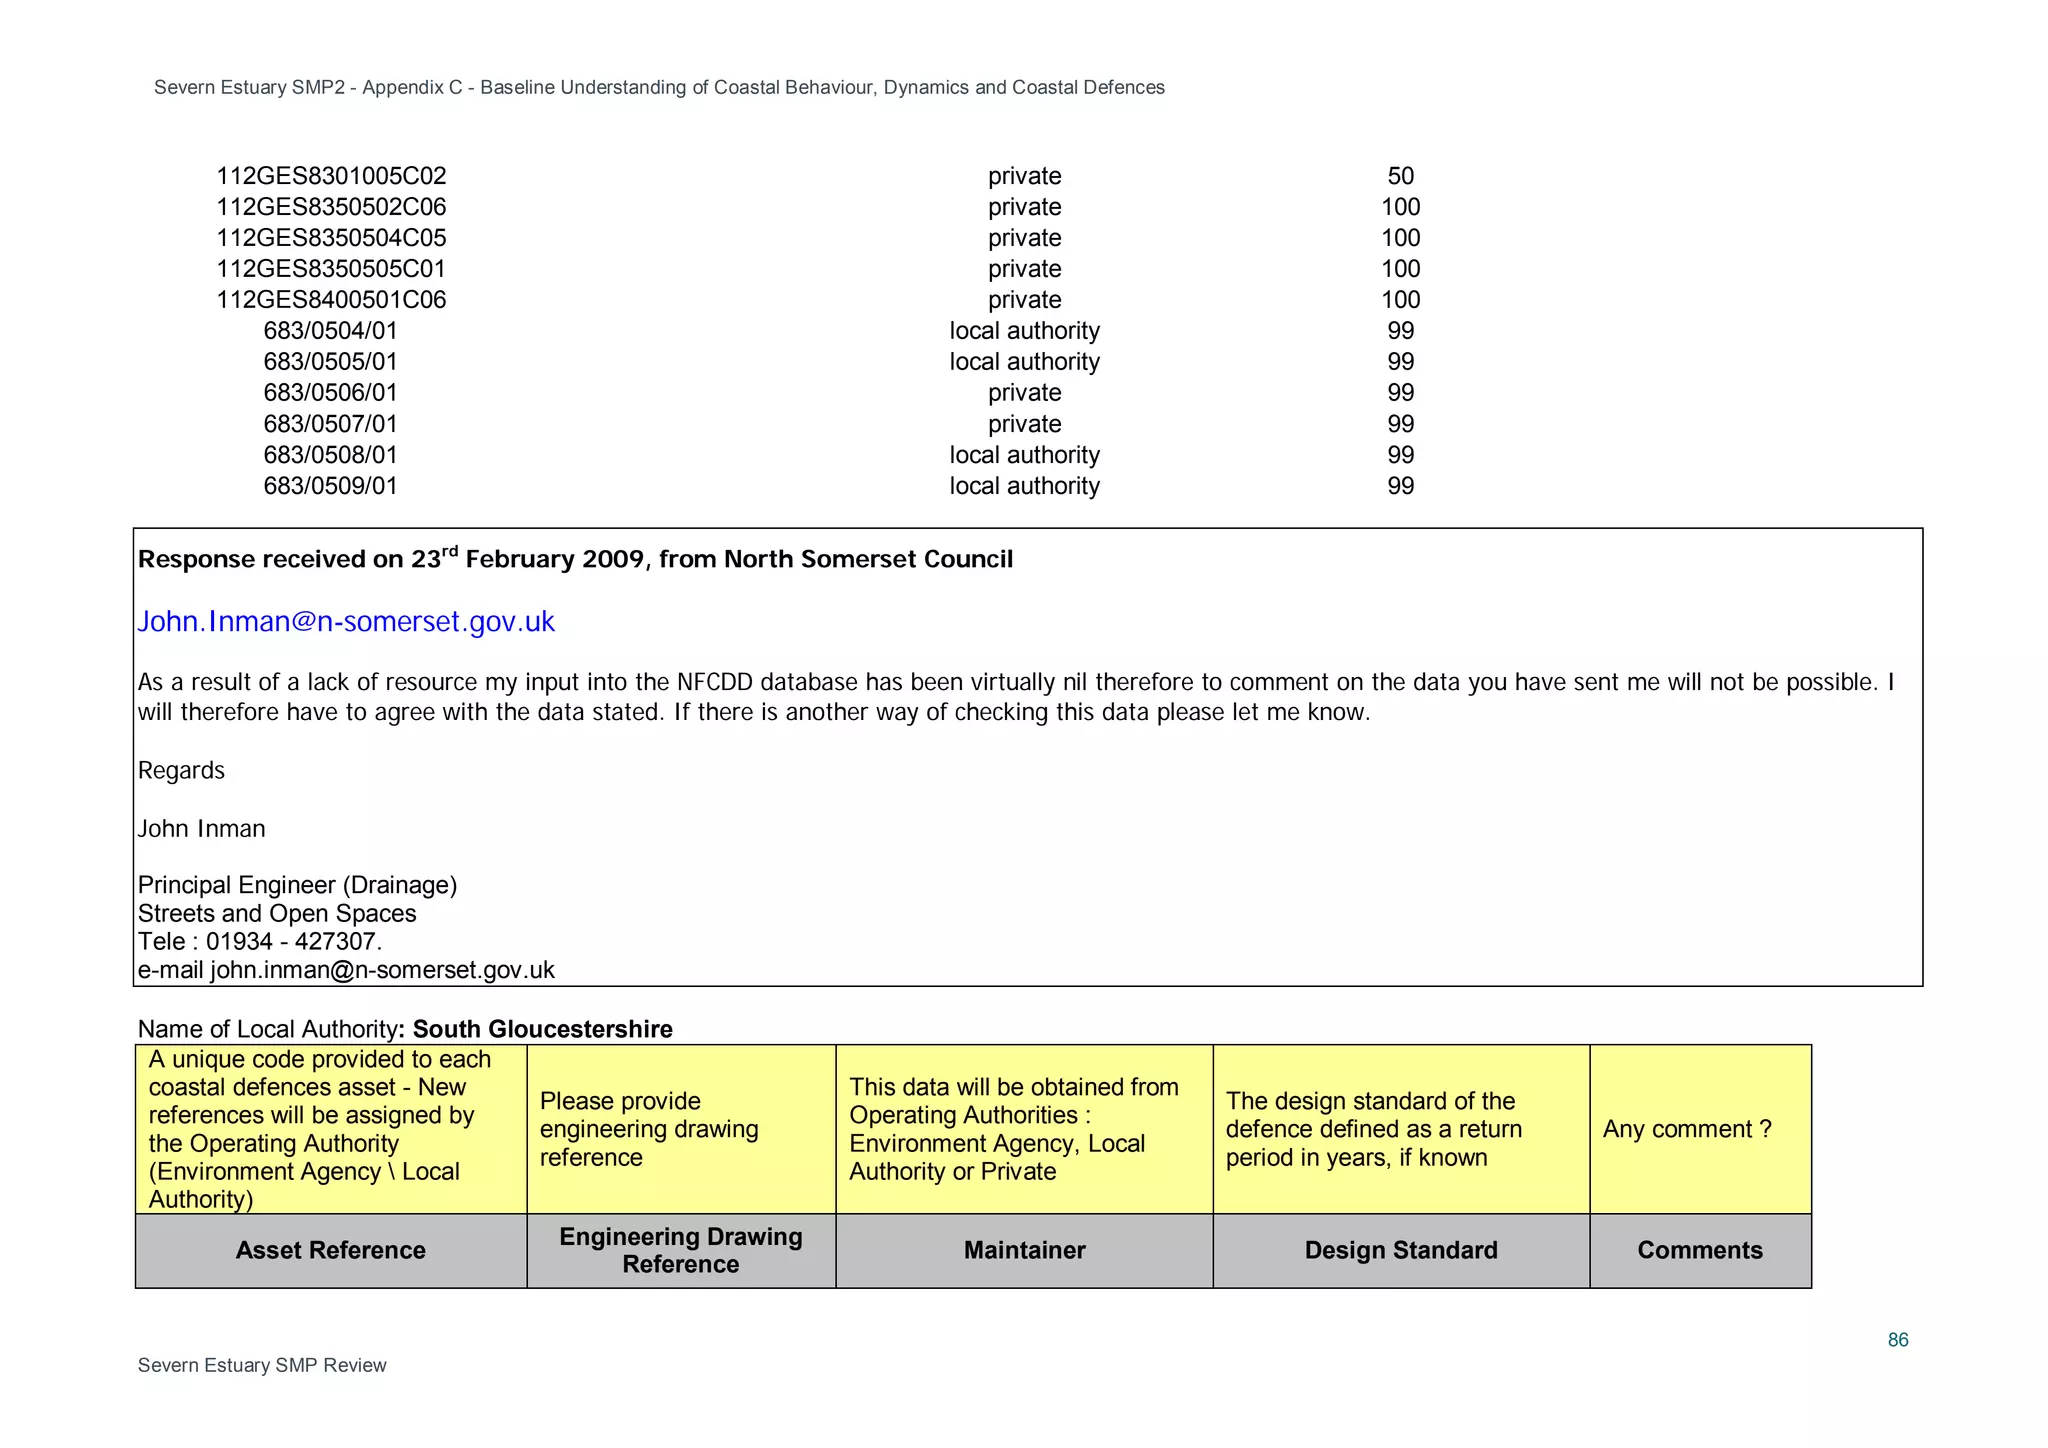
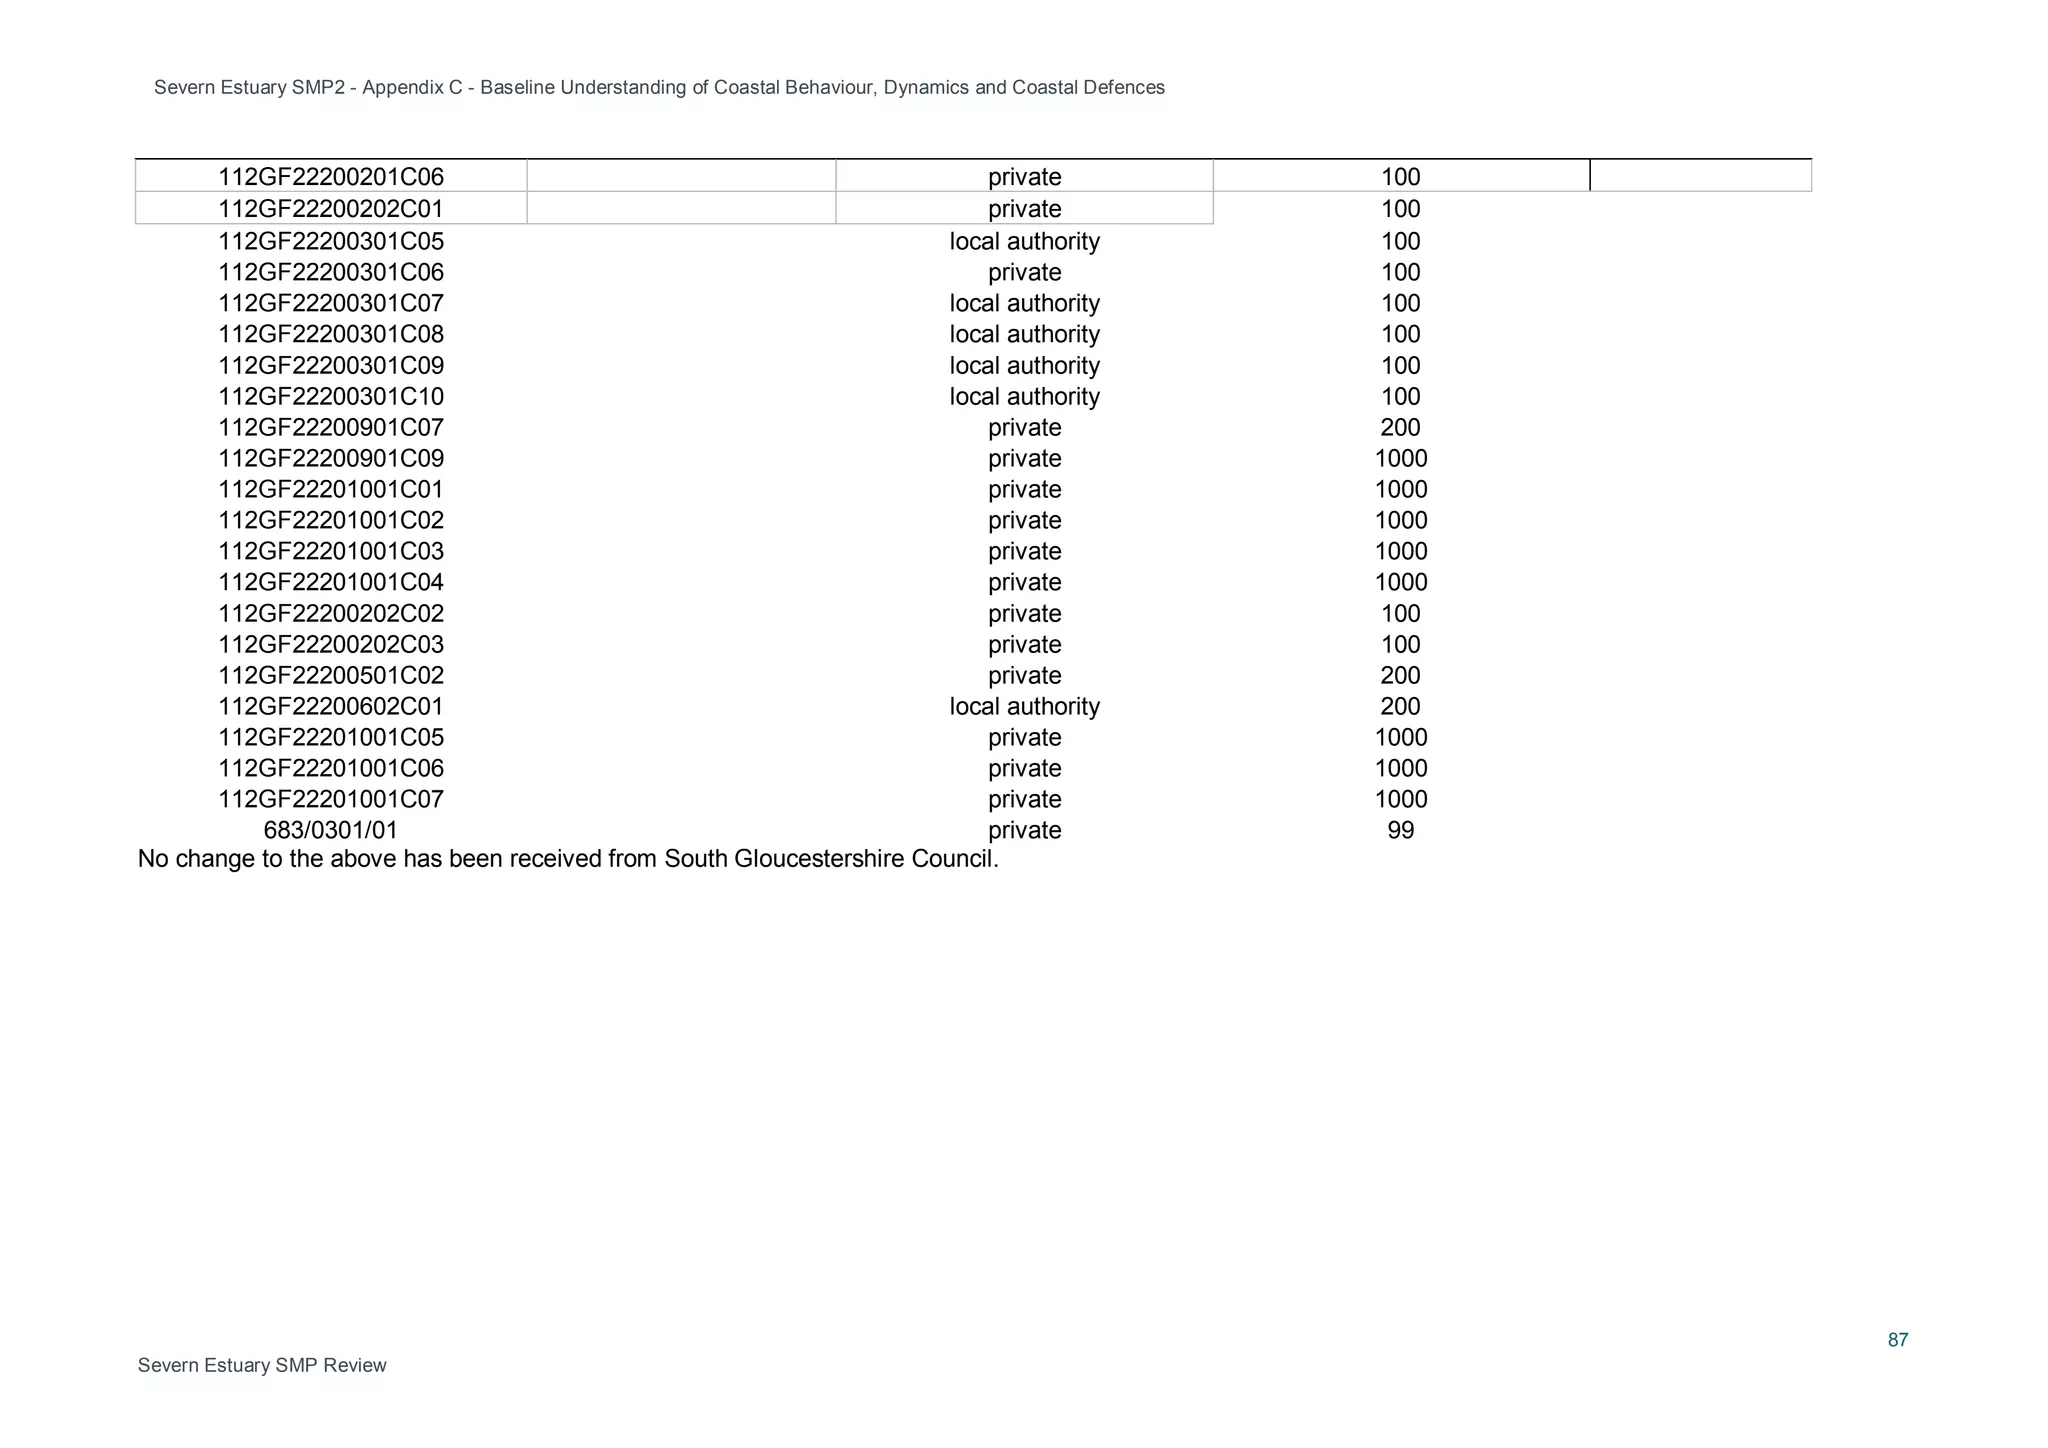
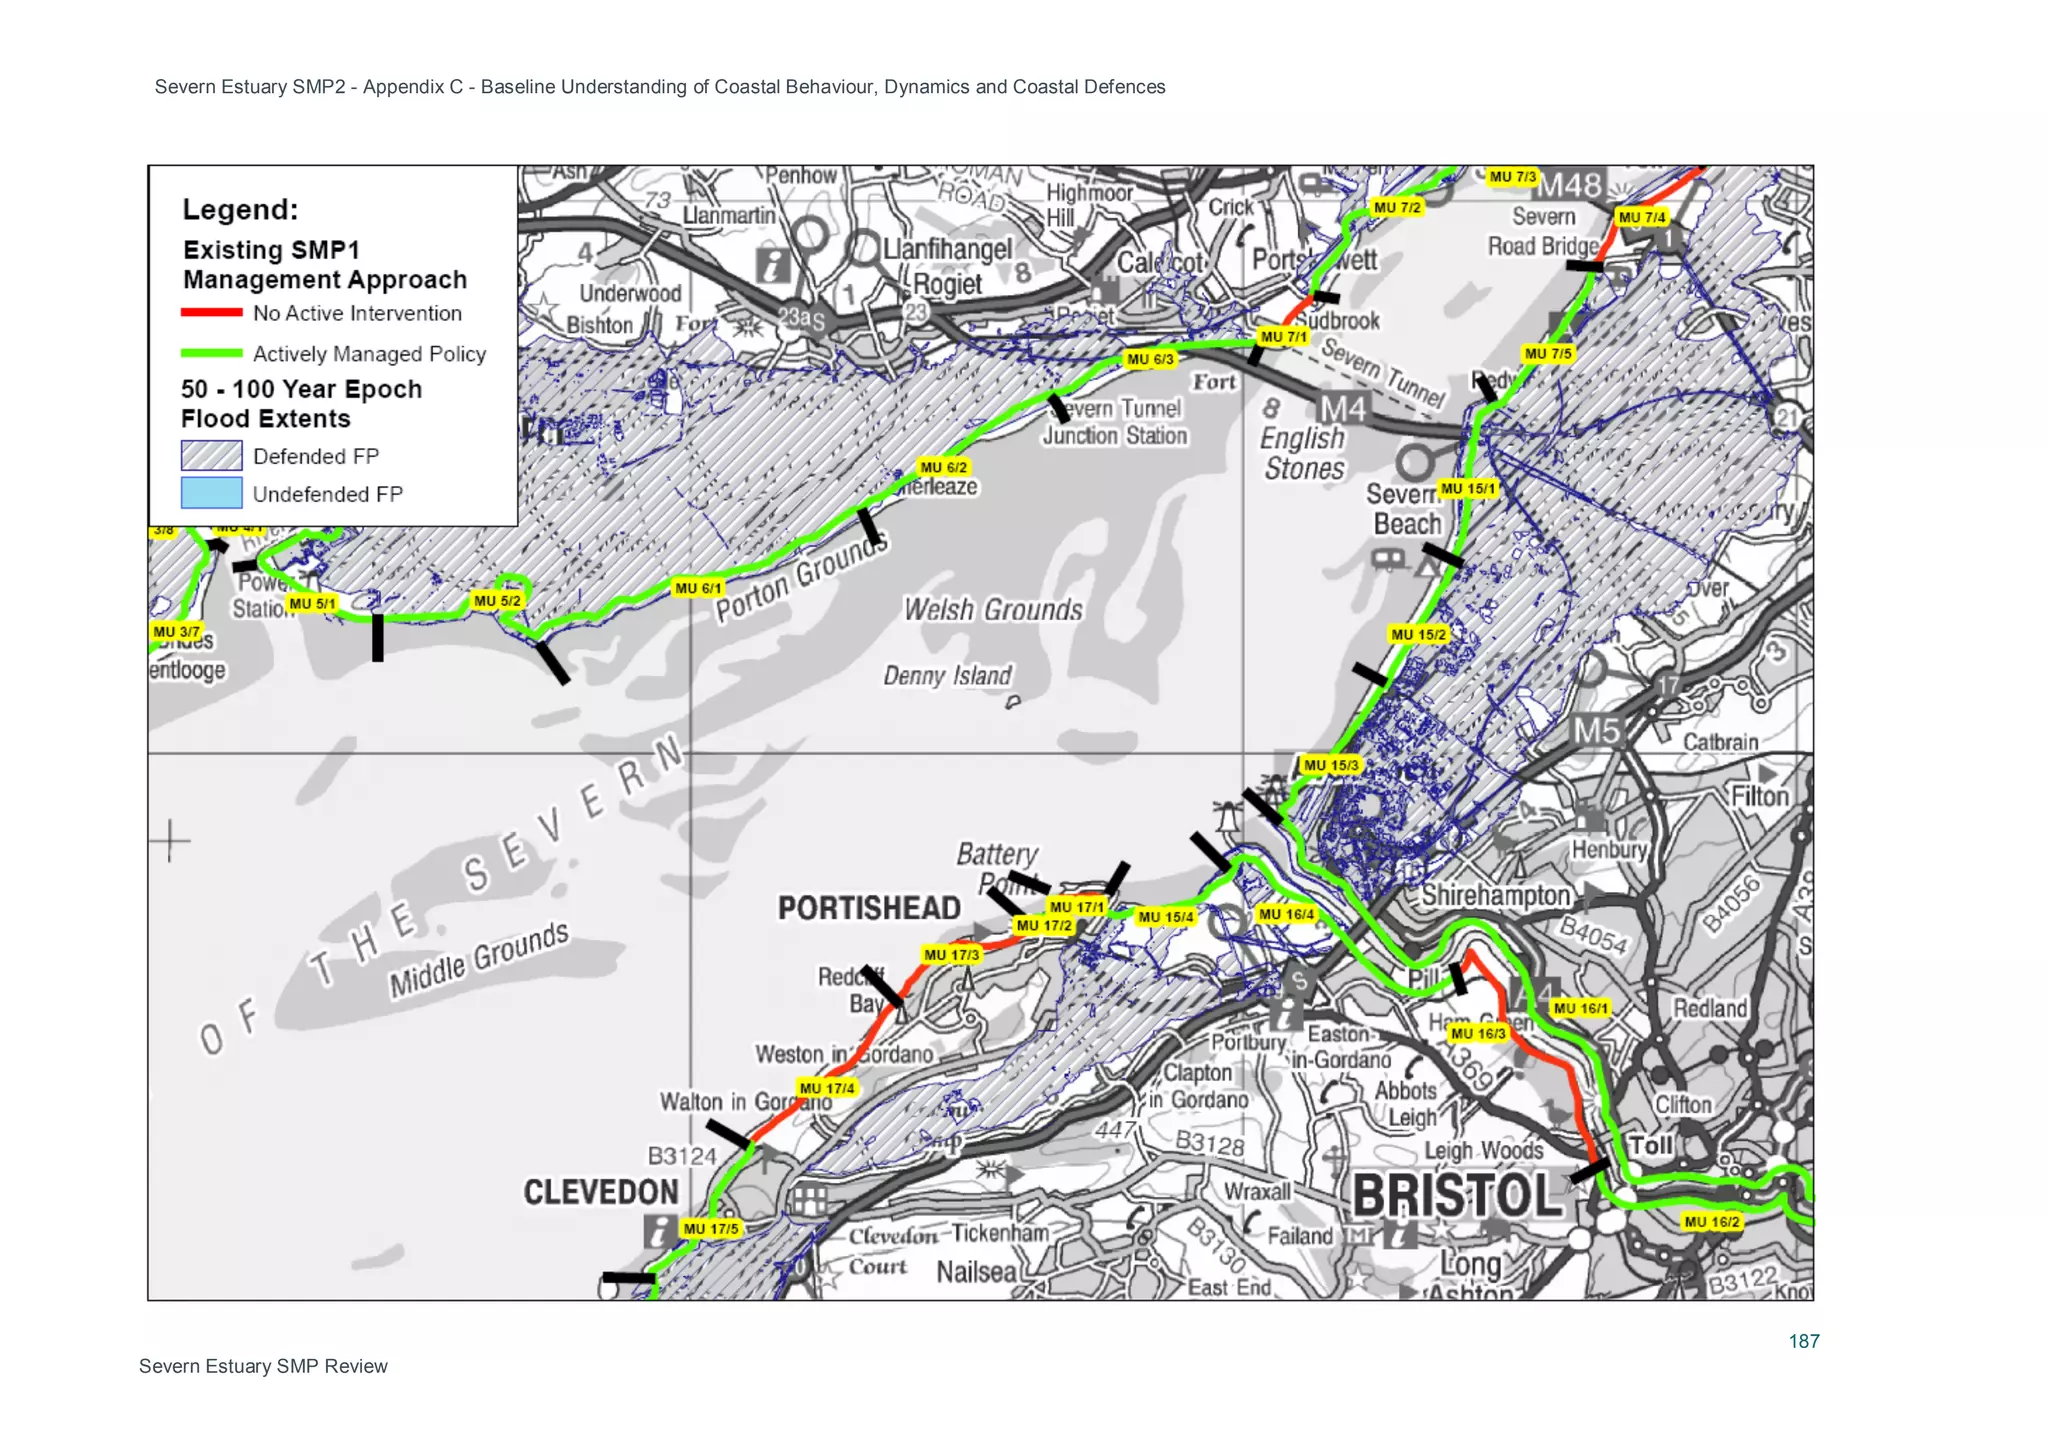
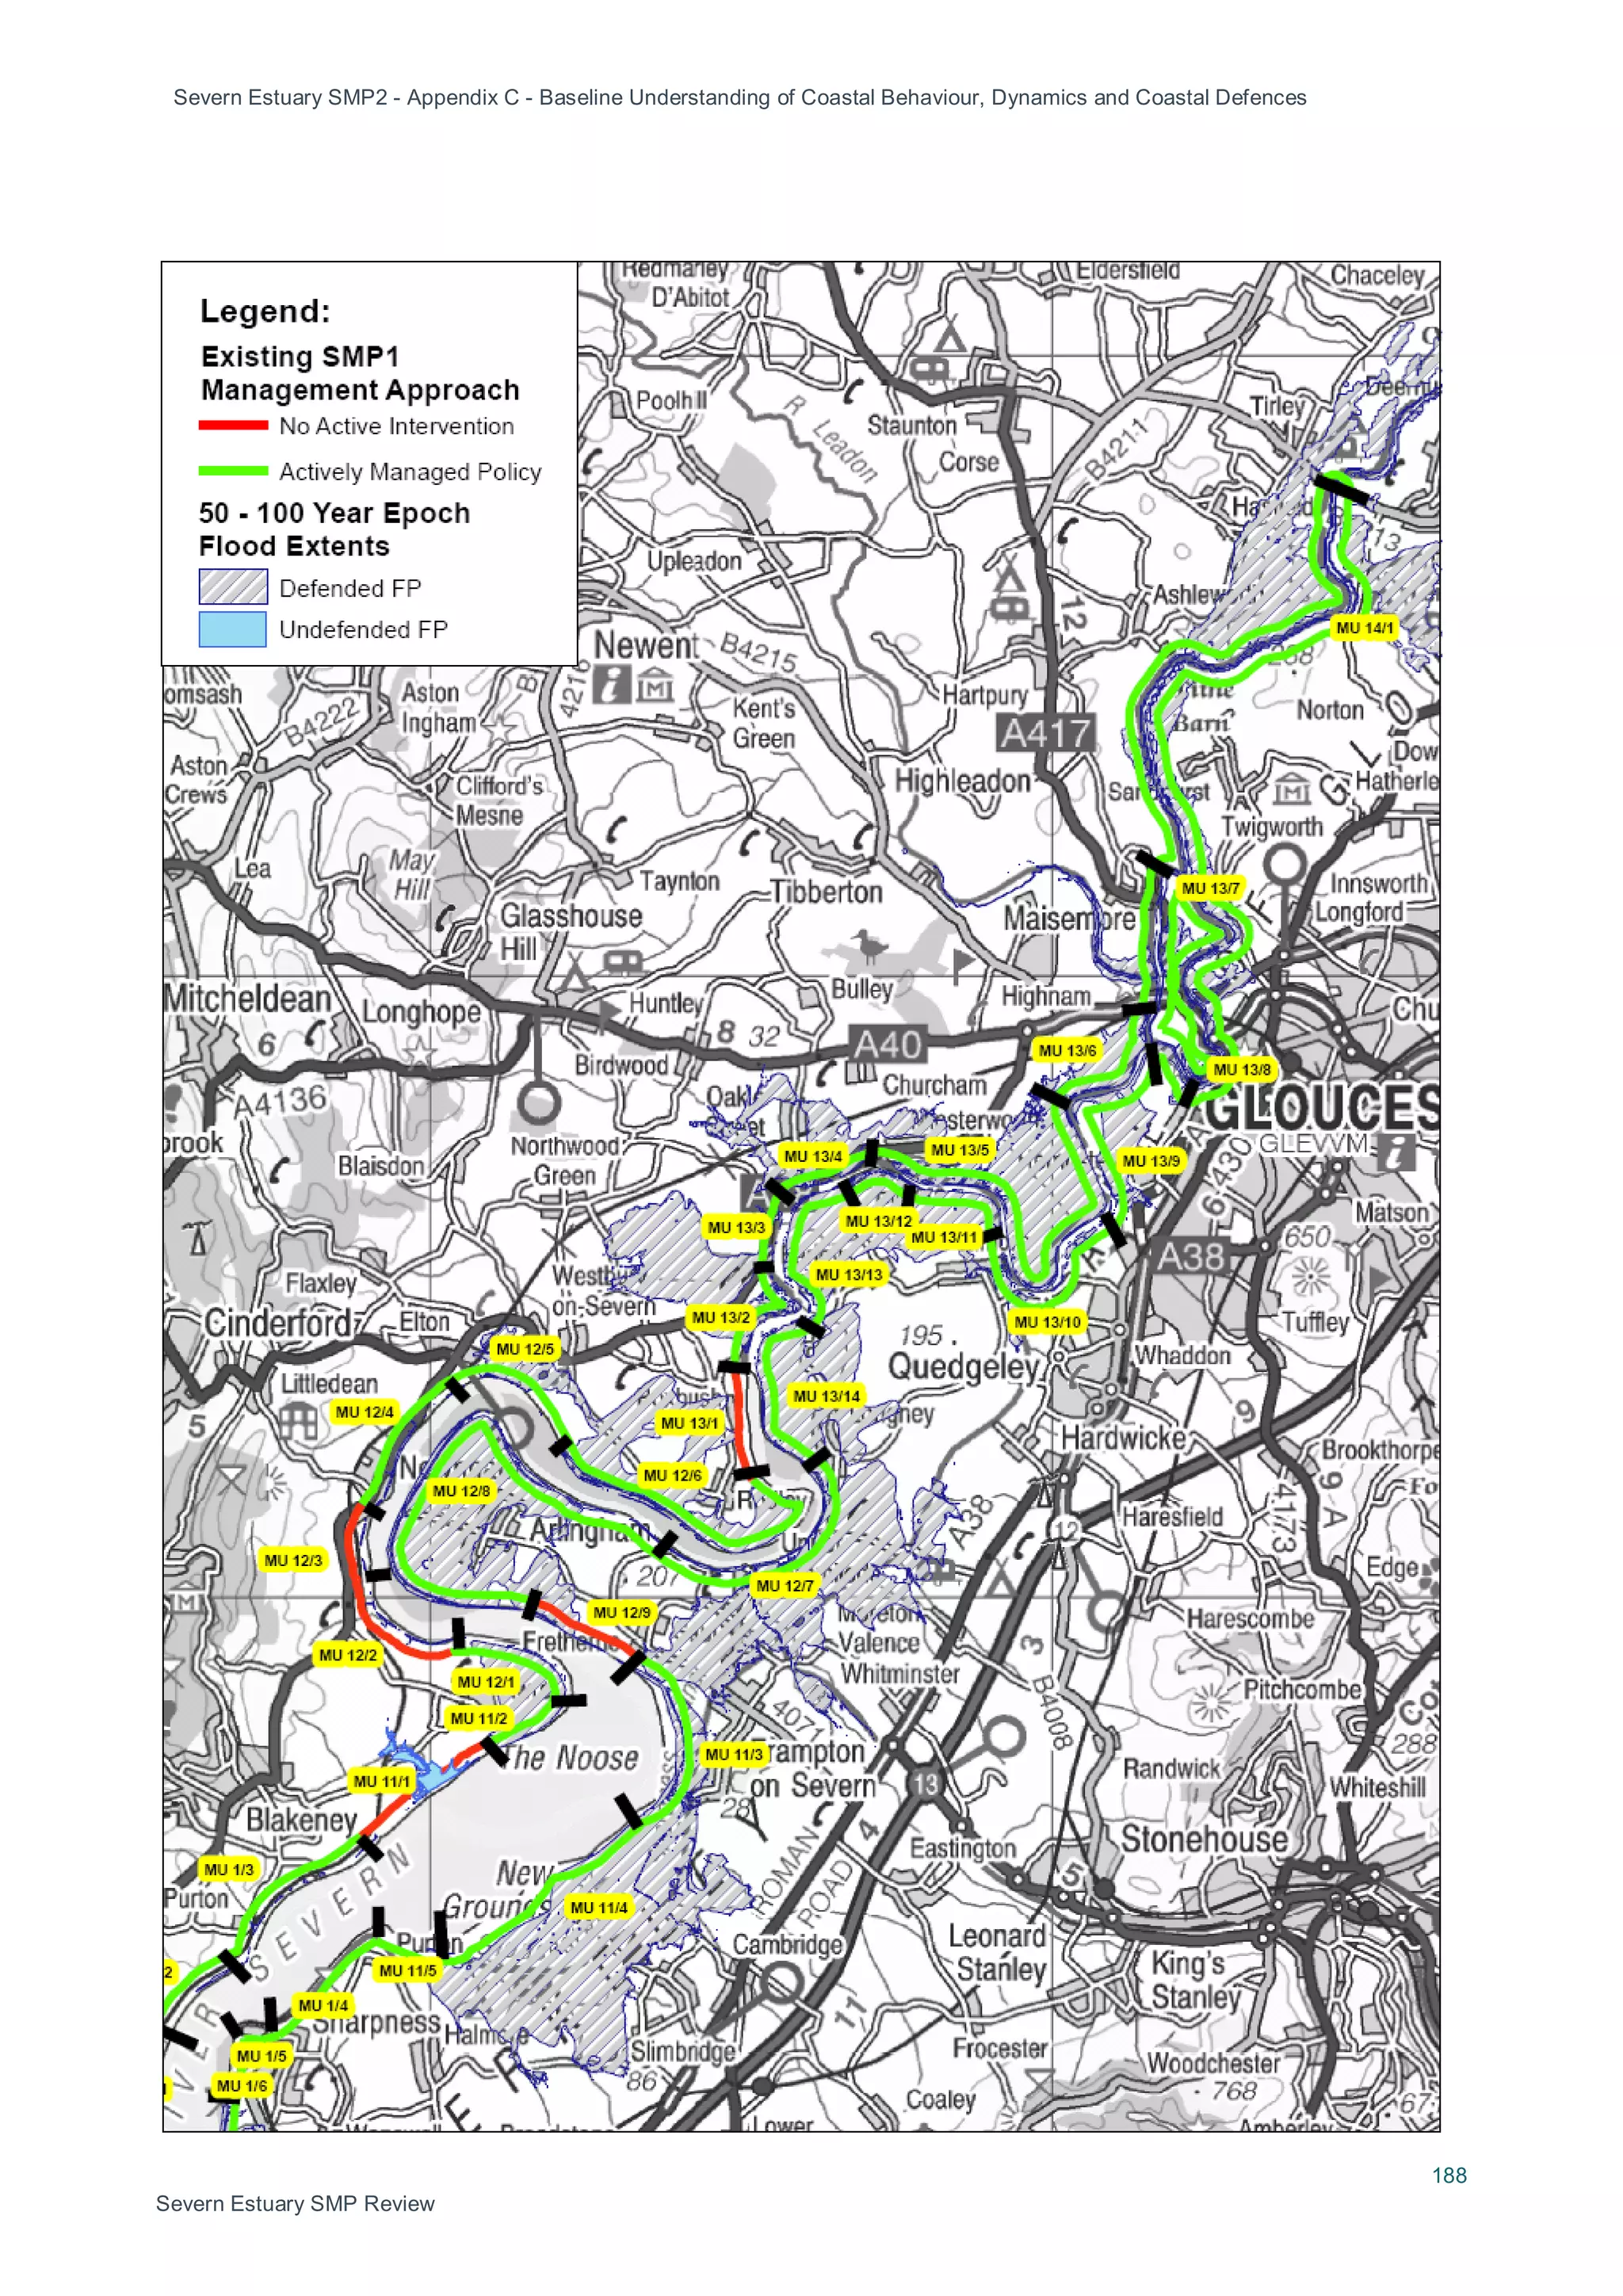
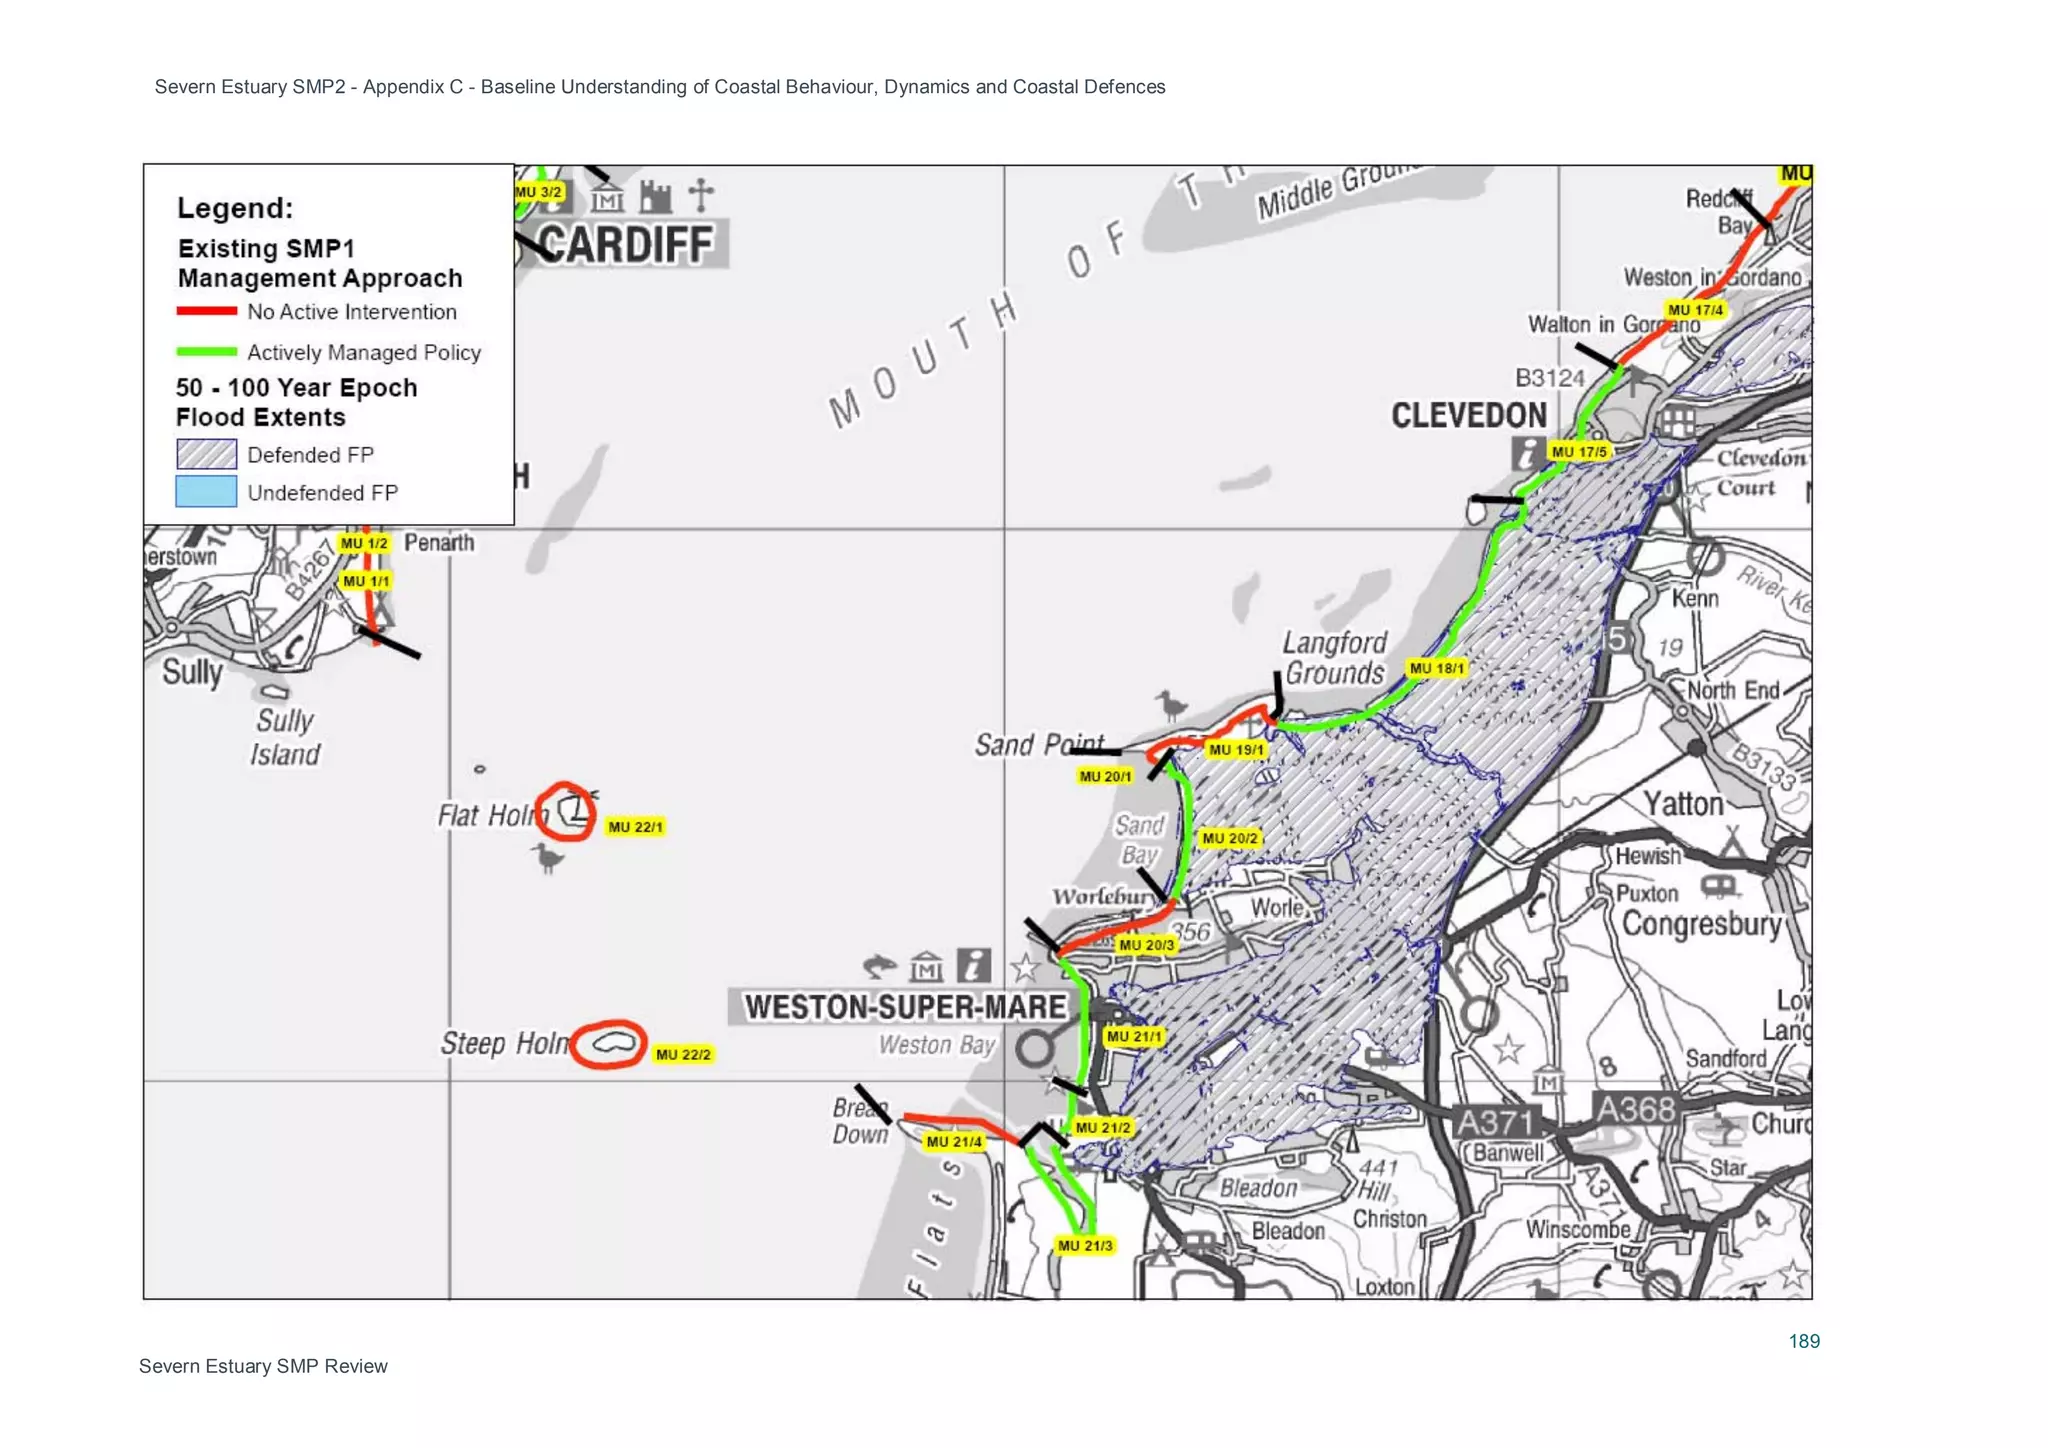
Part B details existing coastal defences along the shoreline based on surveys and updates from local authorities. It considers residual life of defences over 20, 50, and 100 years.
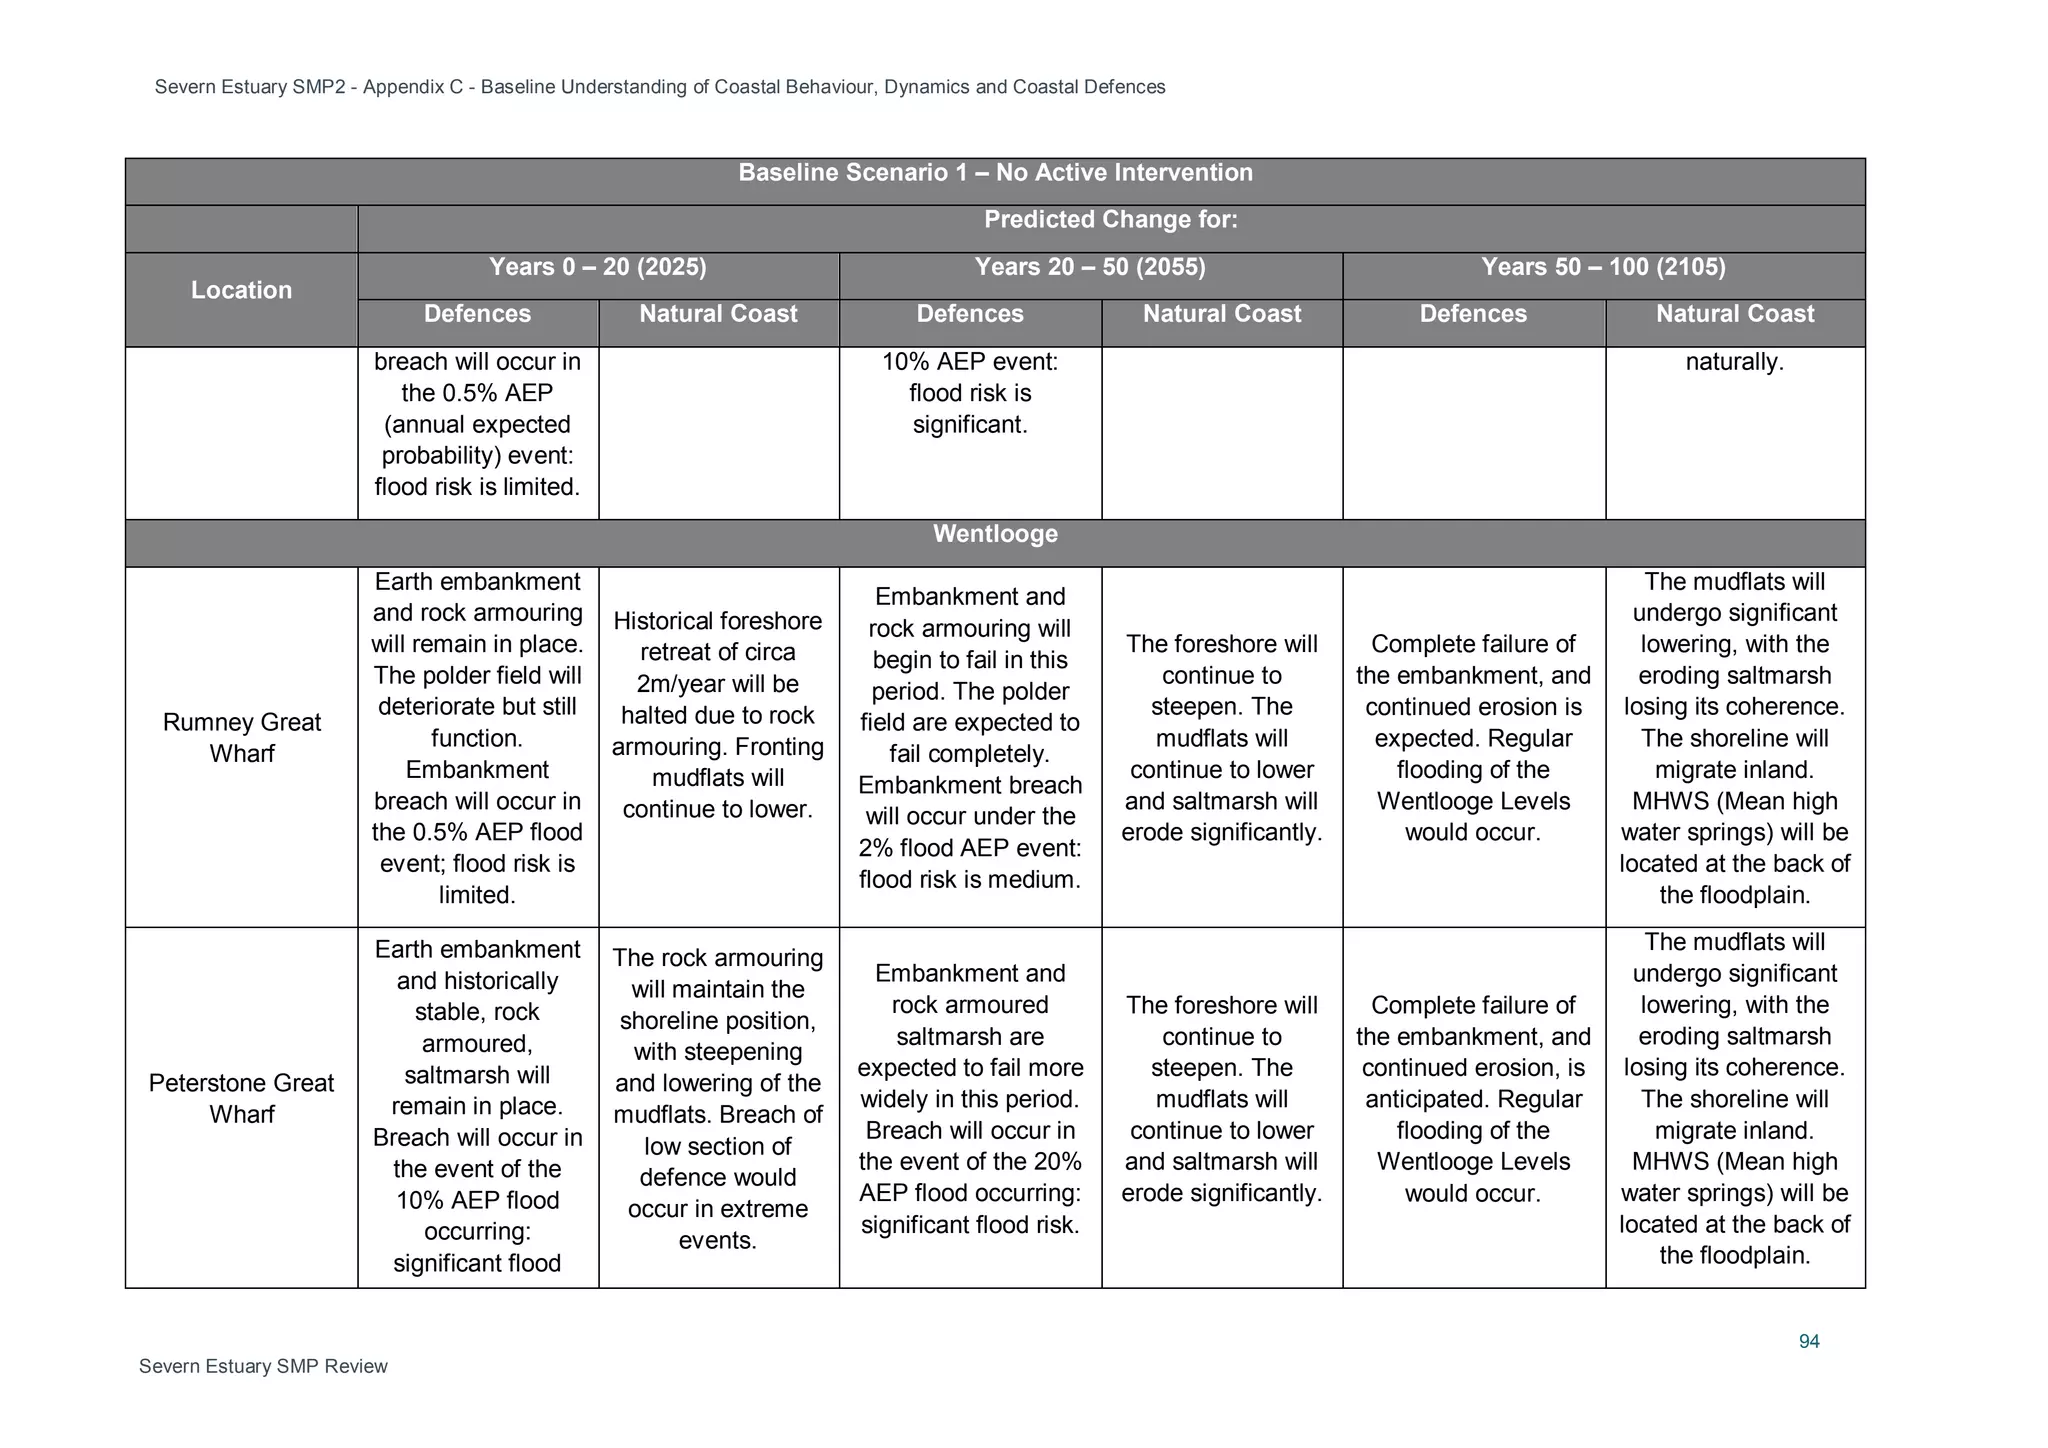
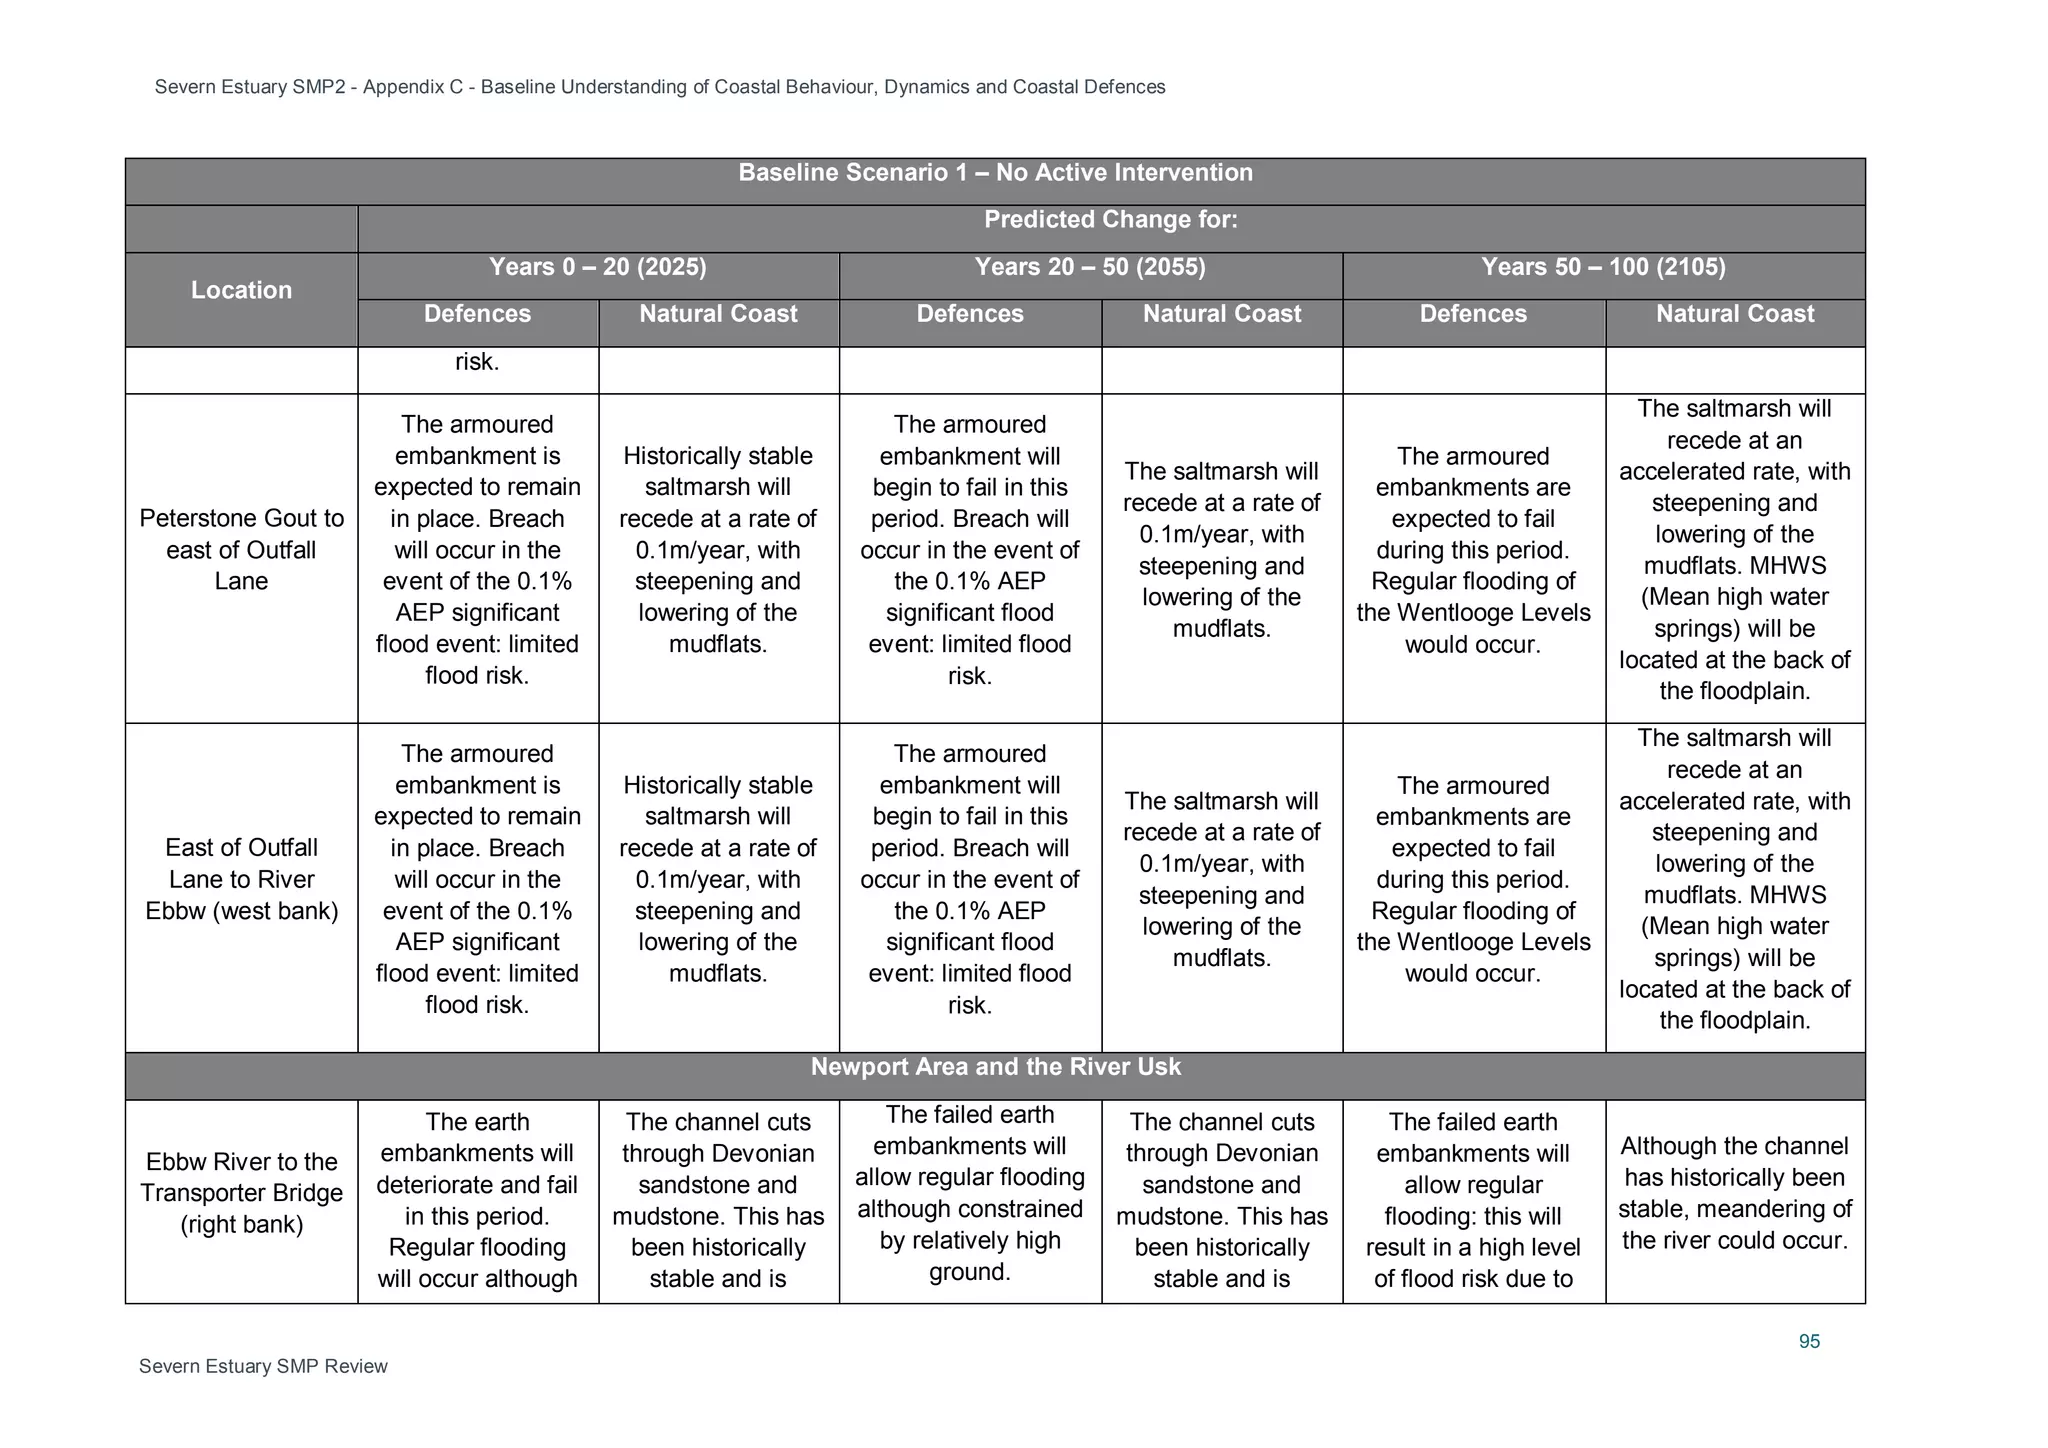
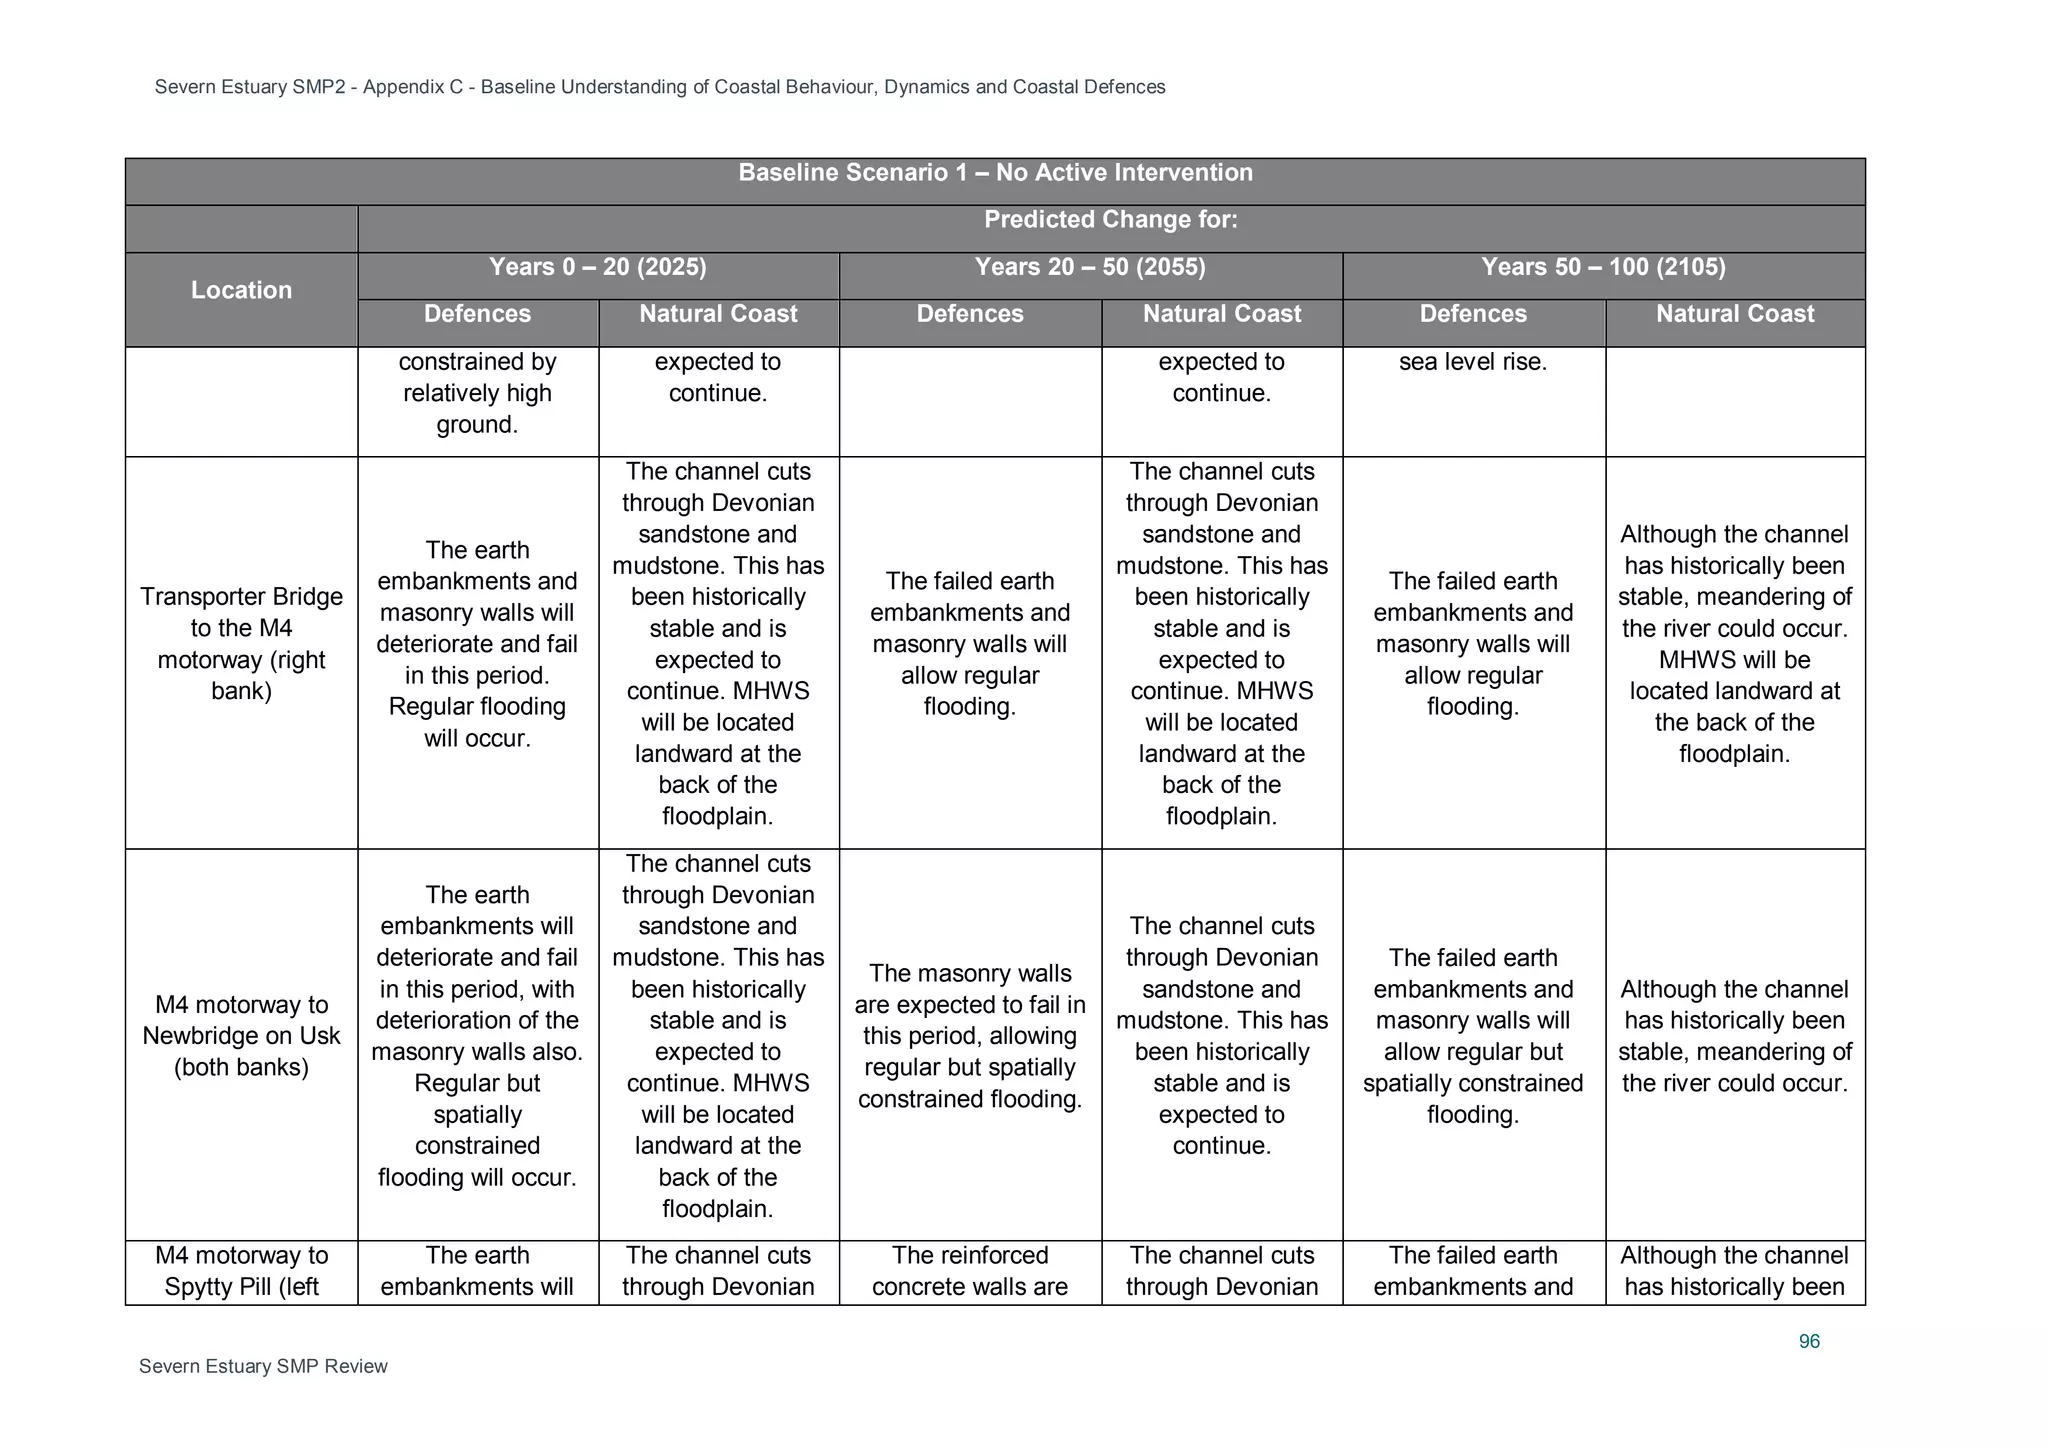
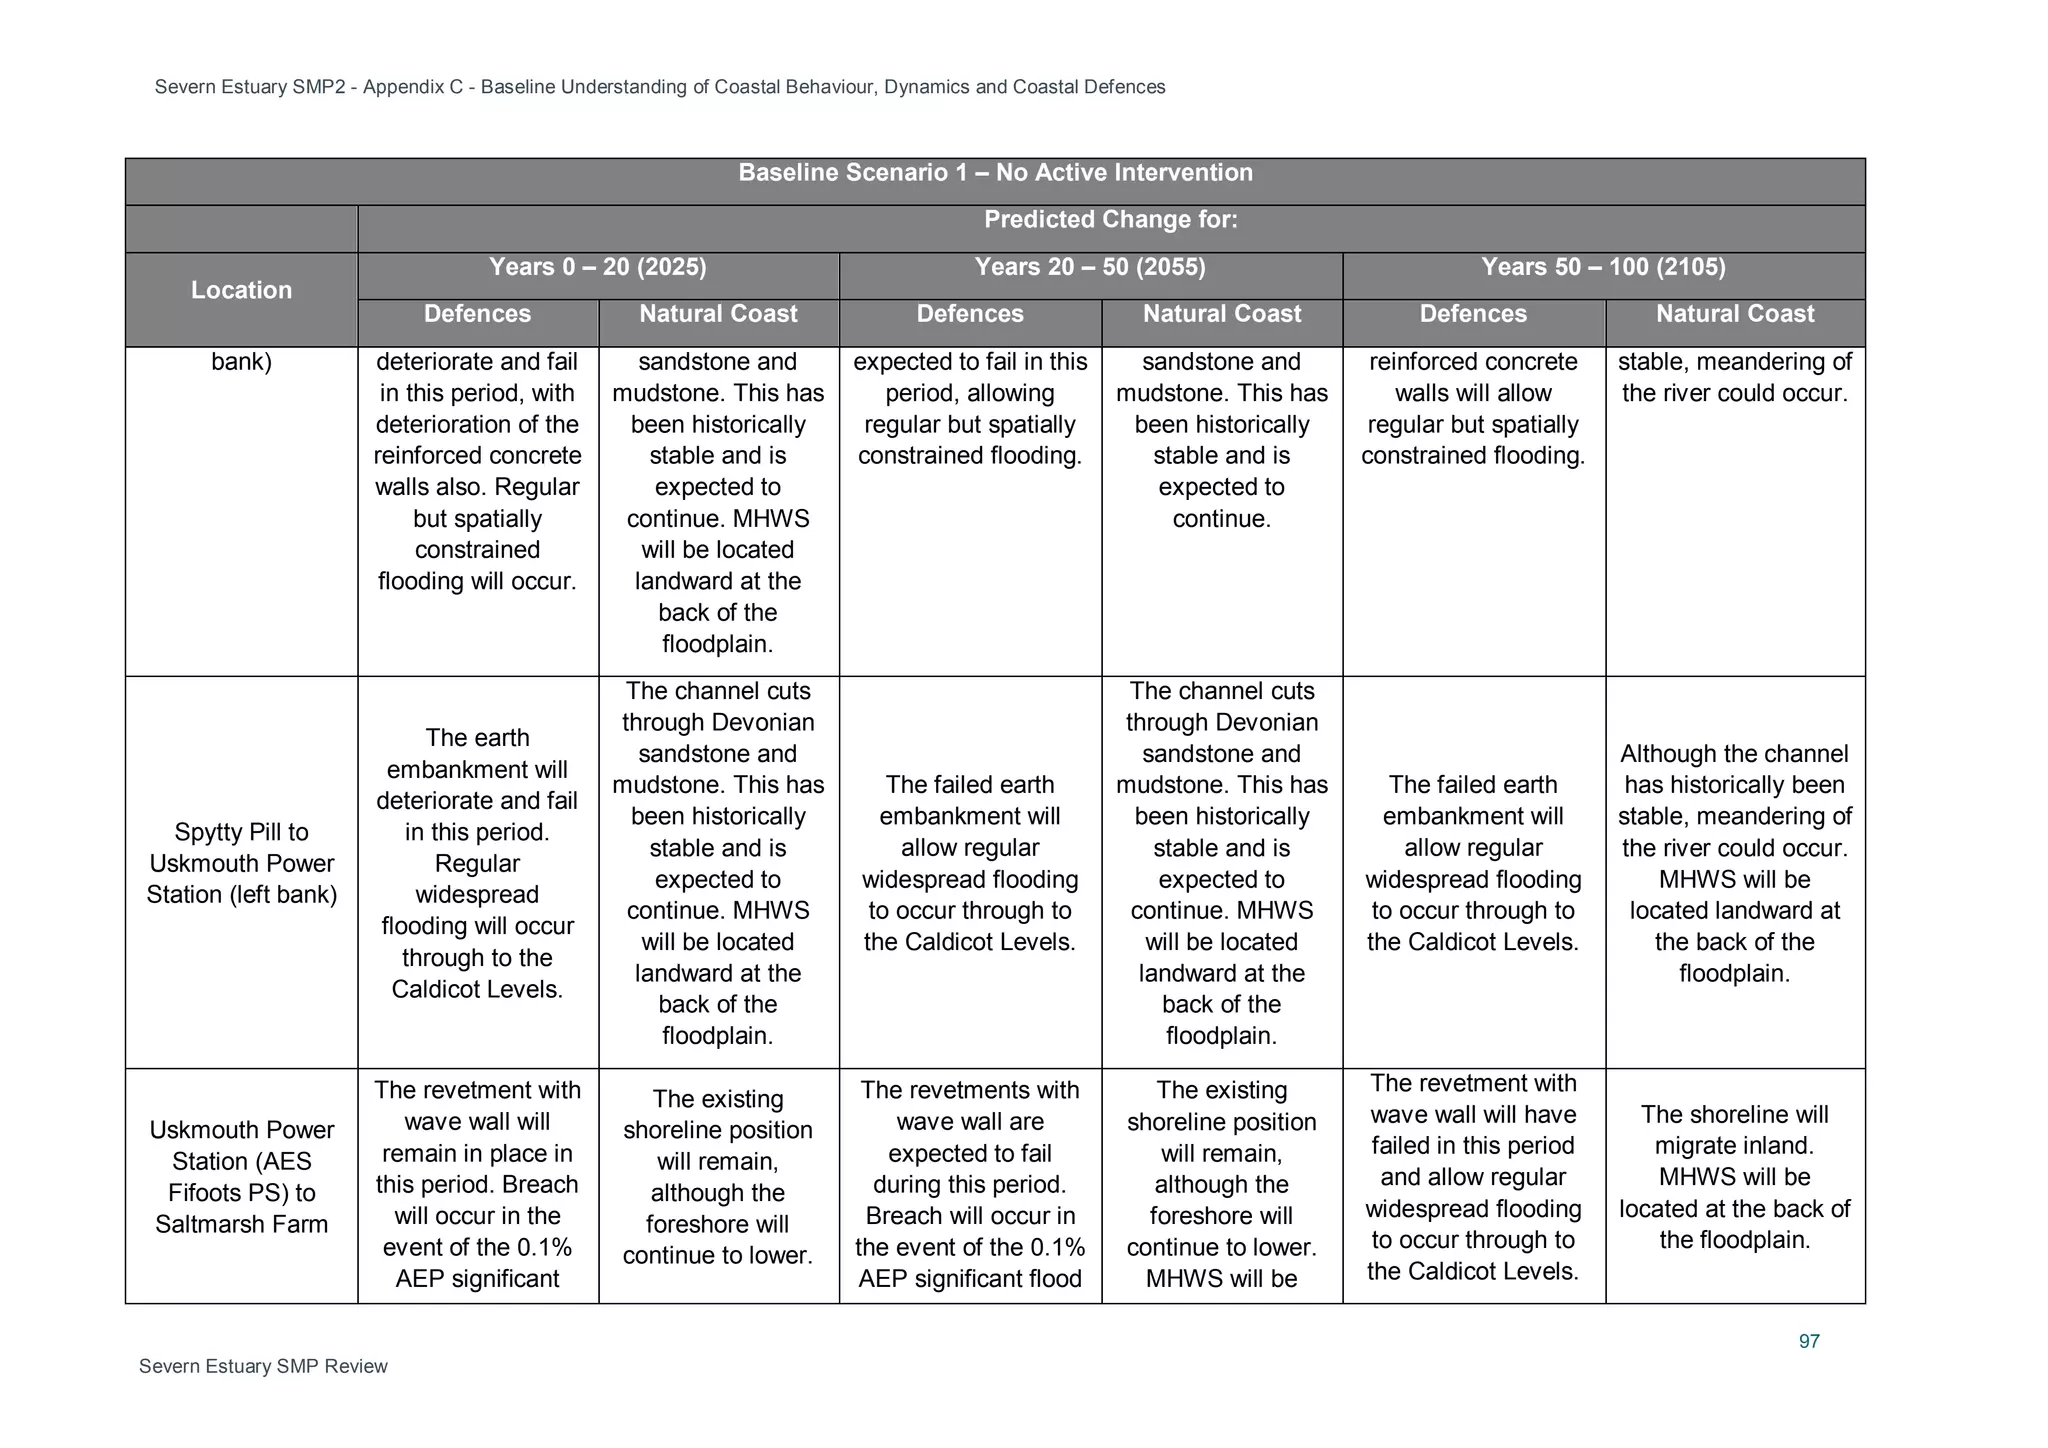
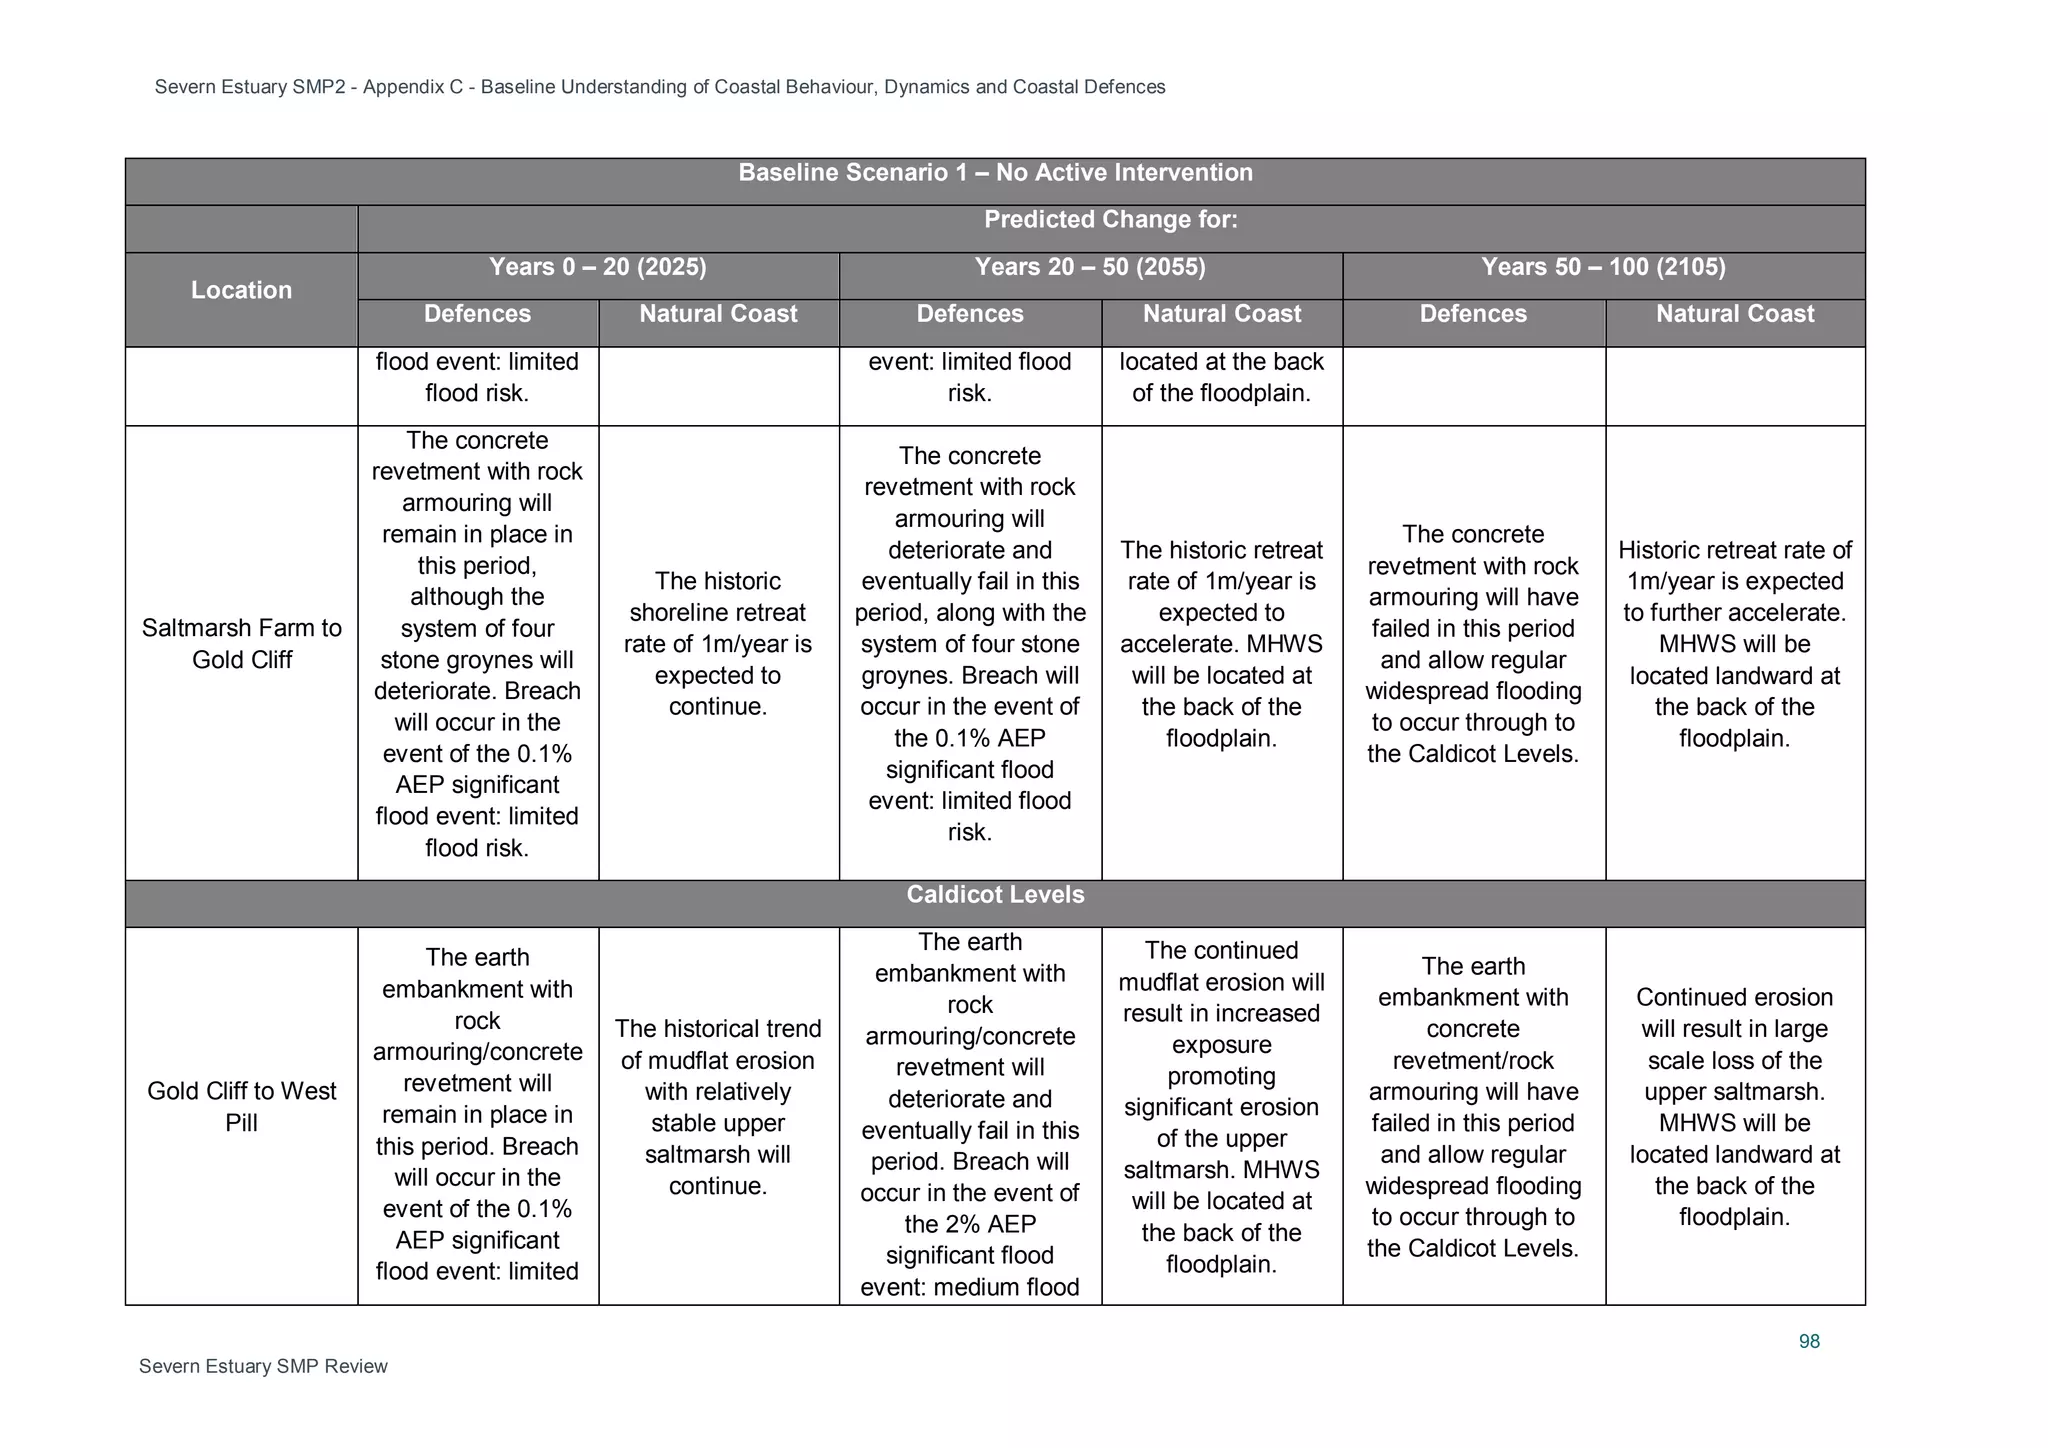
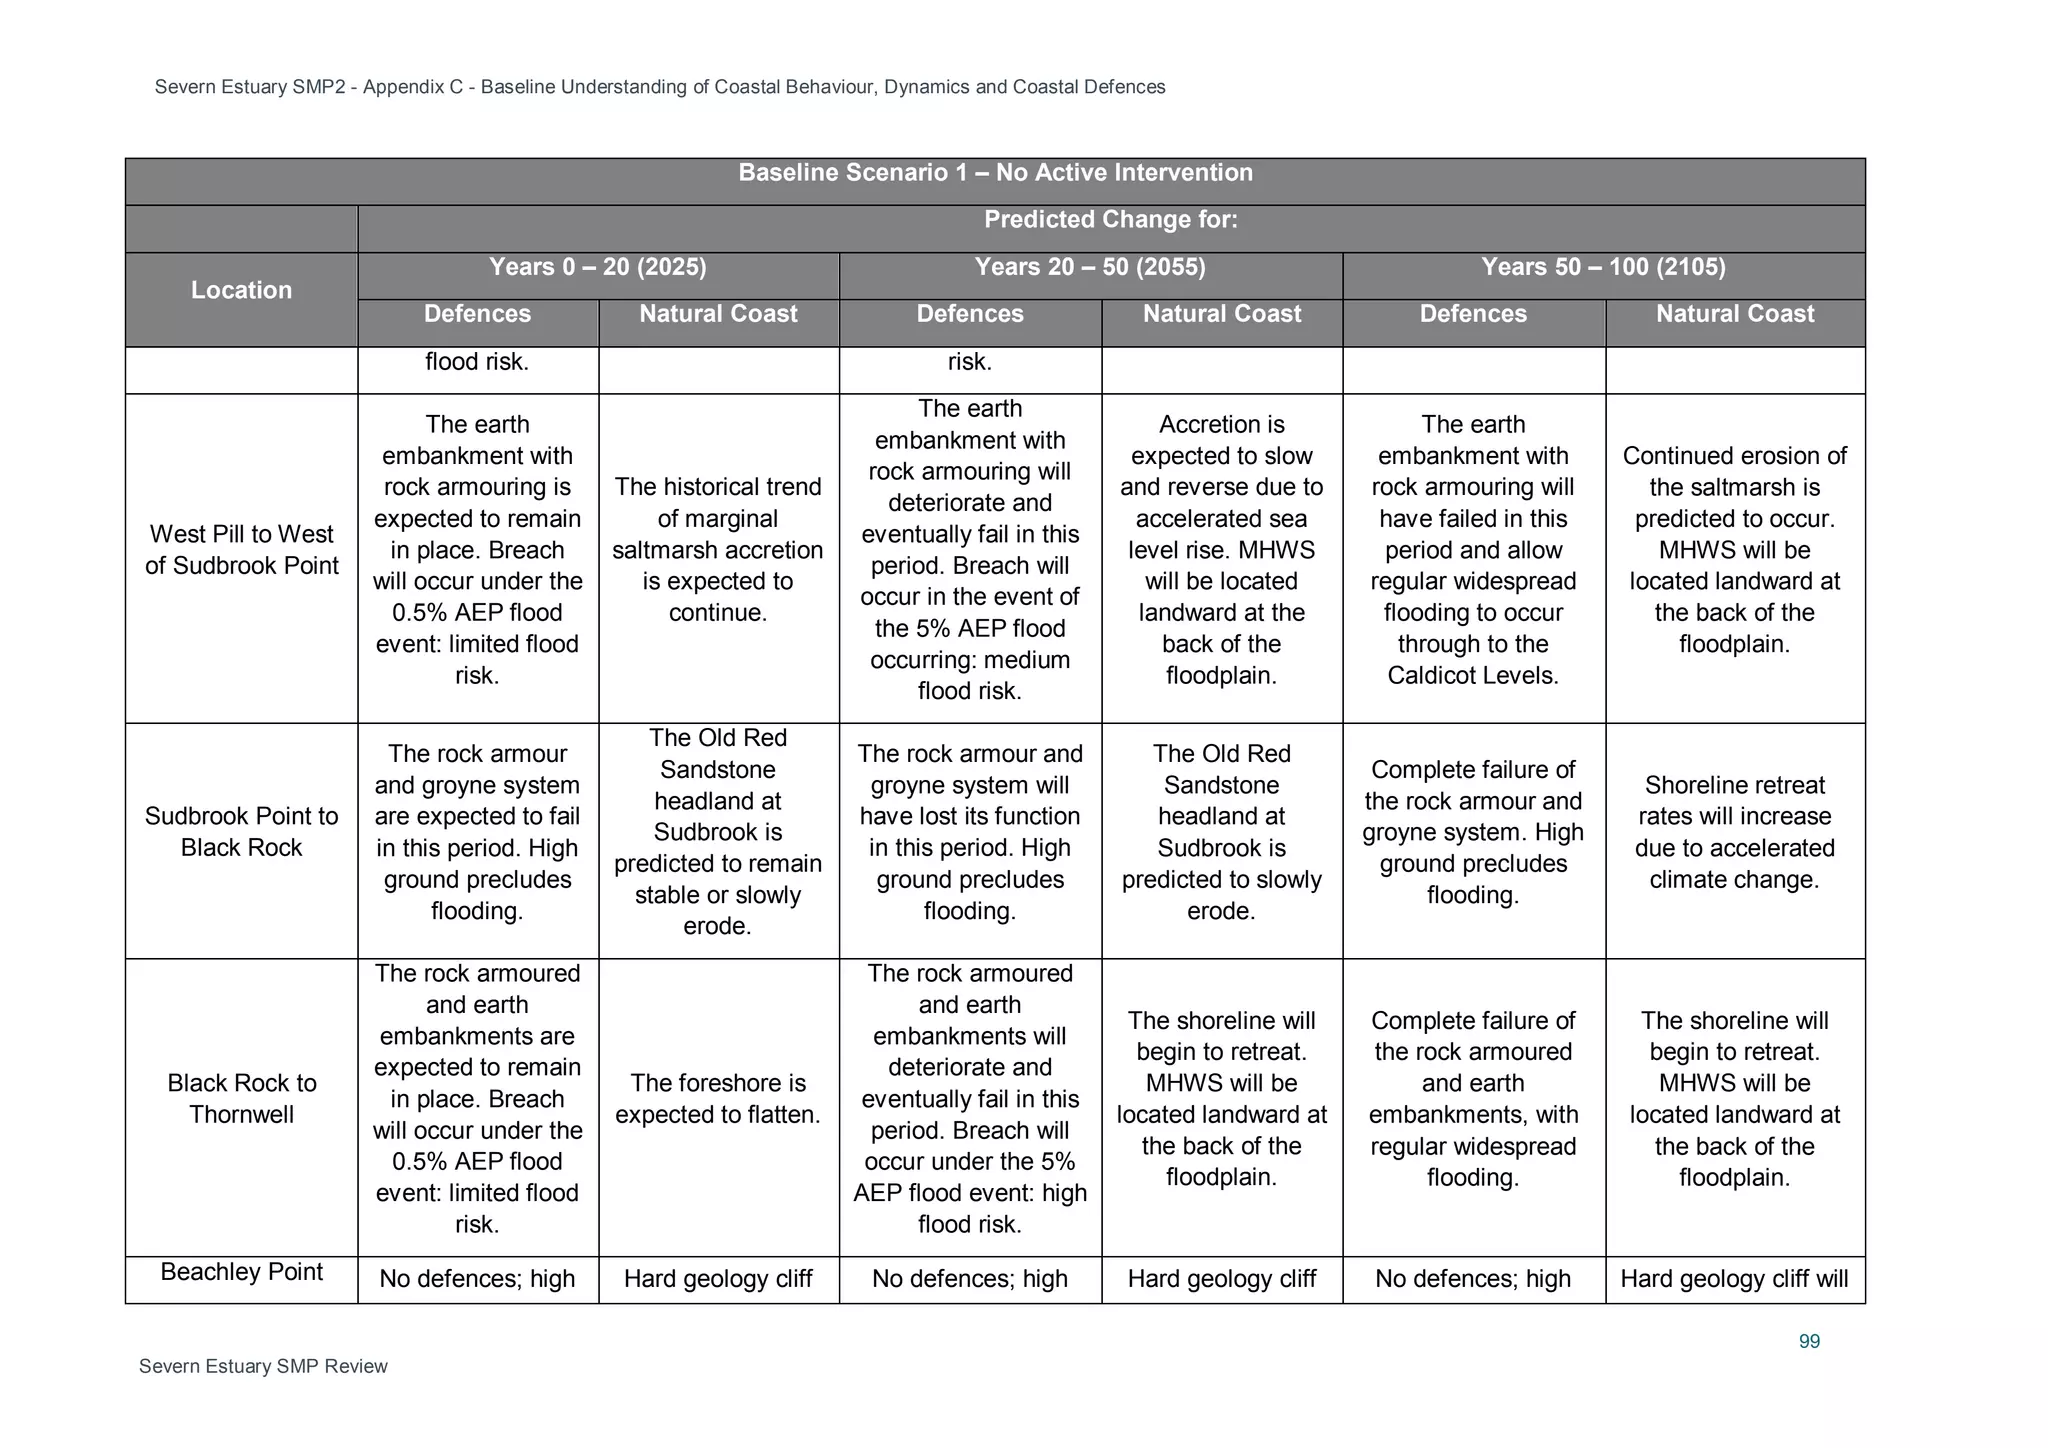
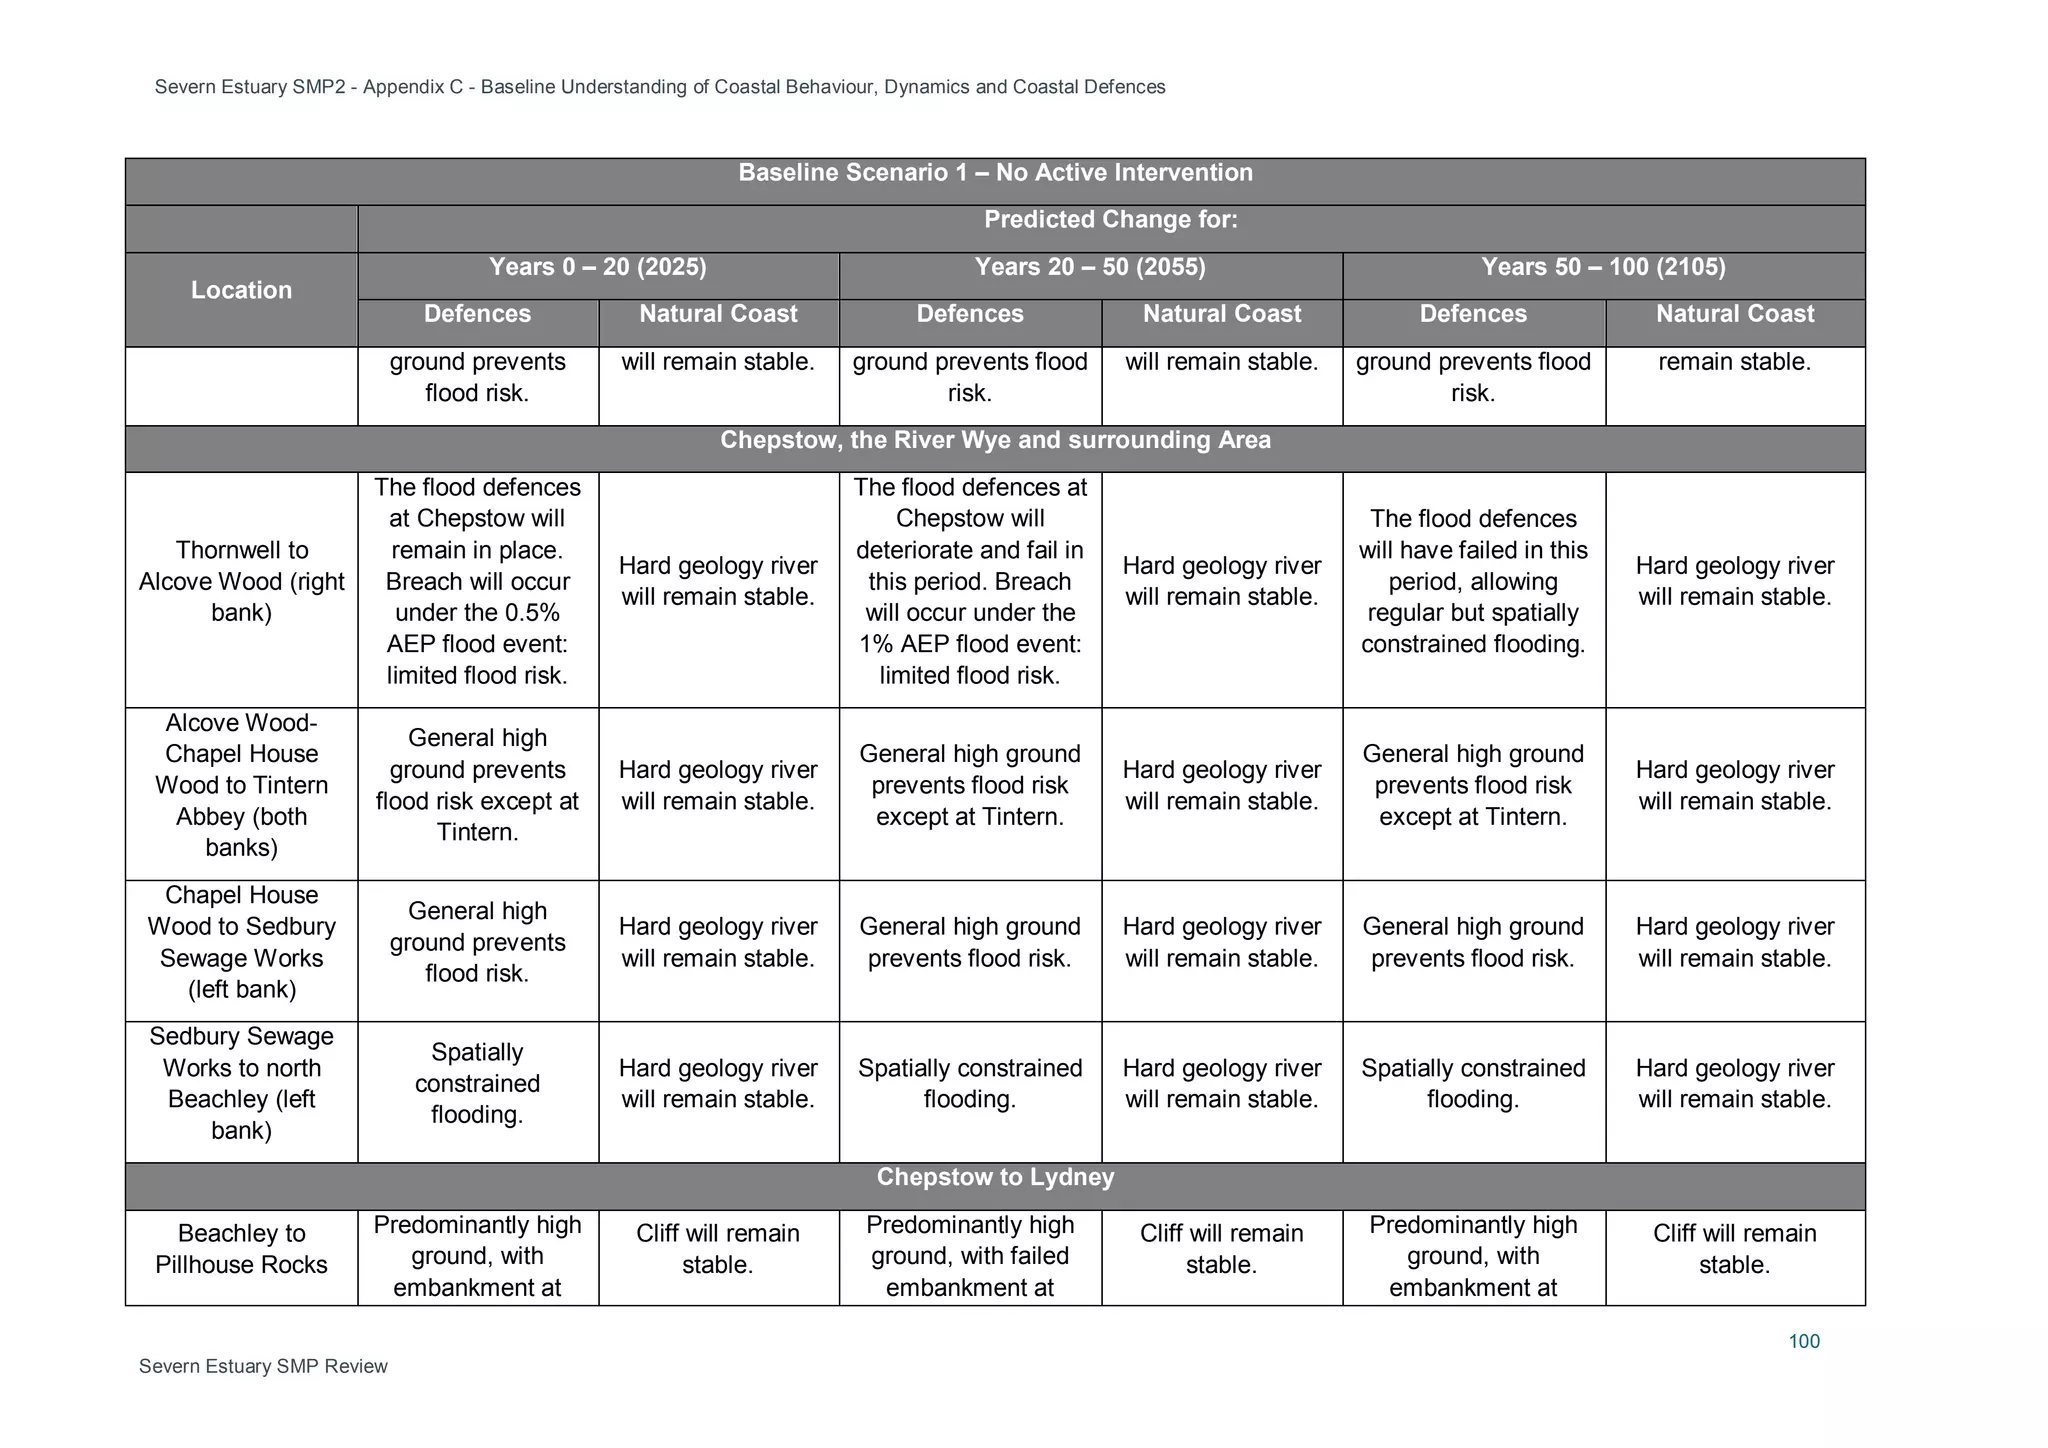
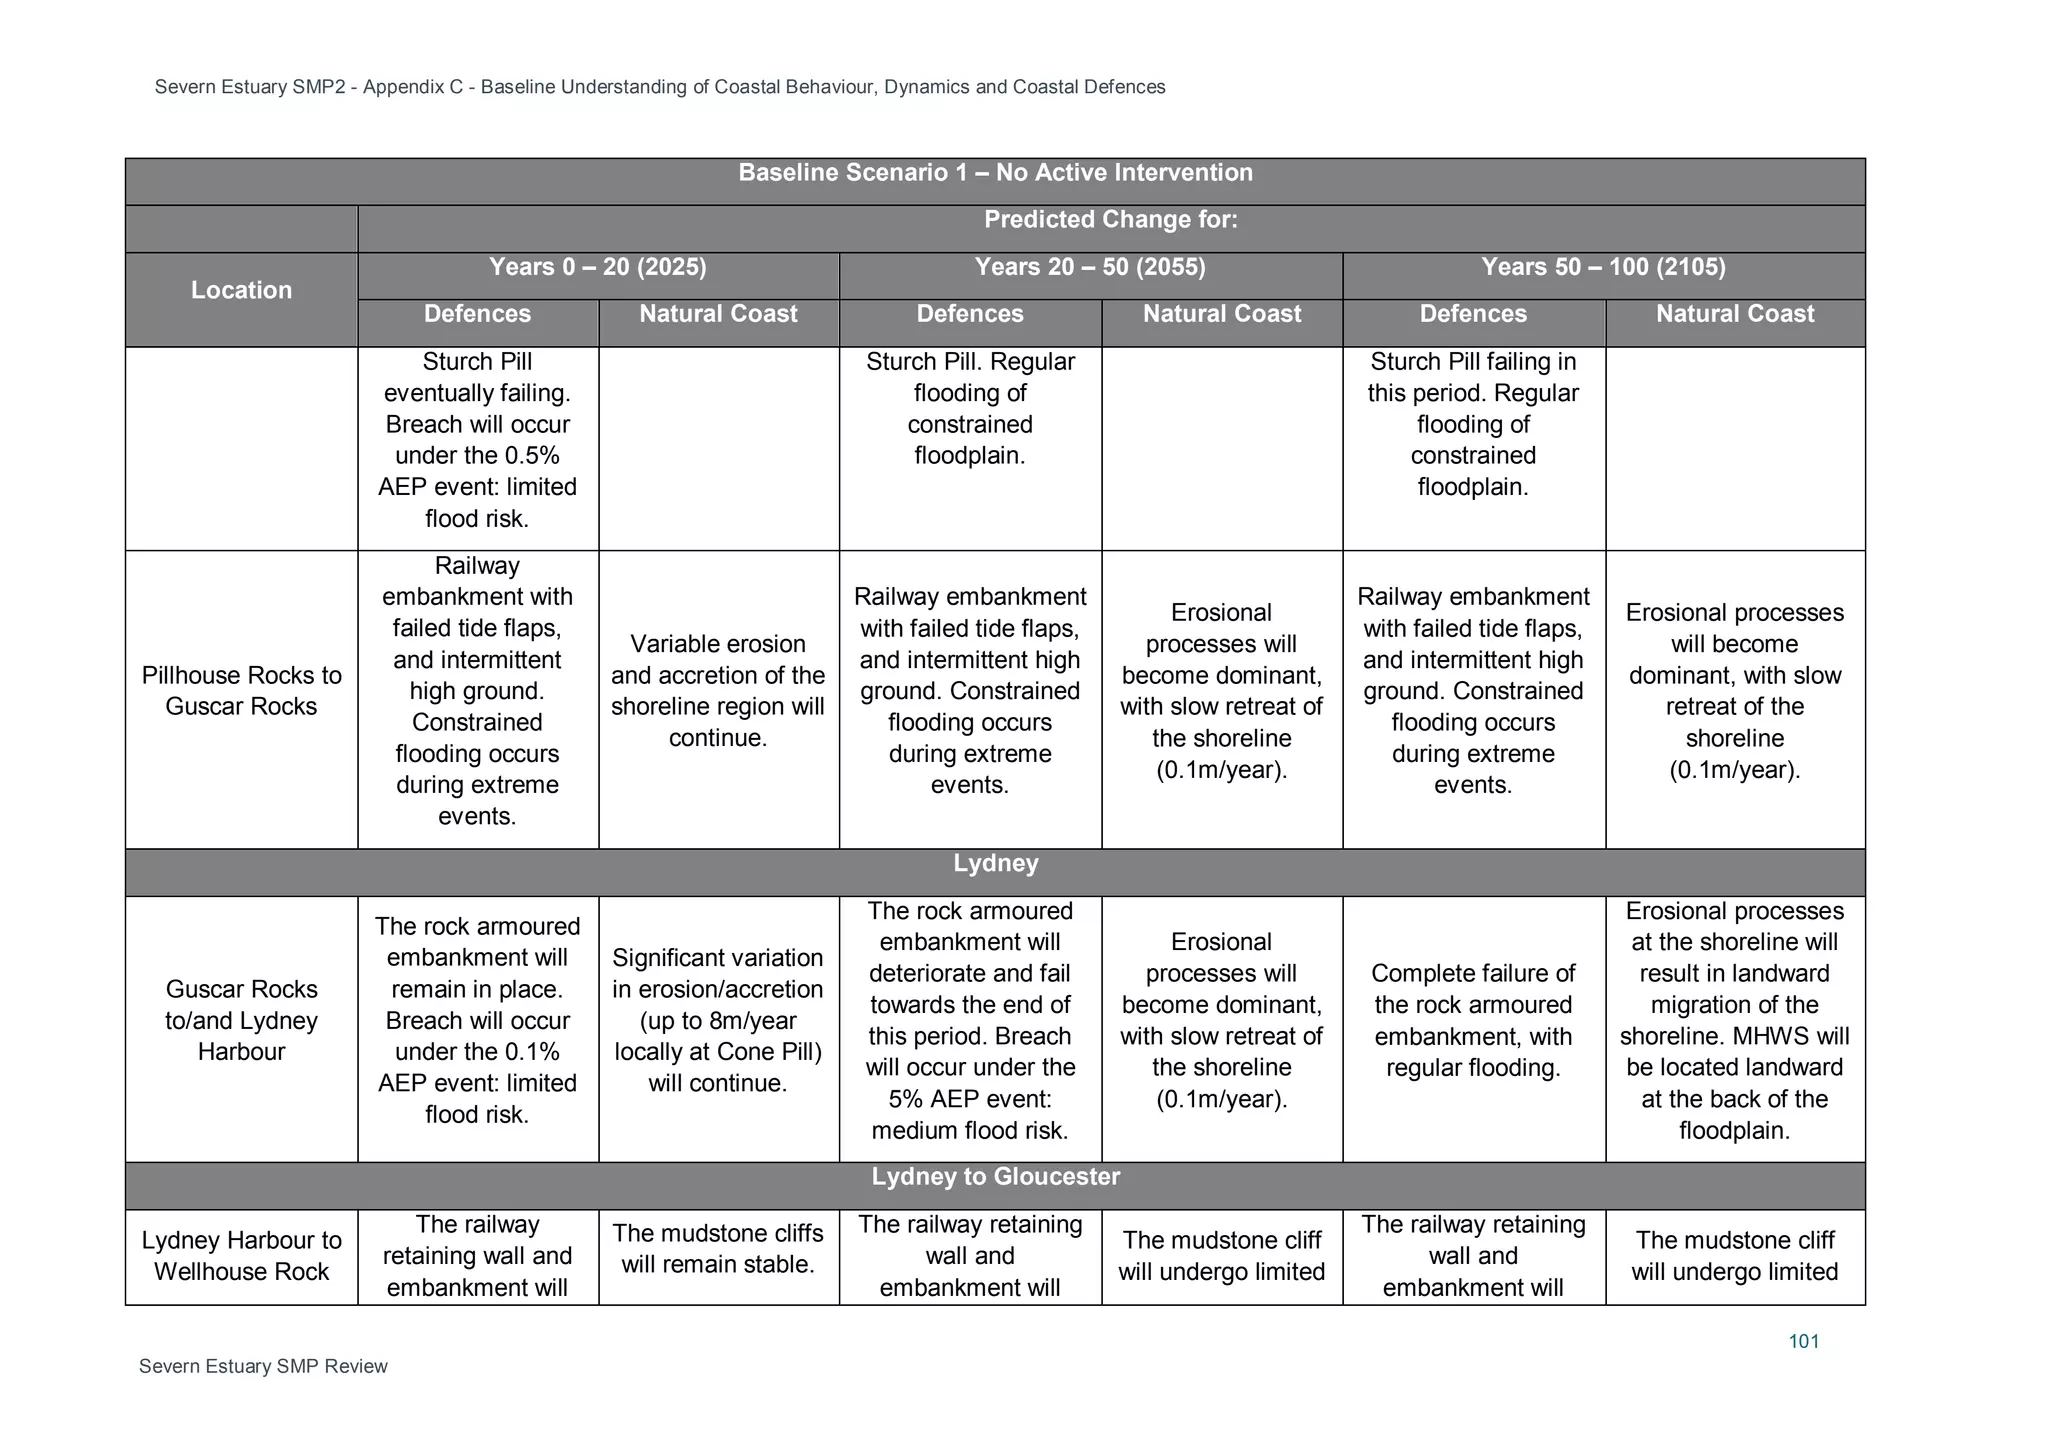
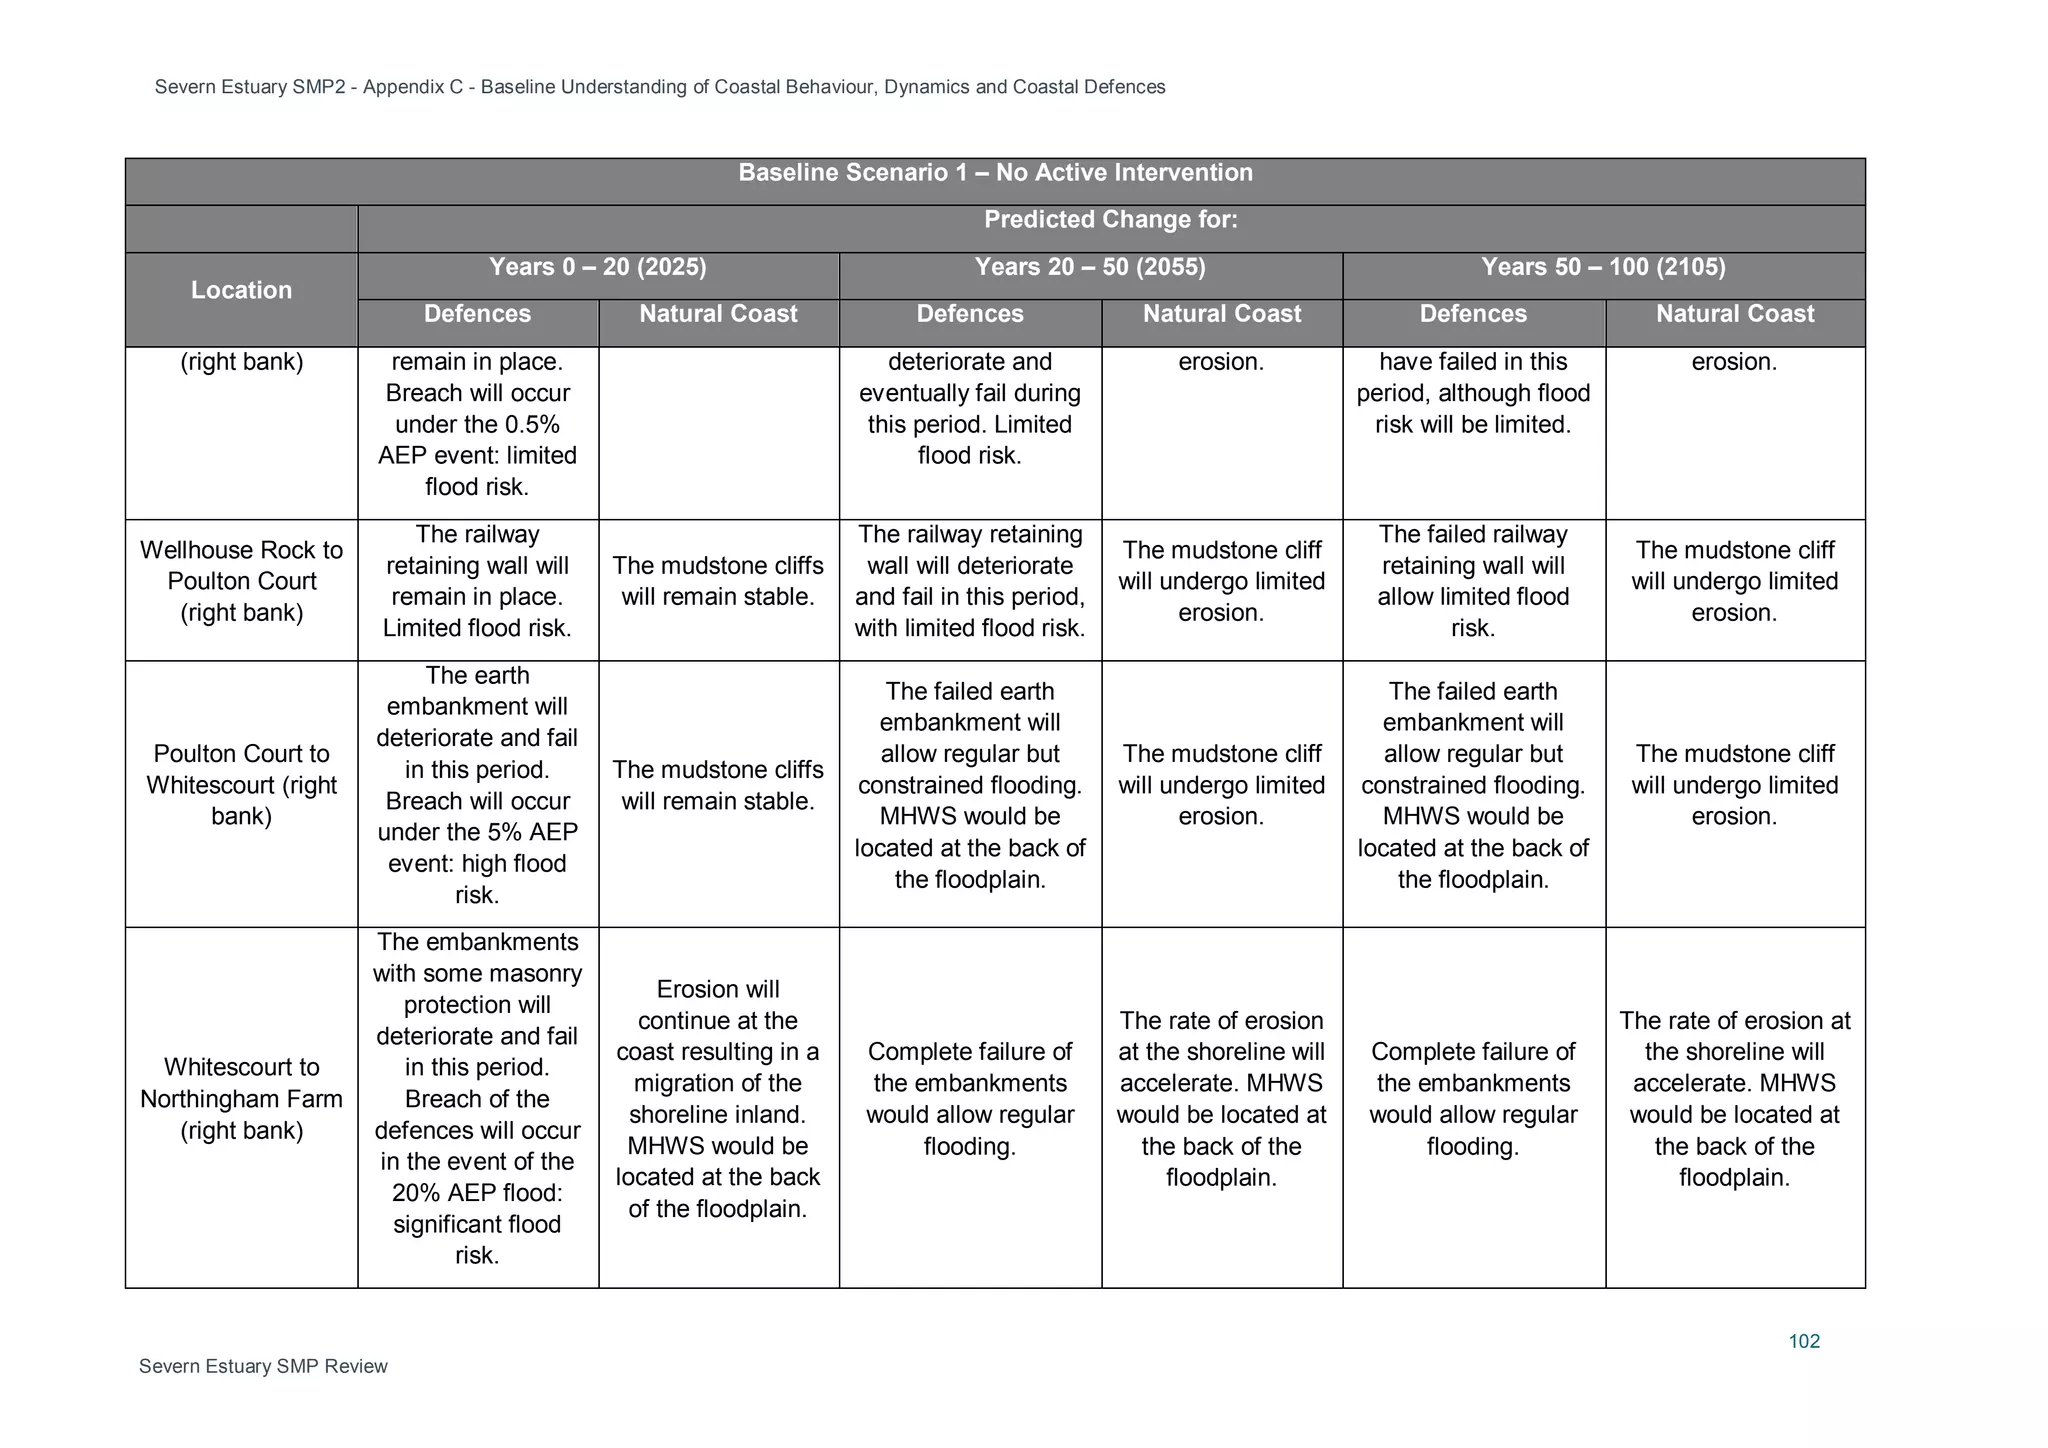
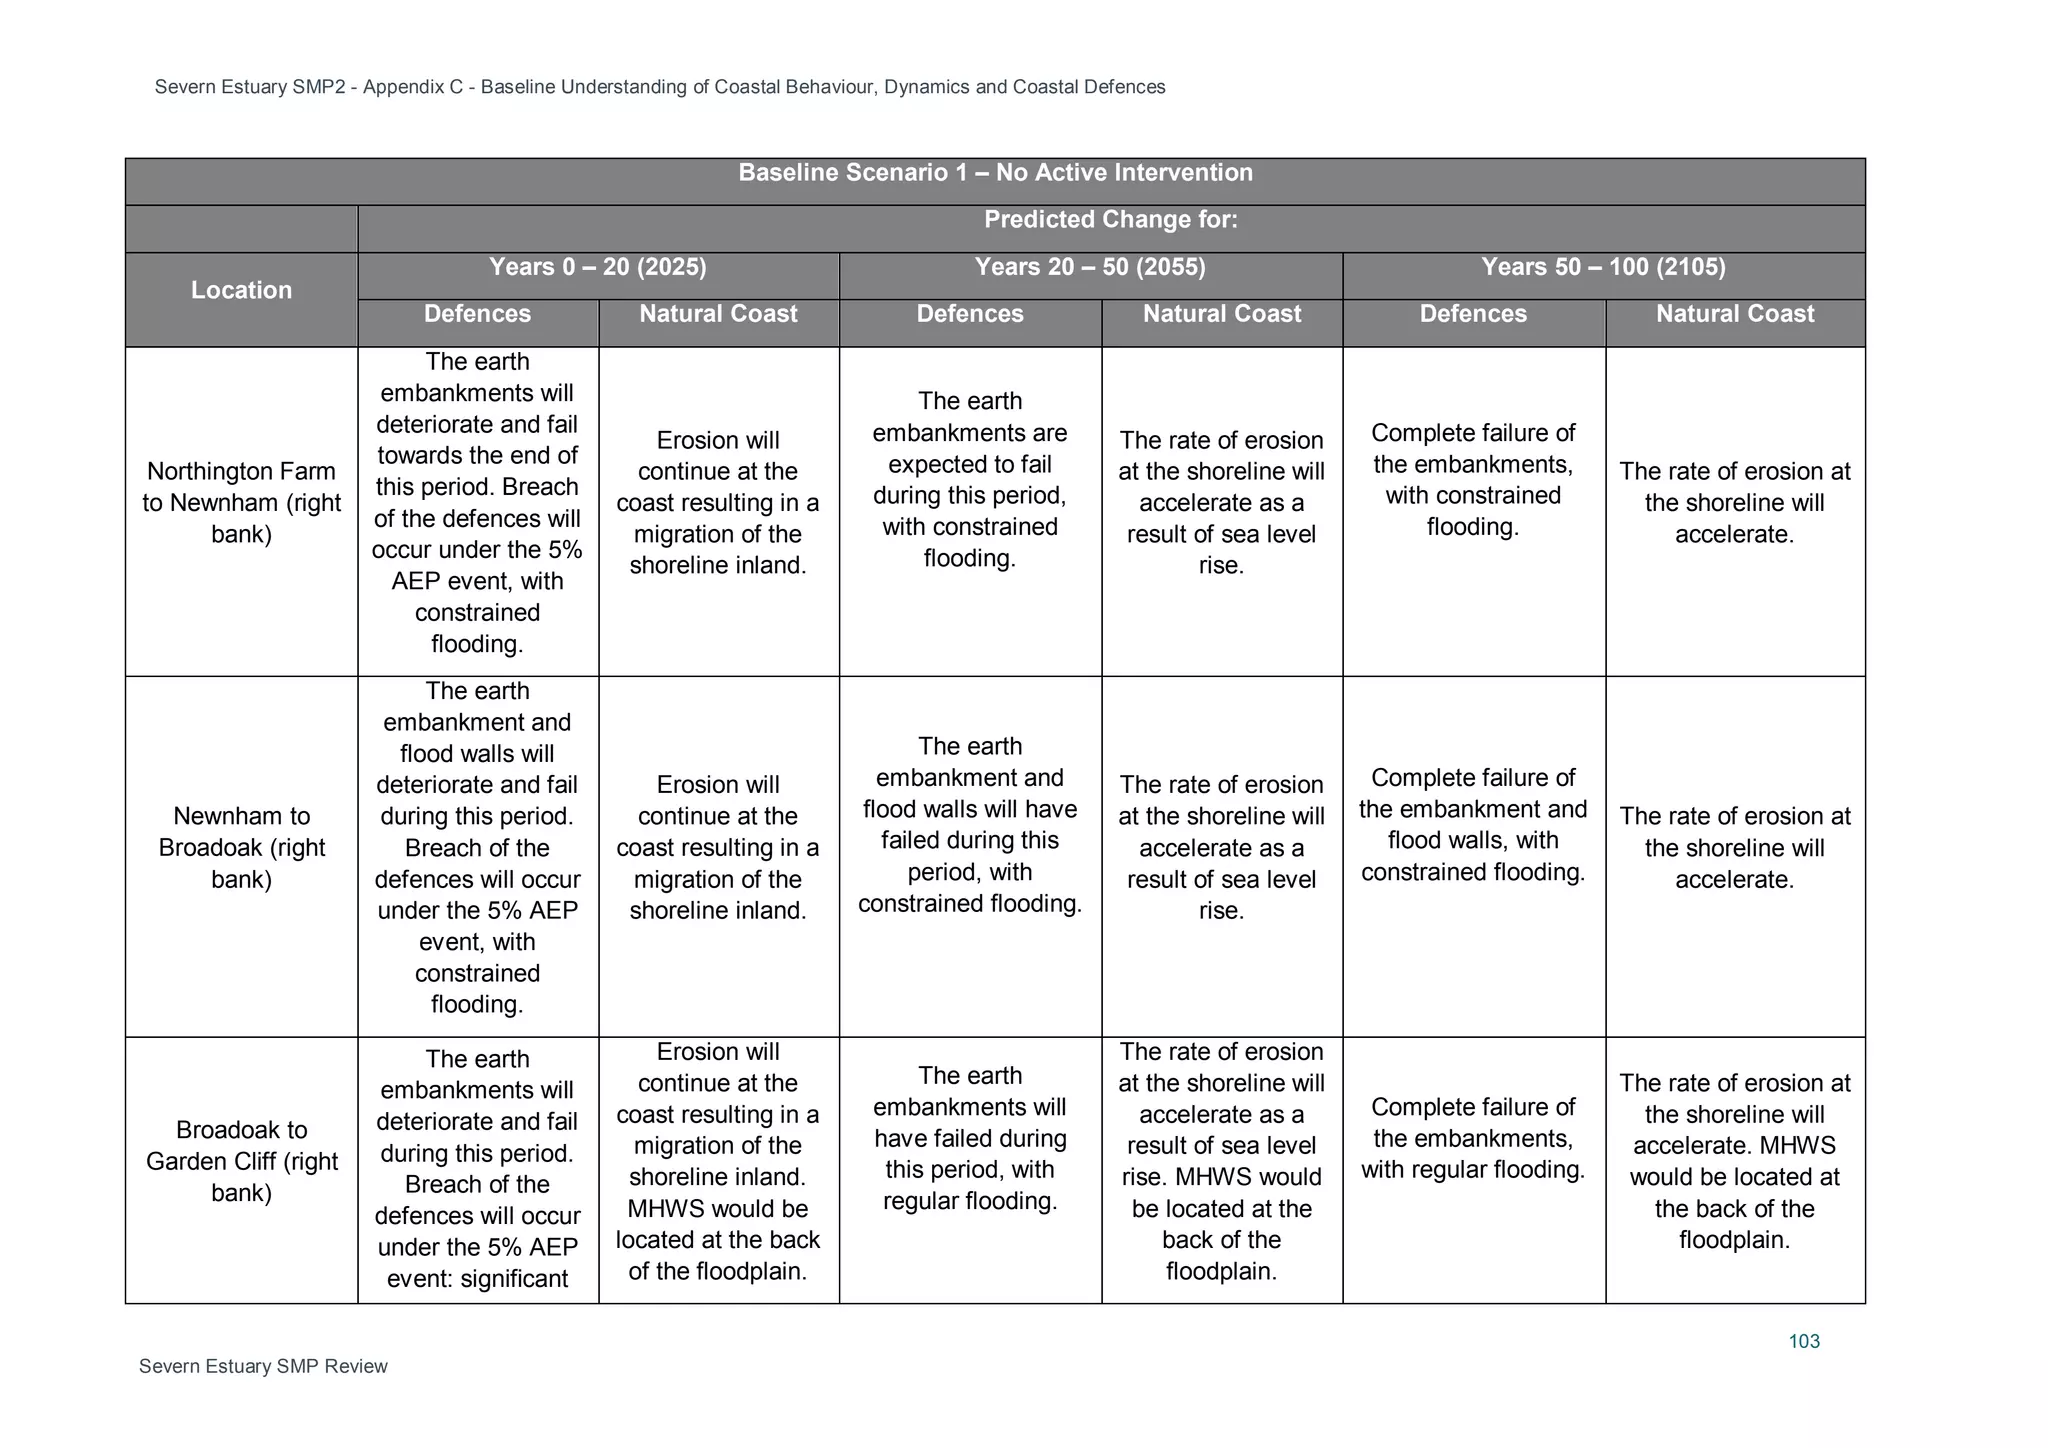
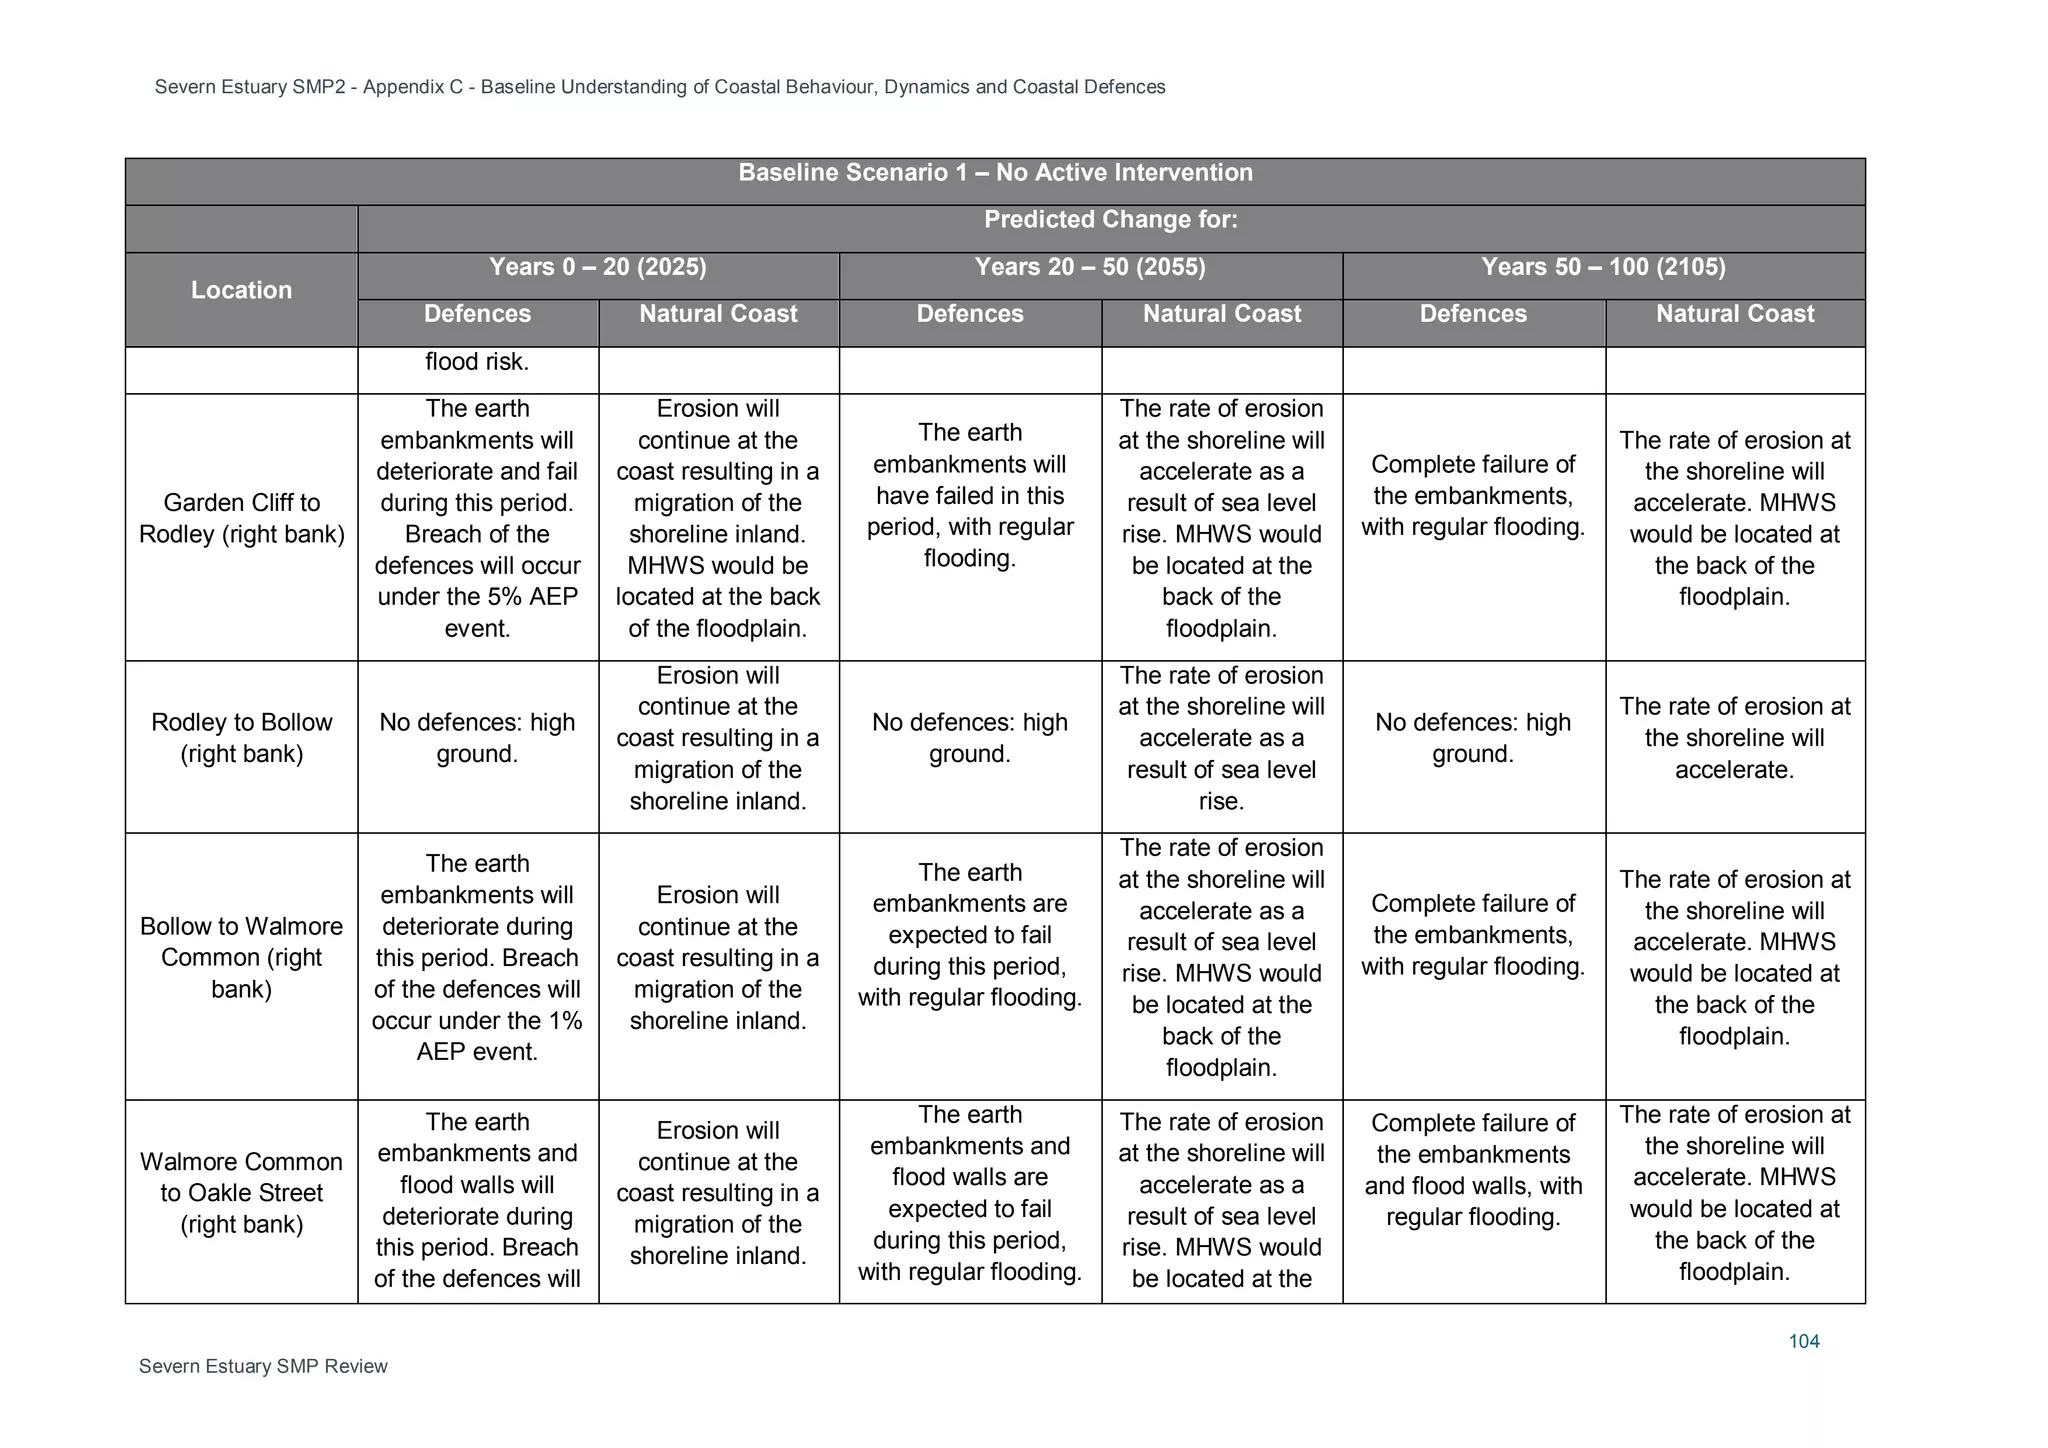
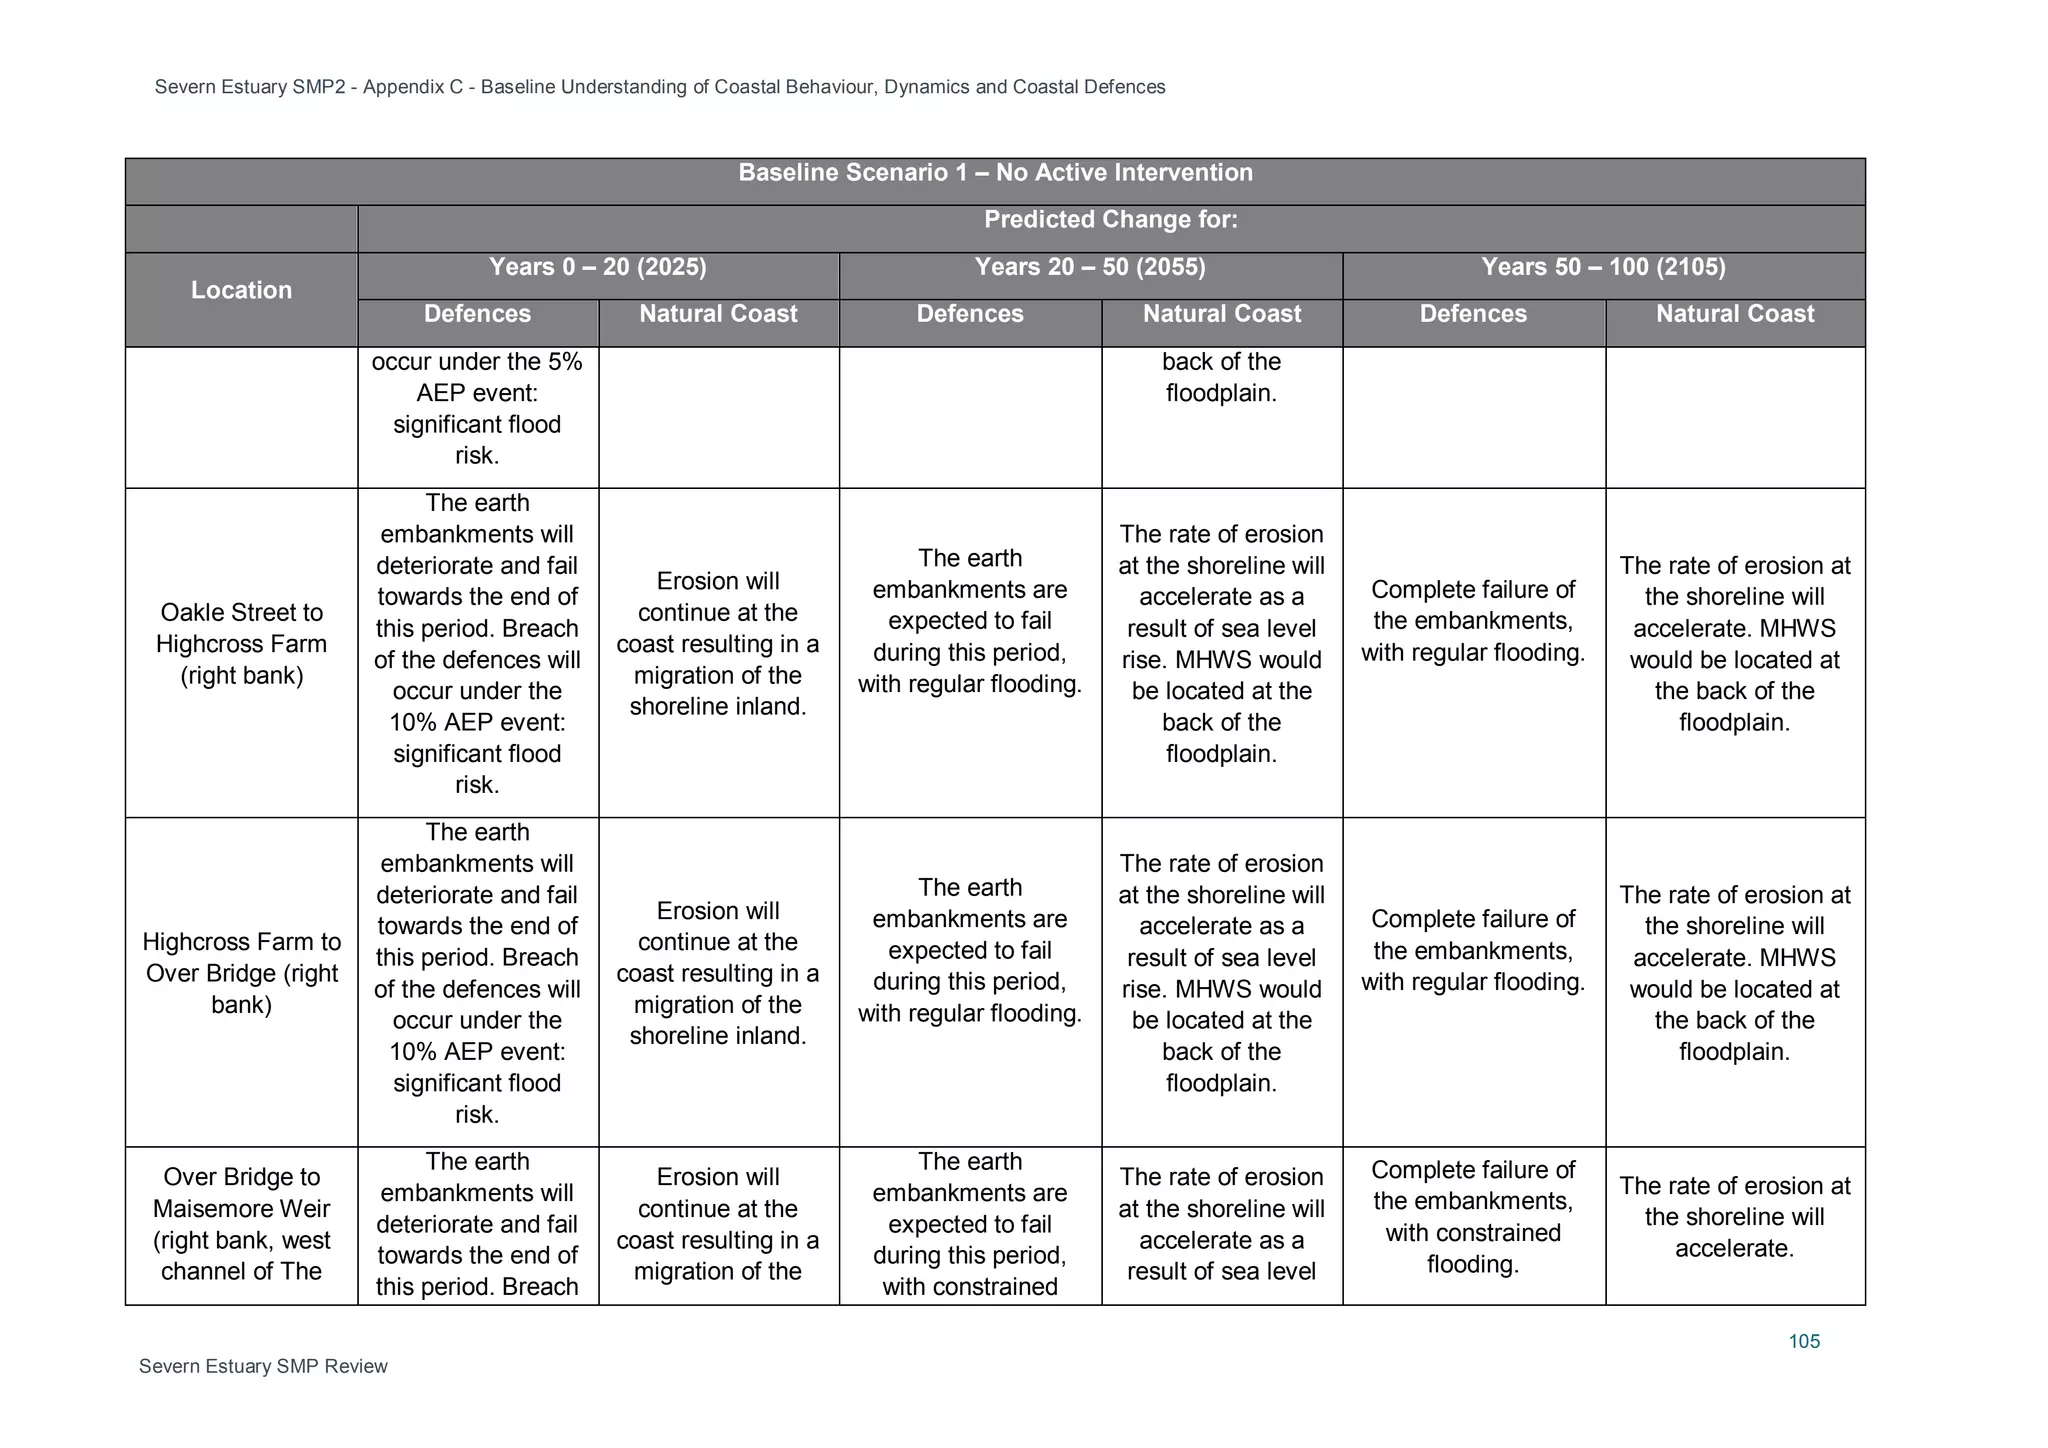
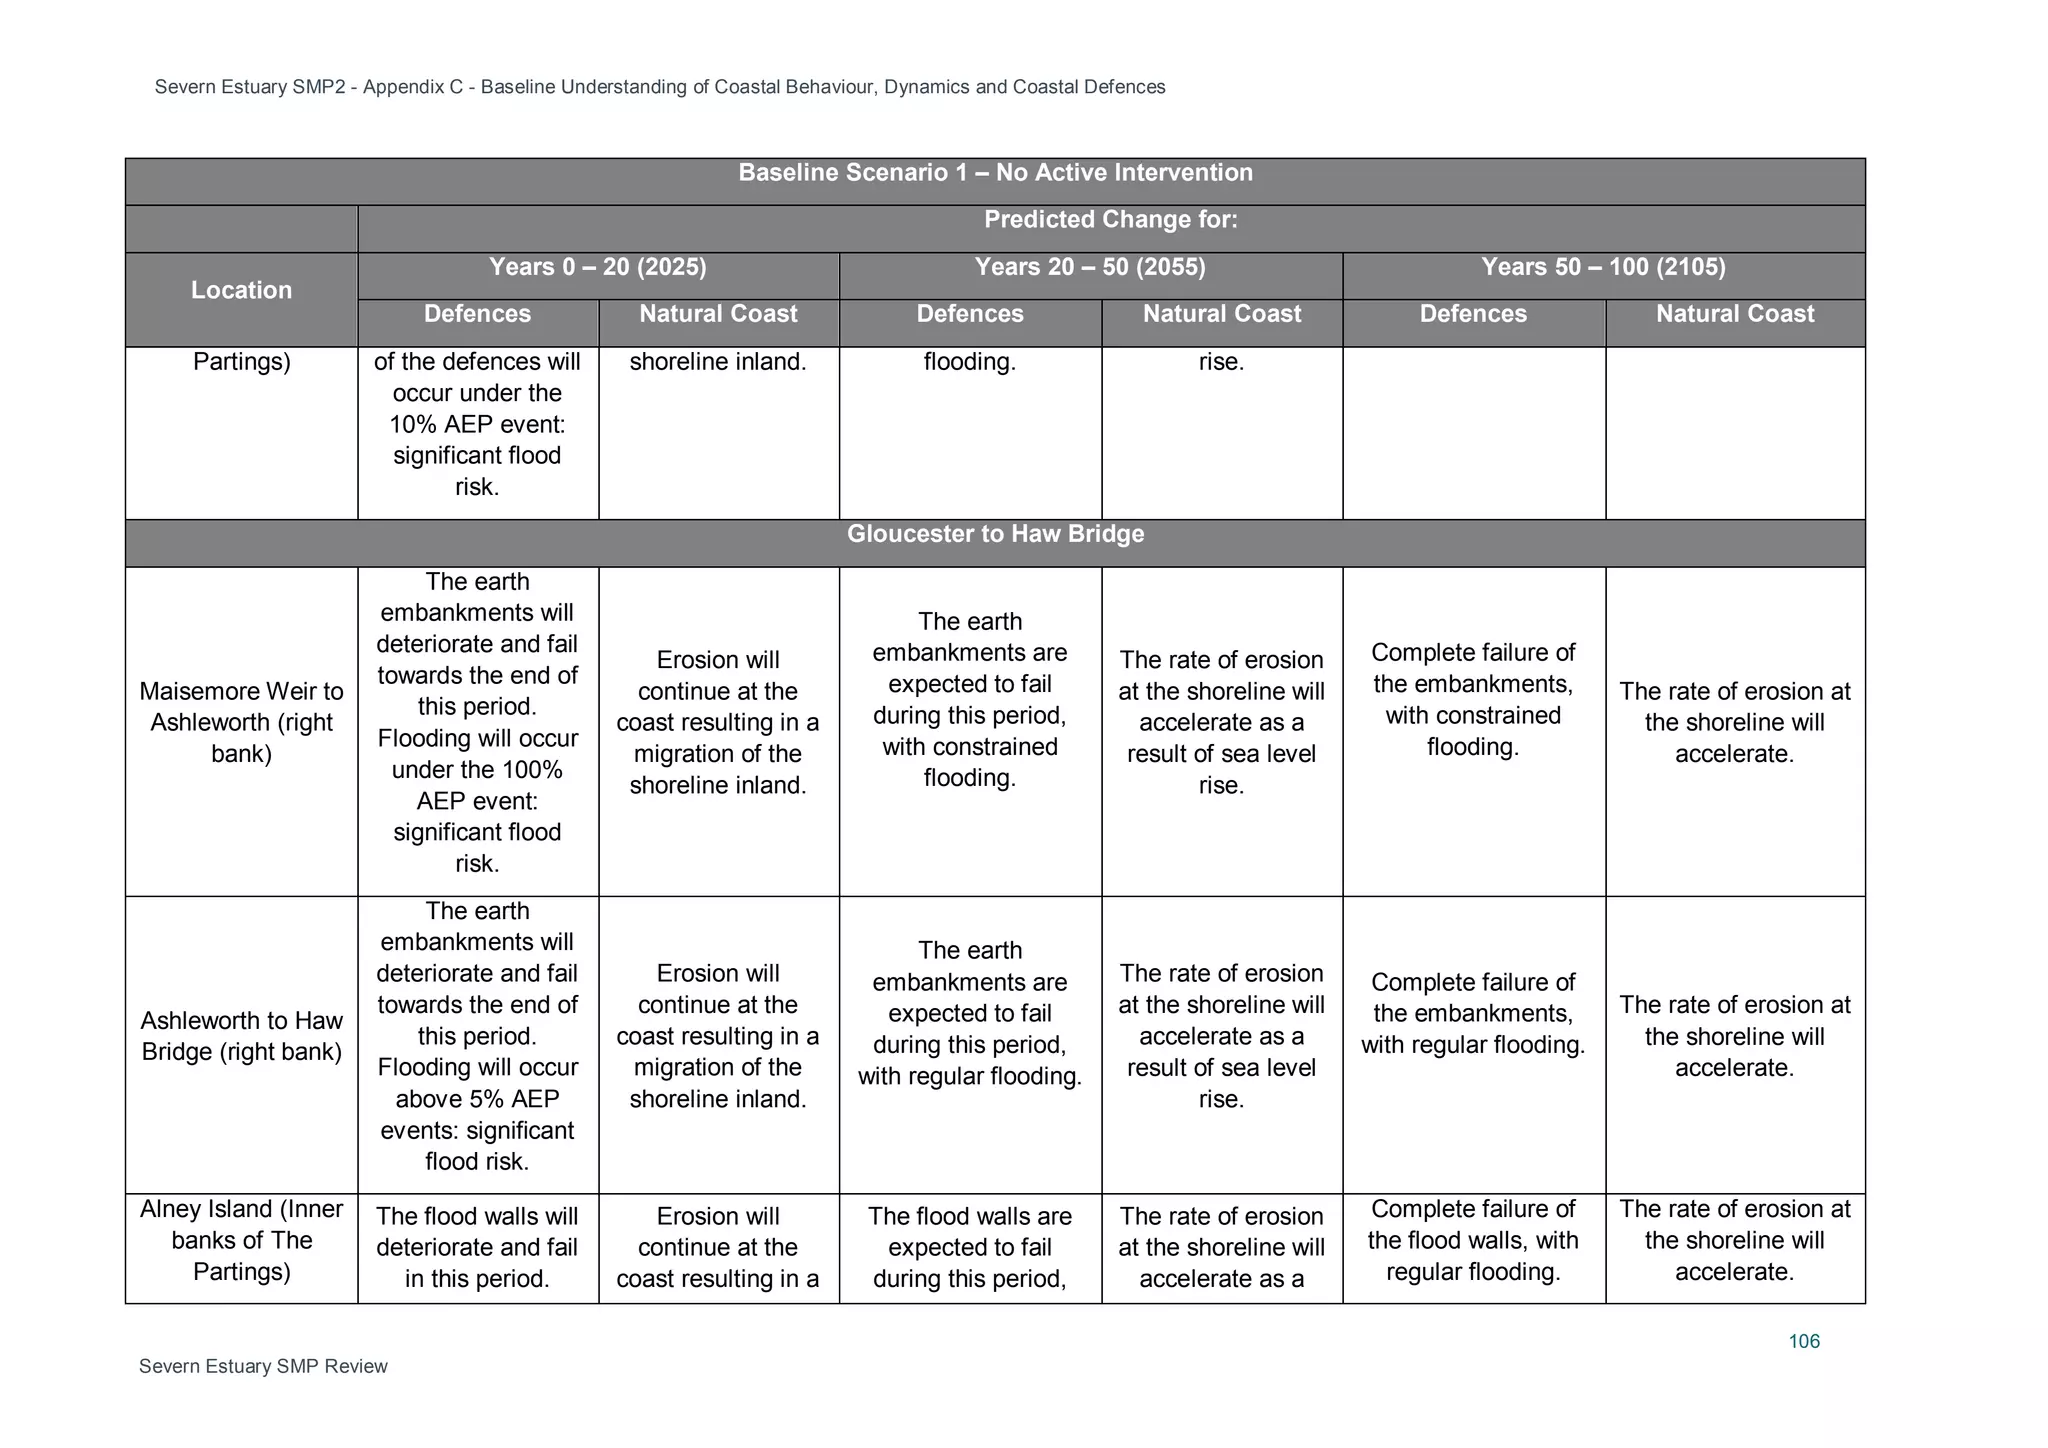
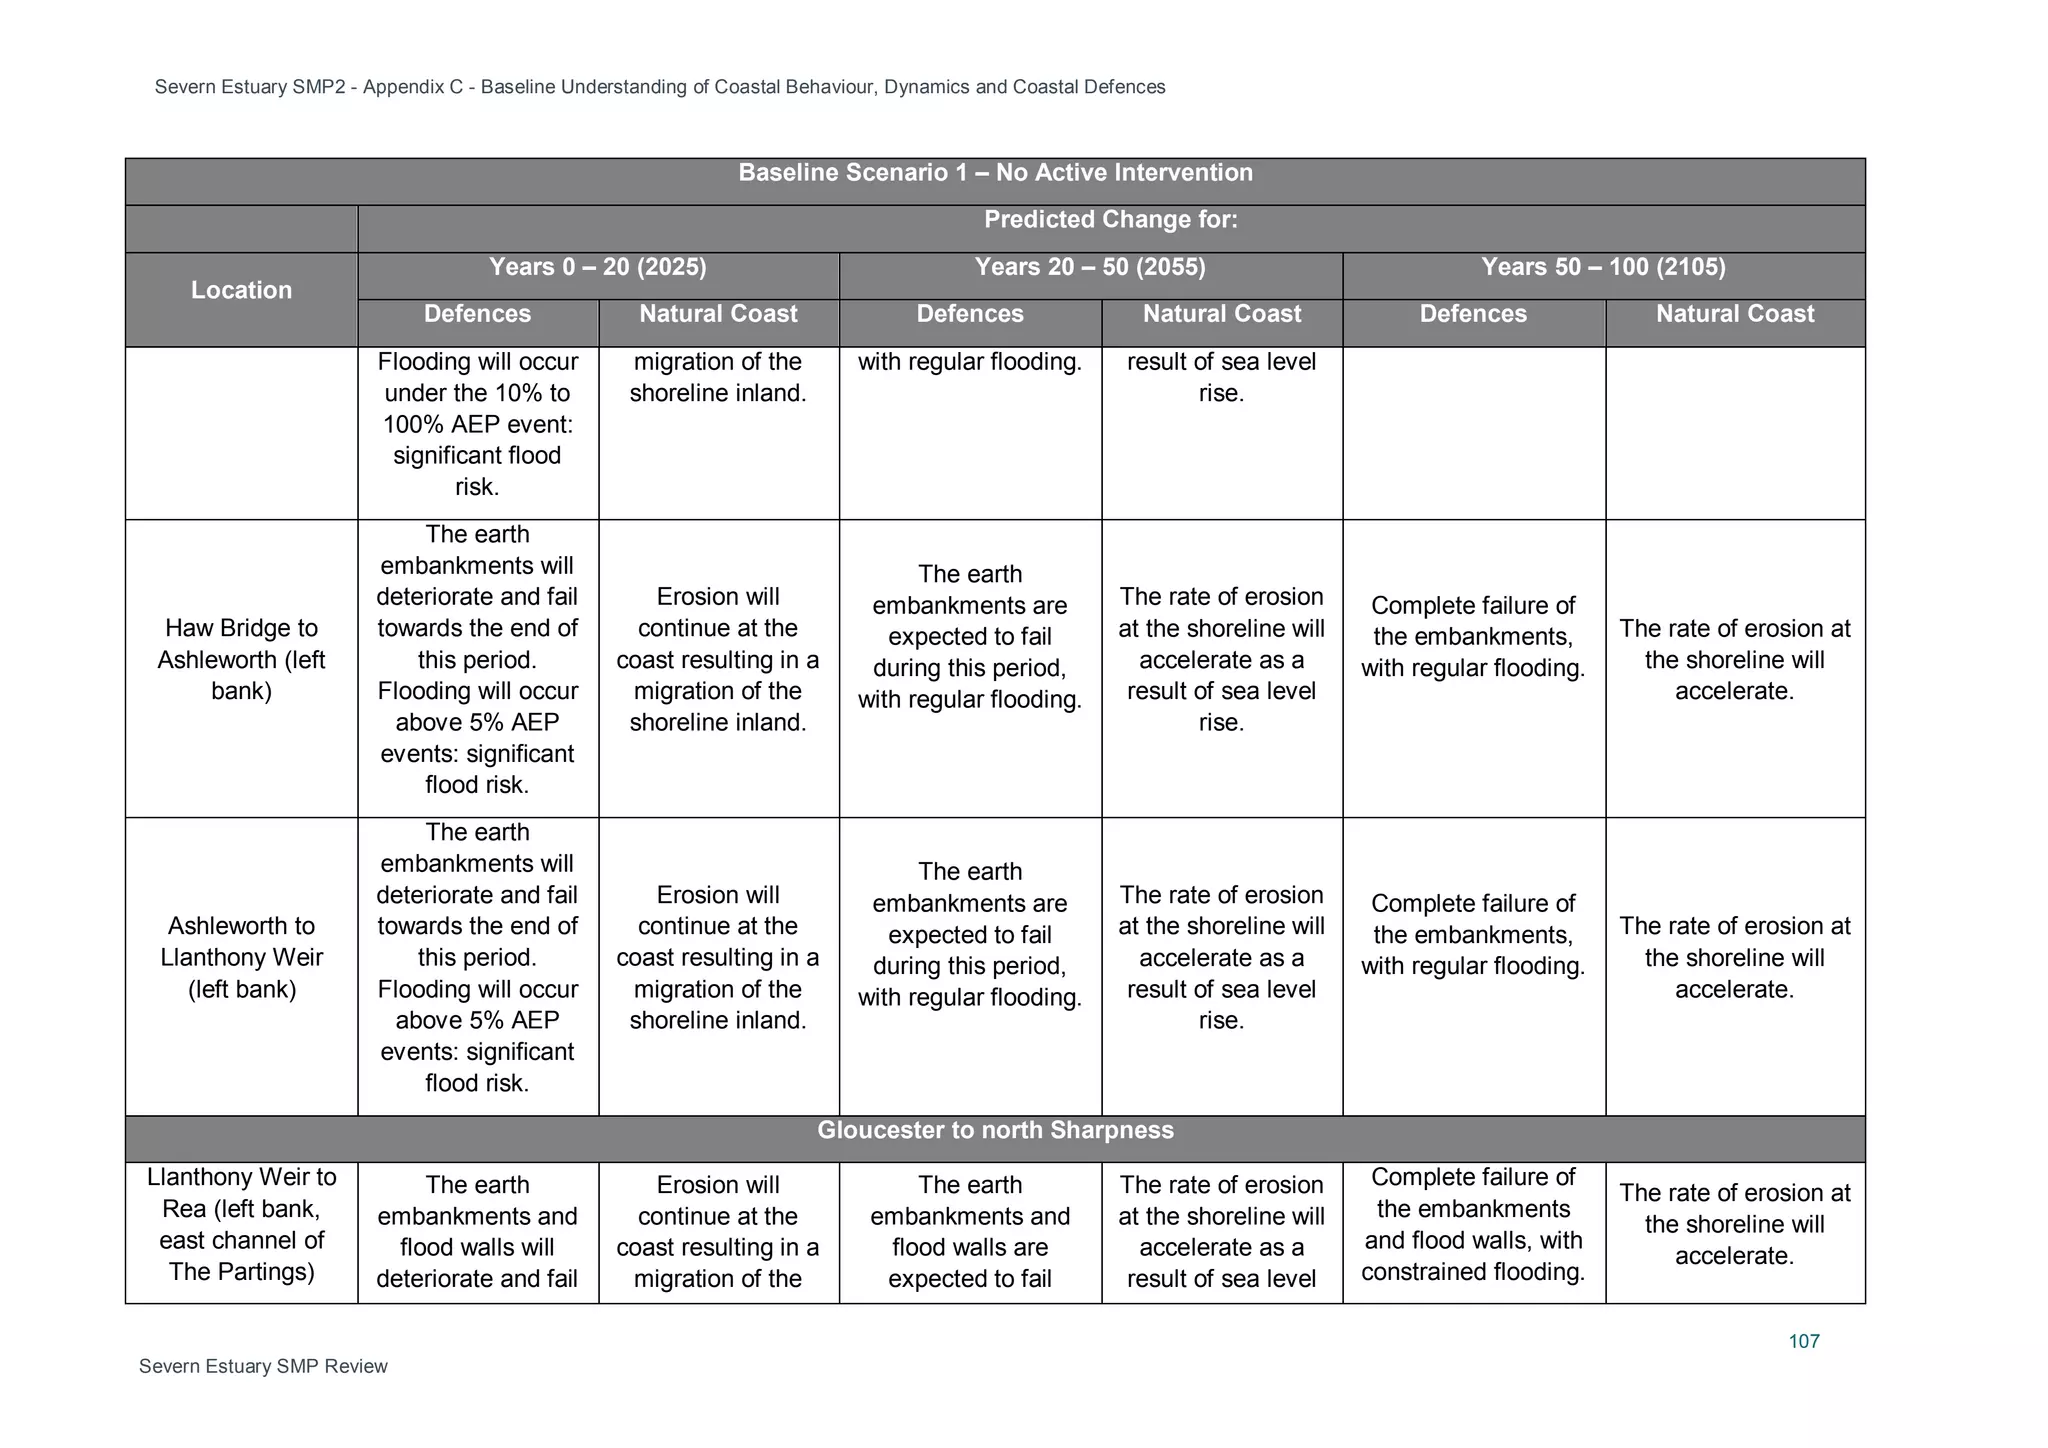
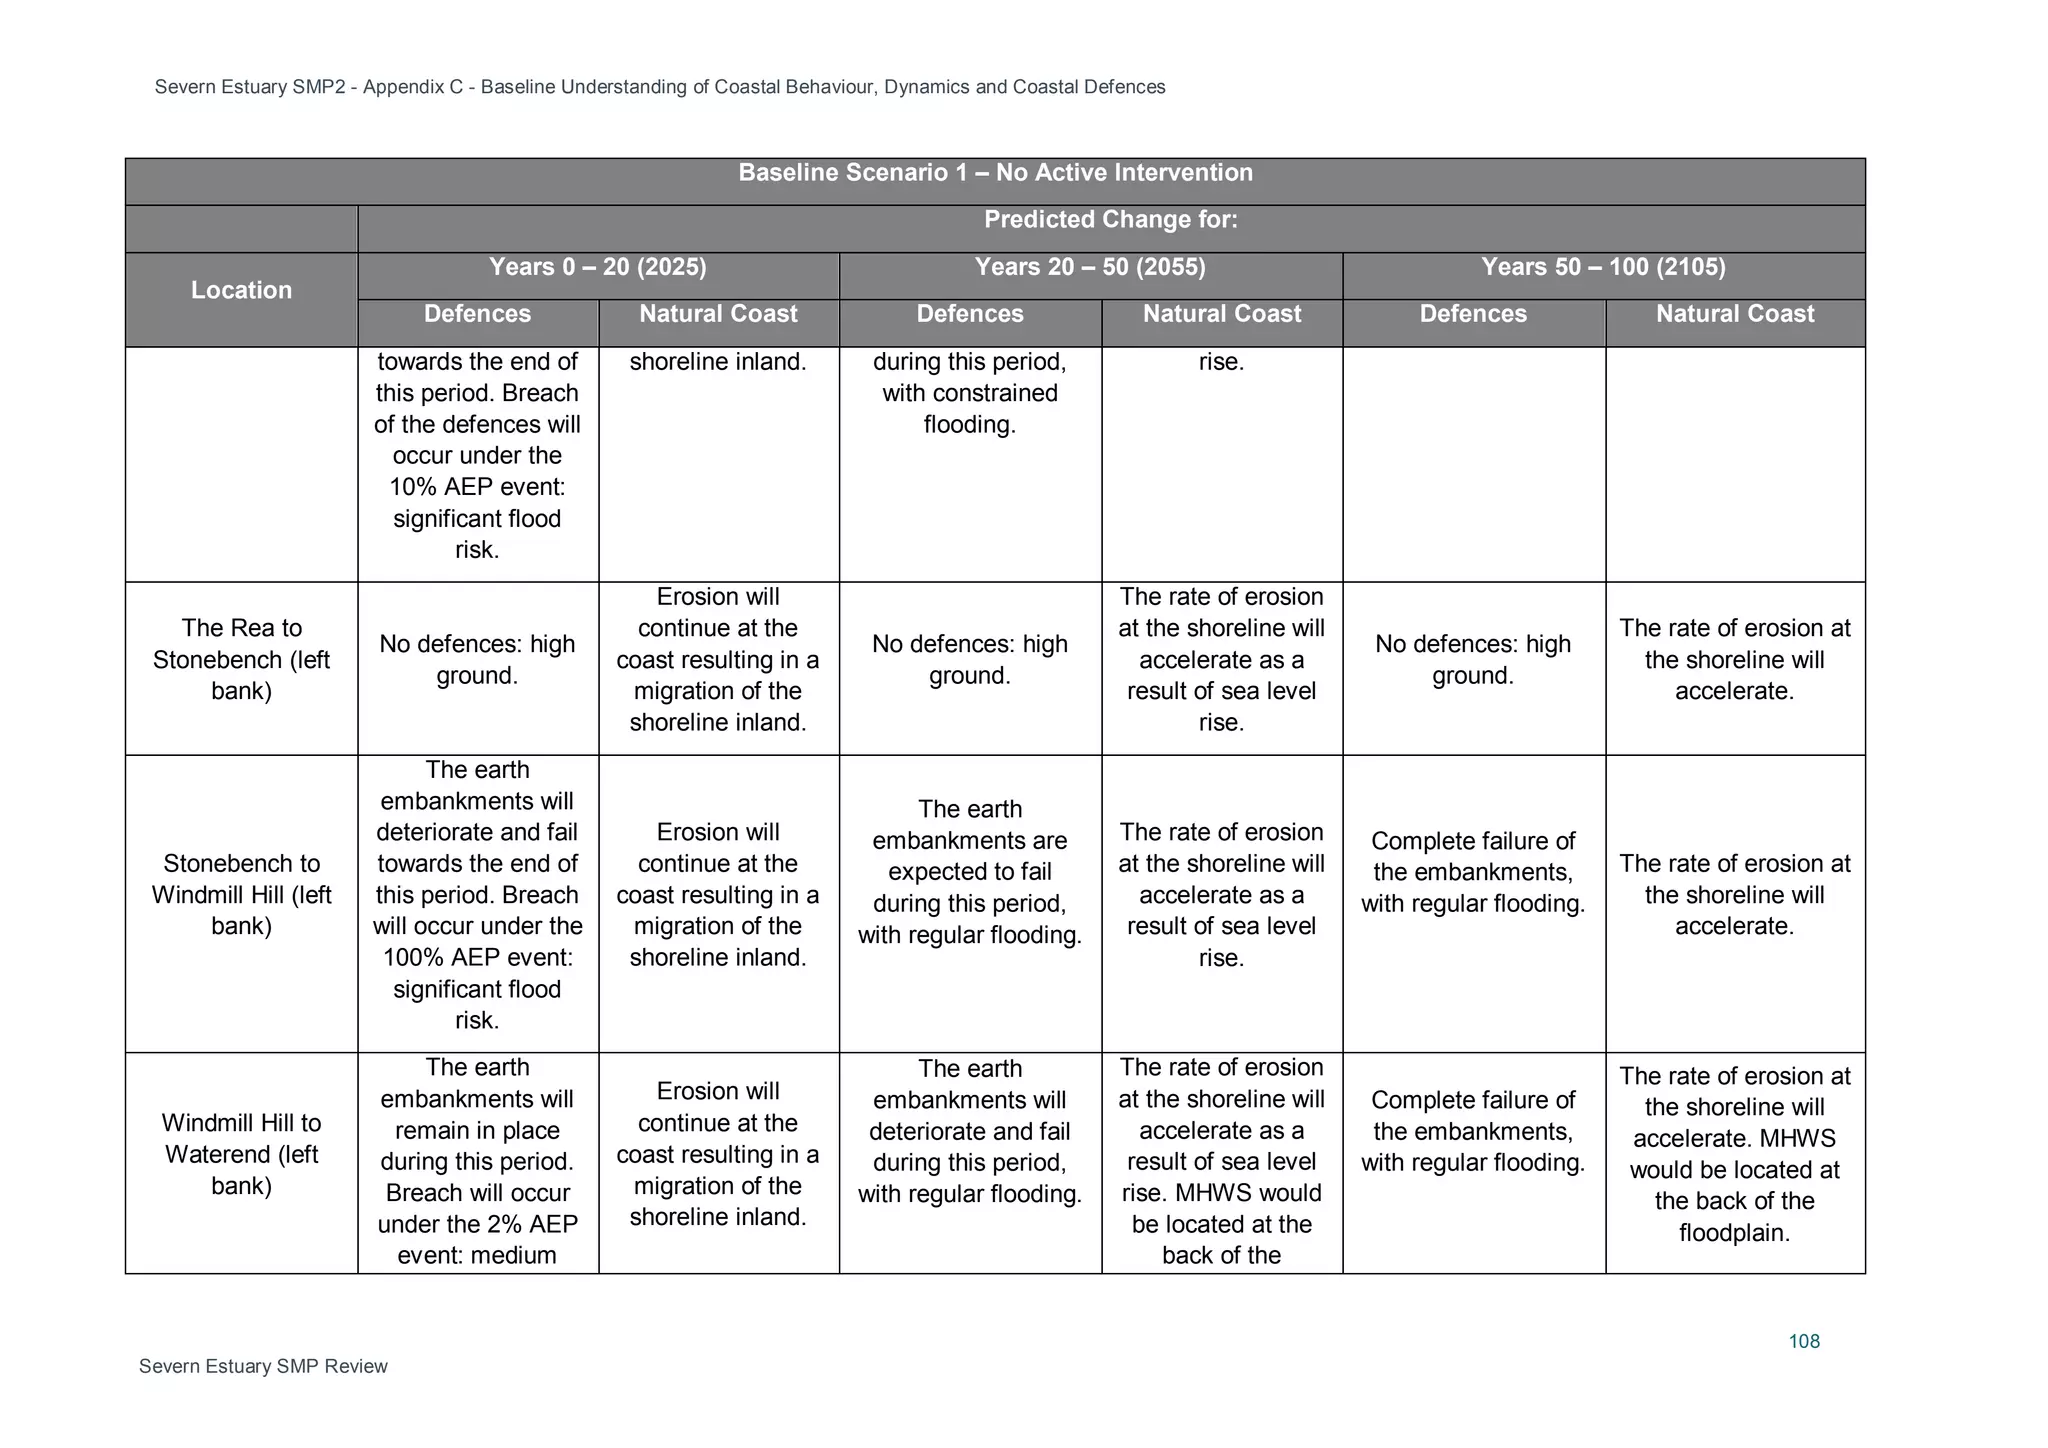
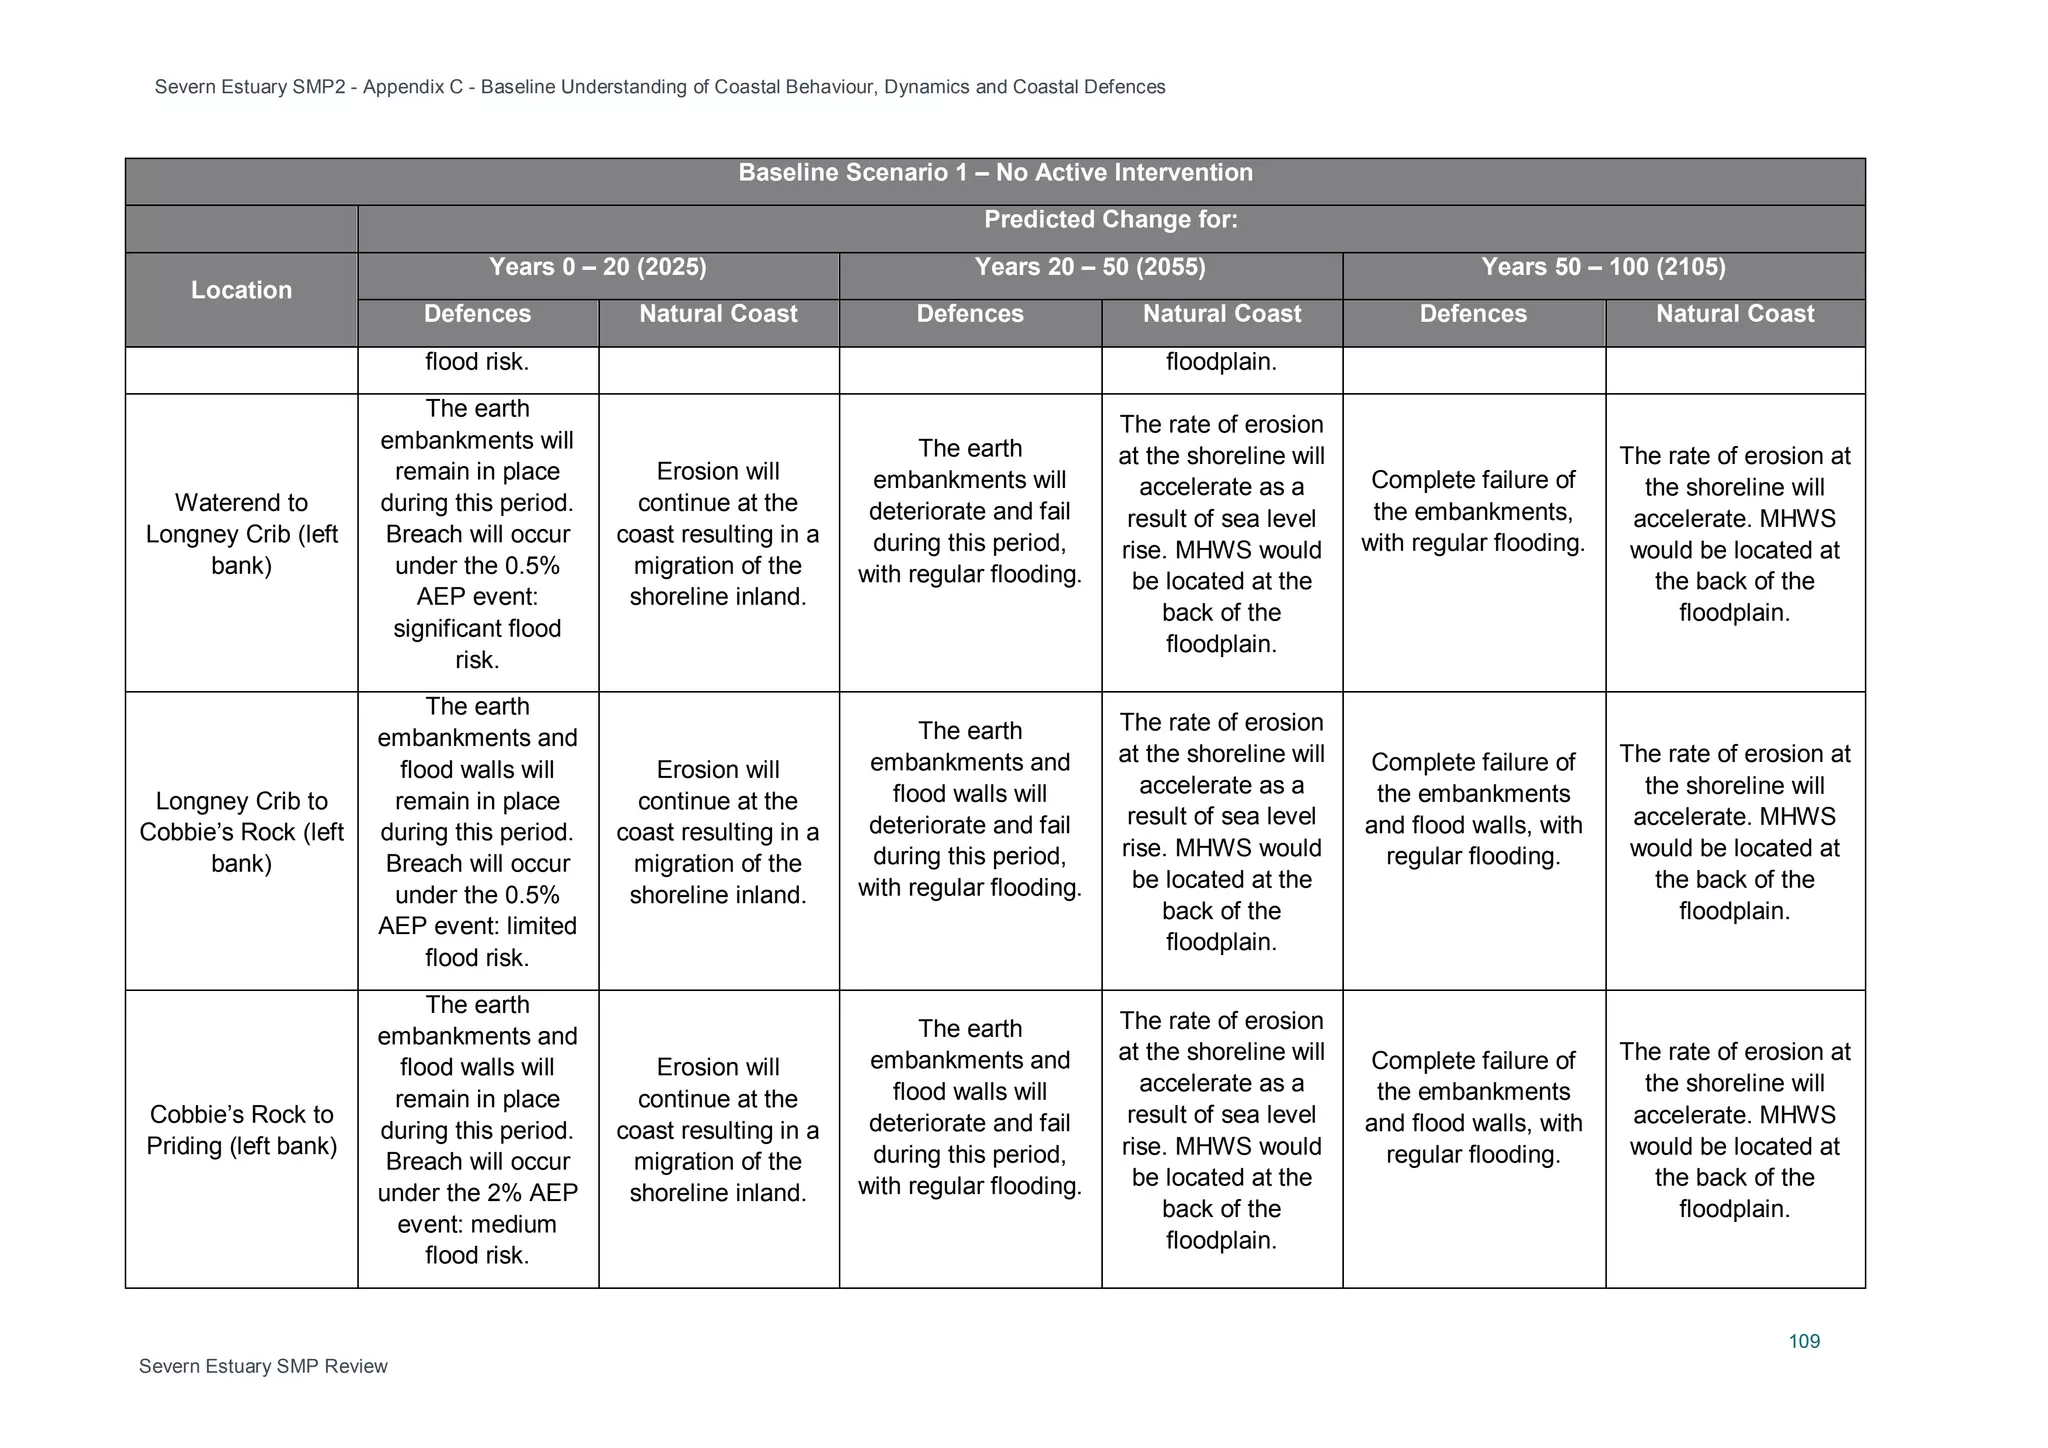
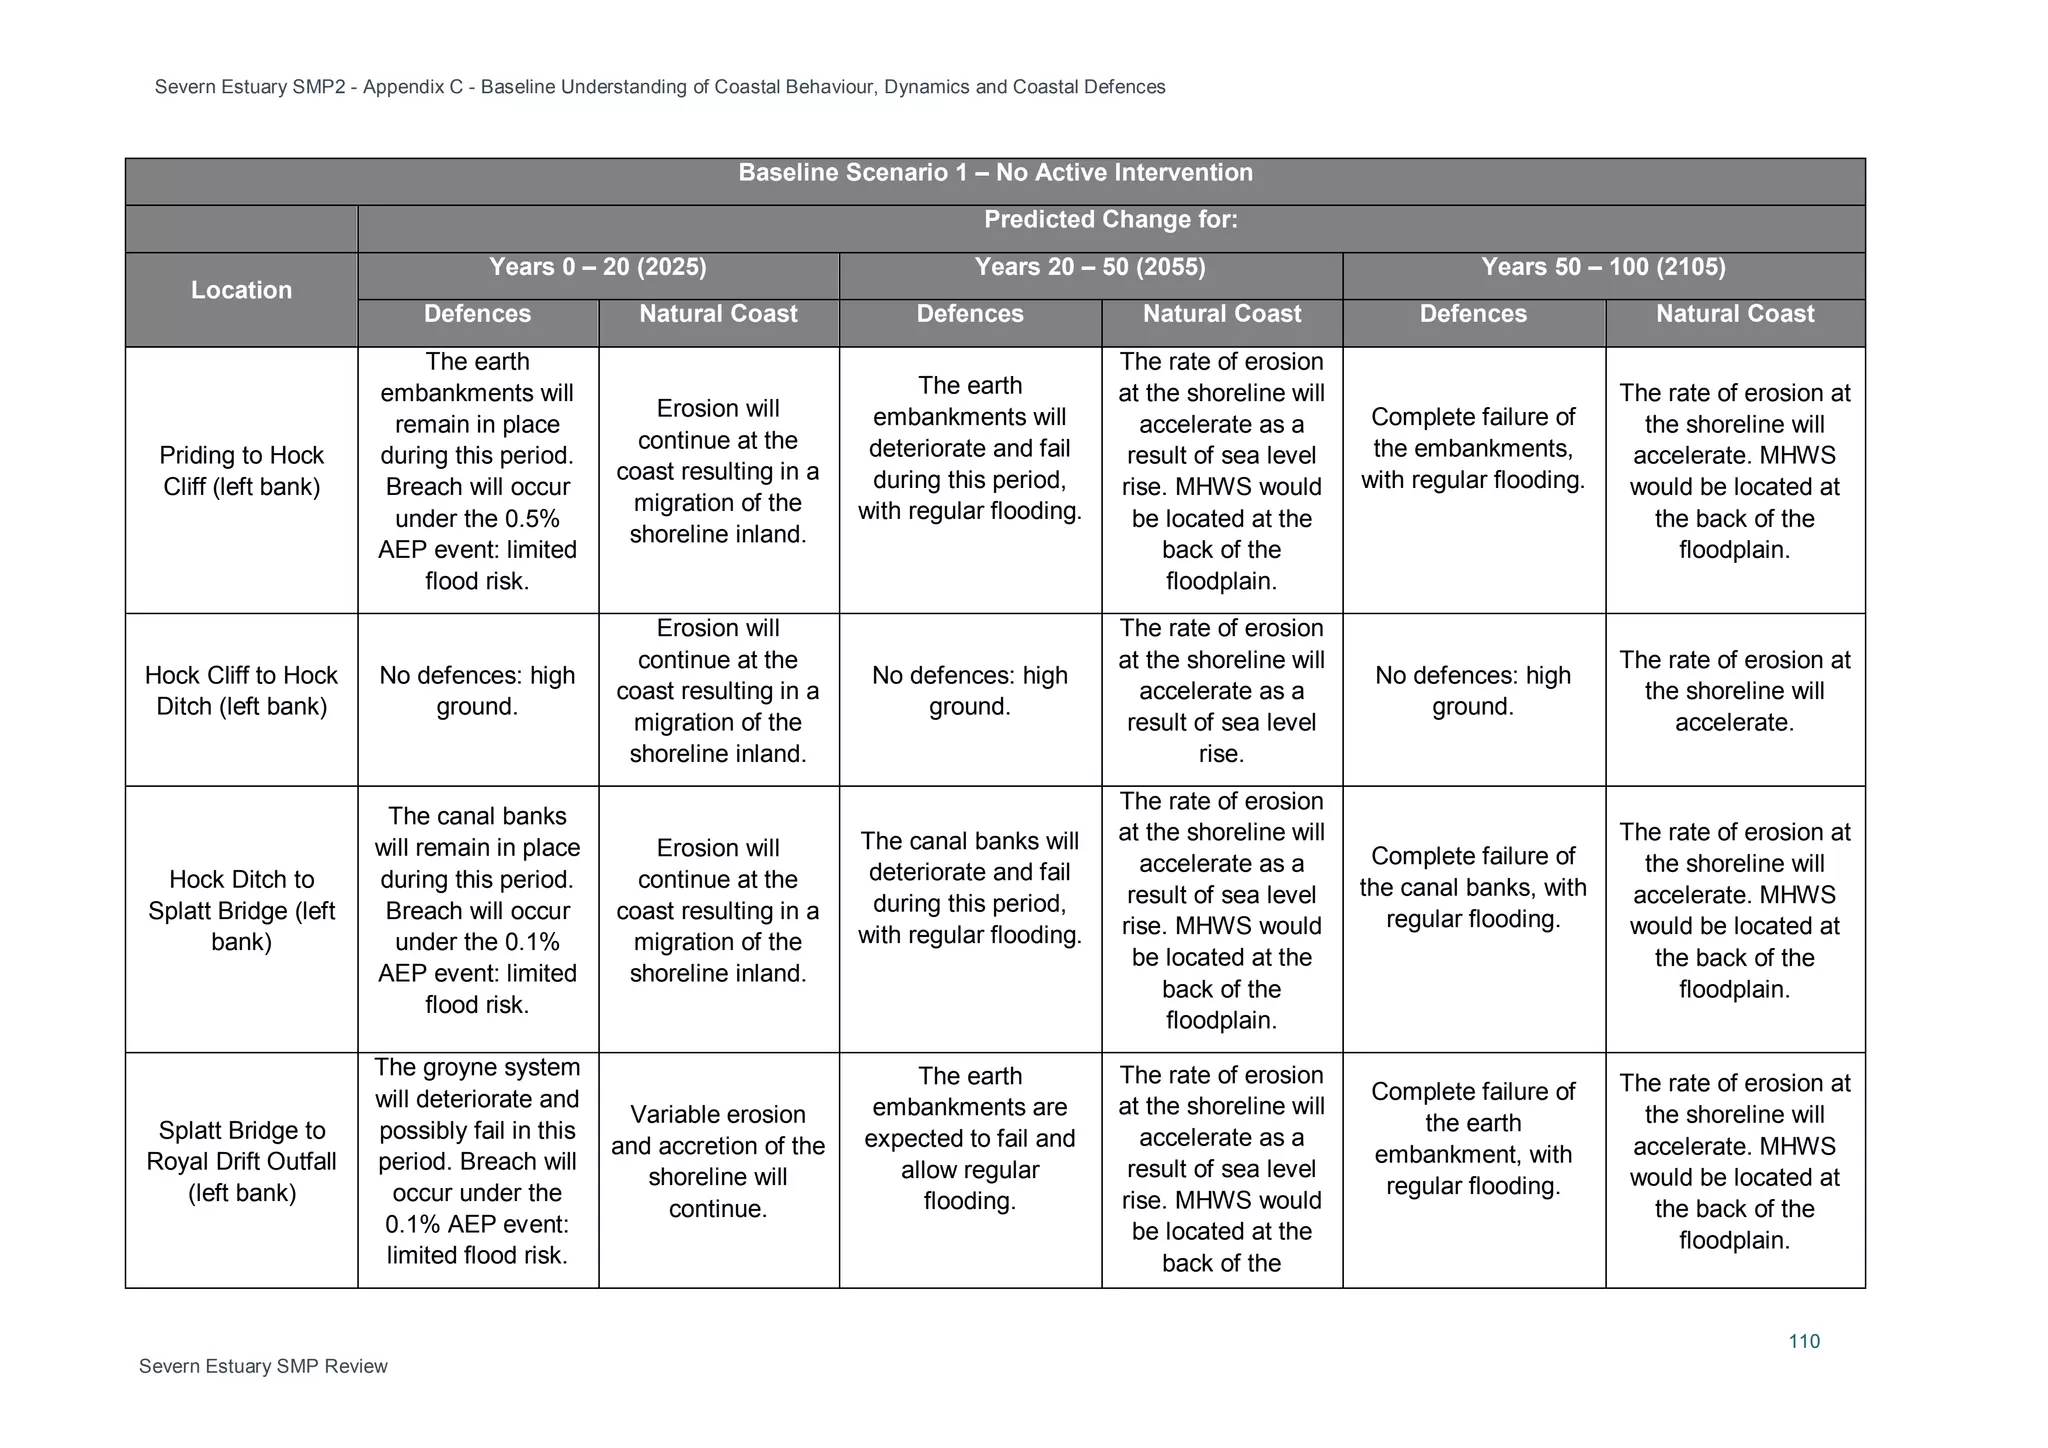
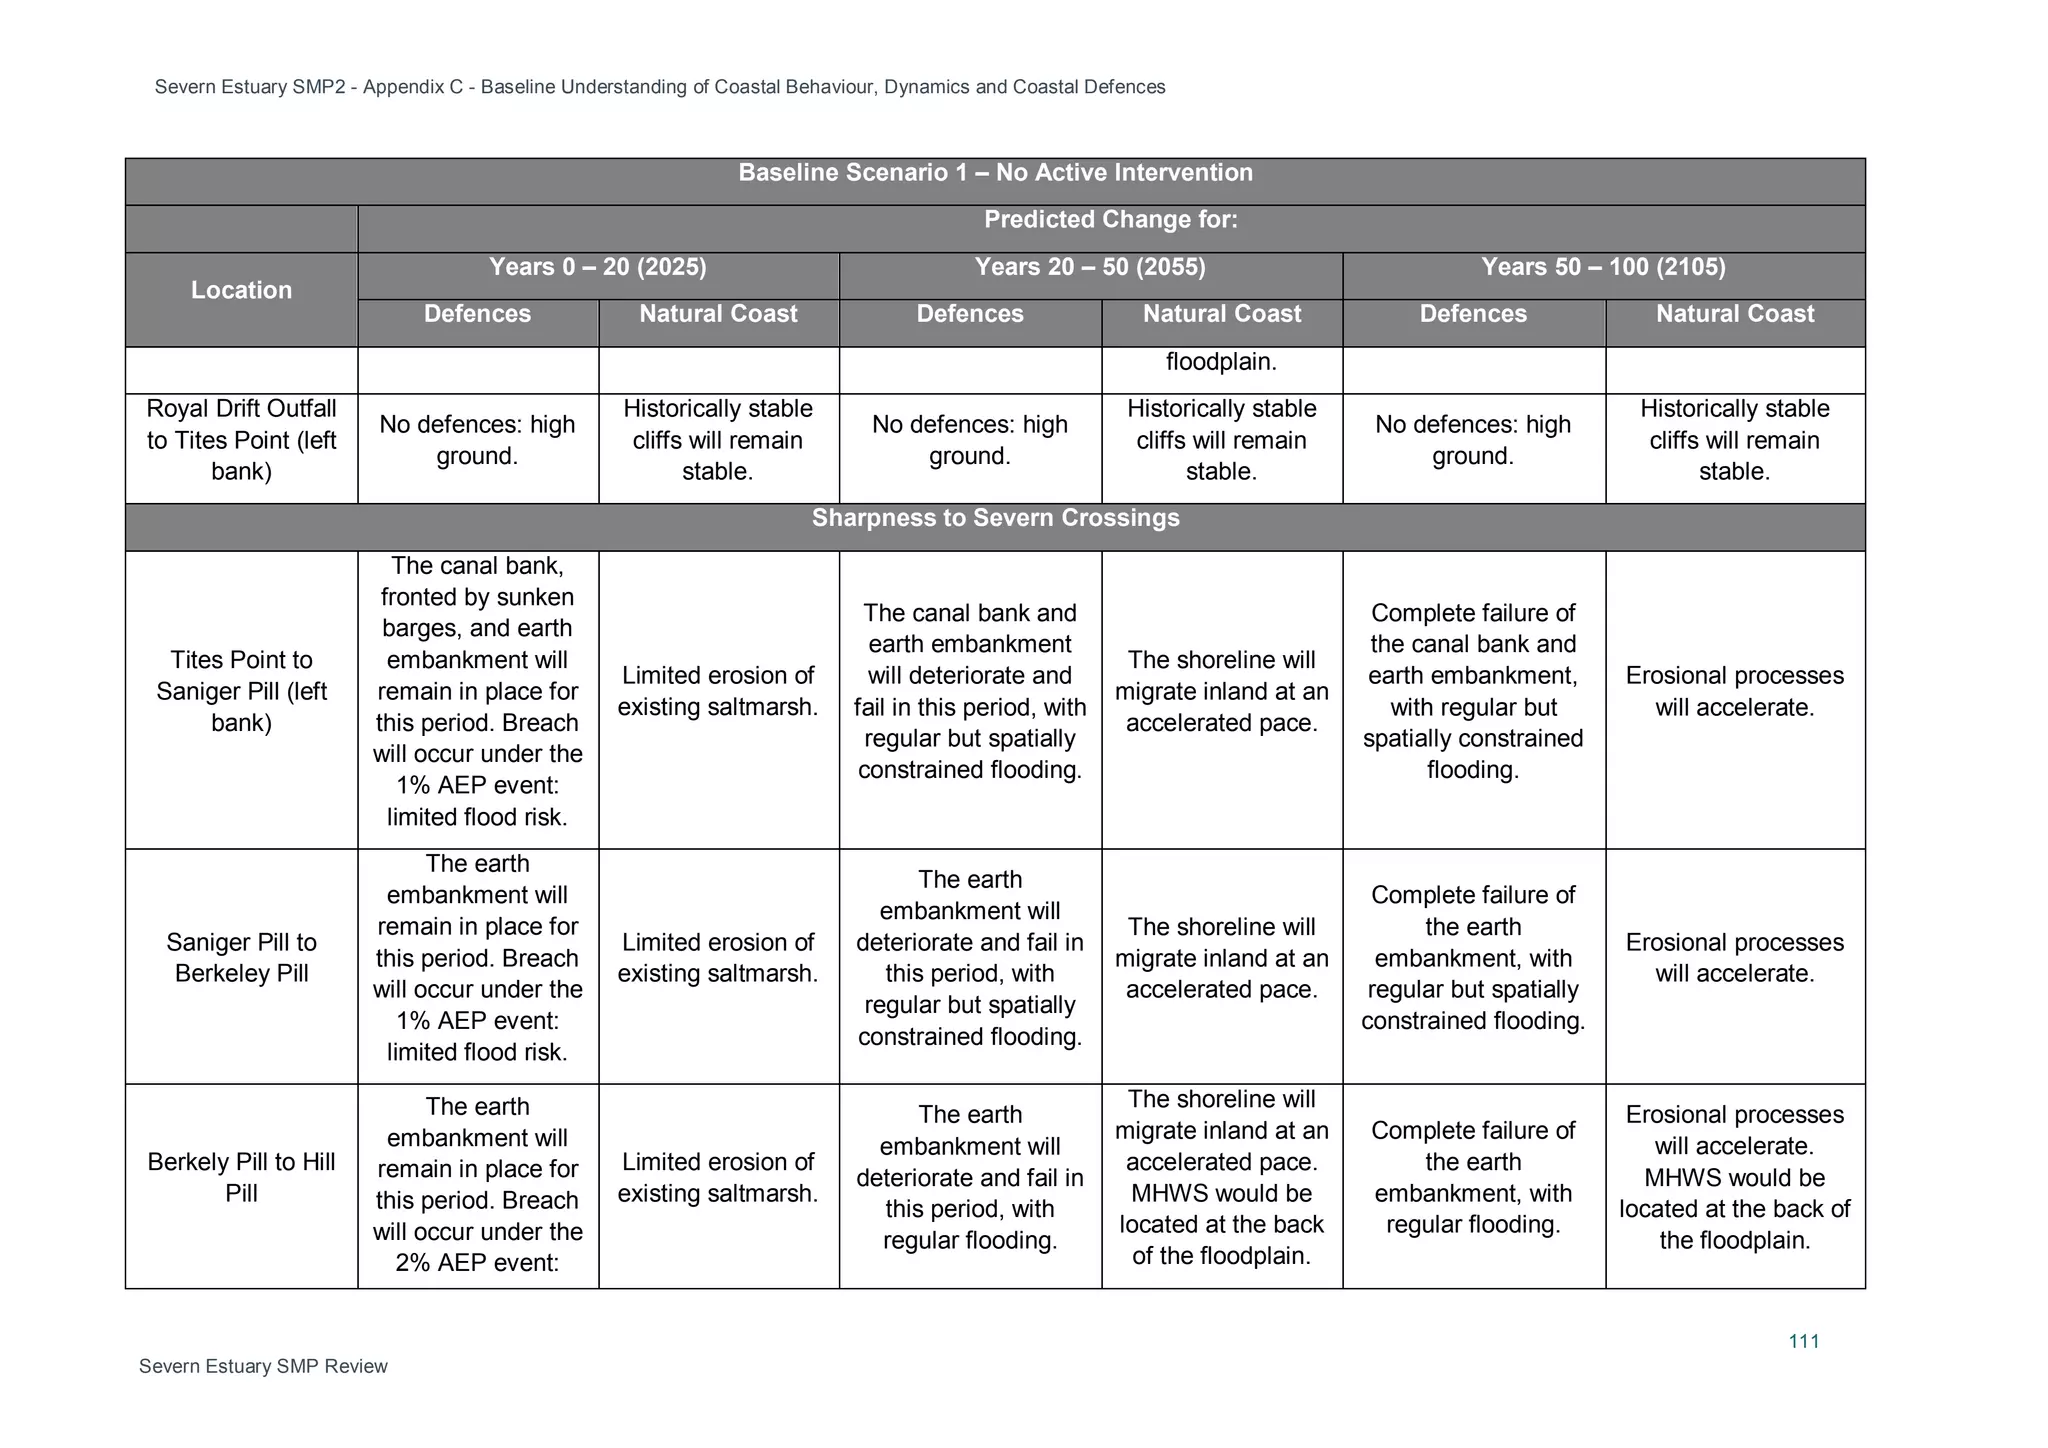
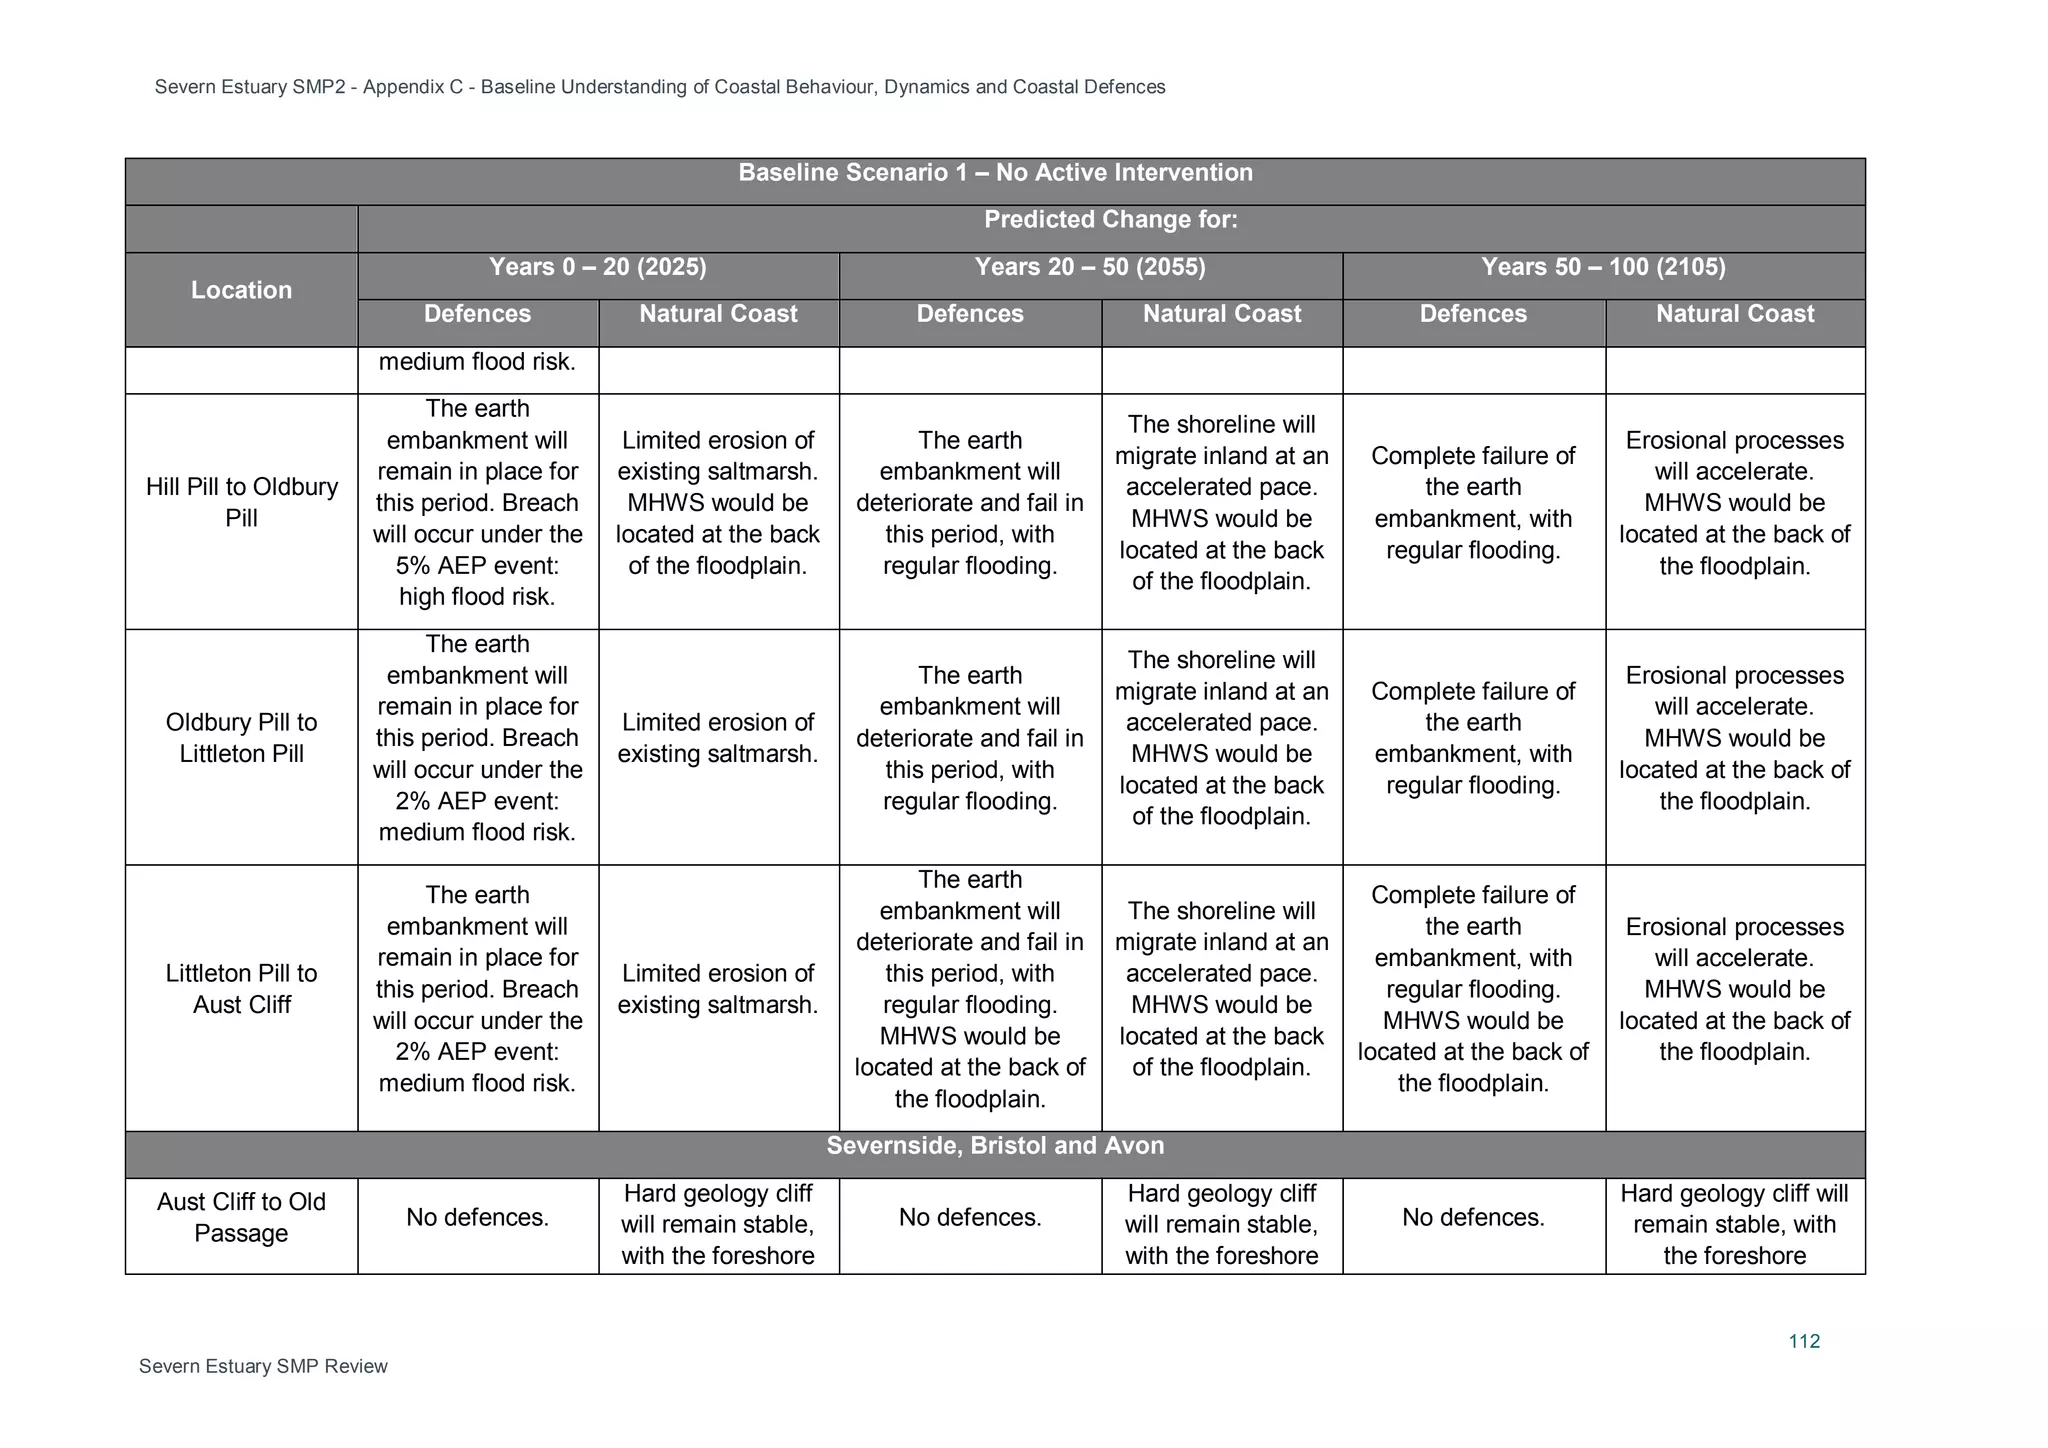
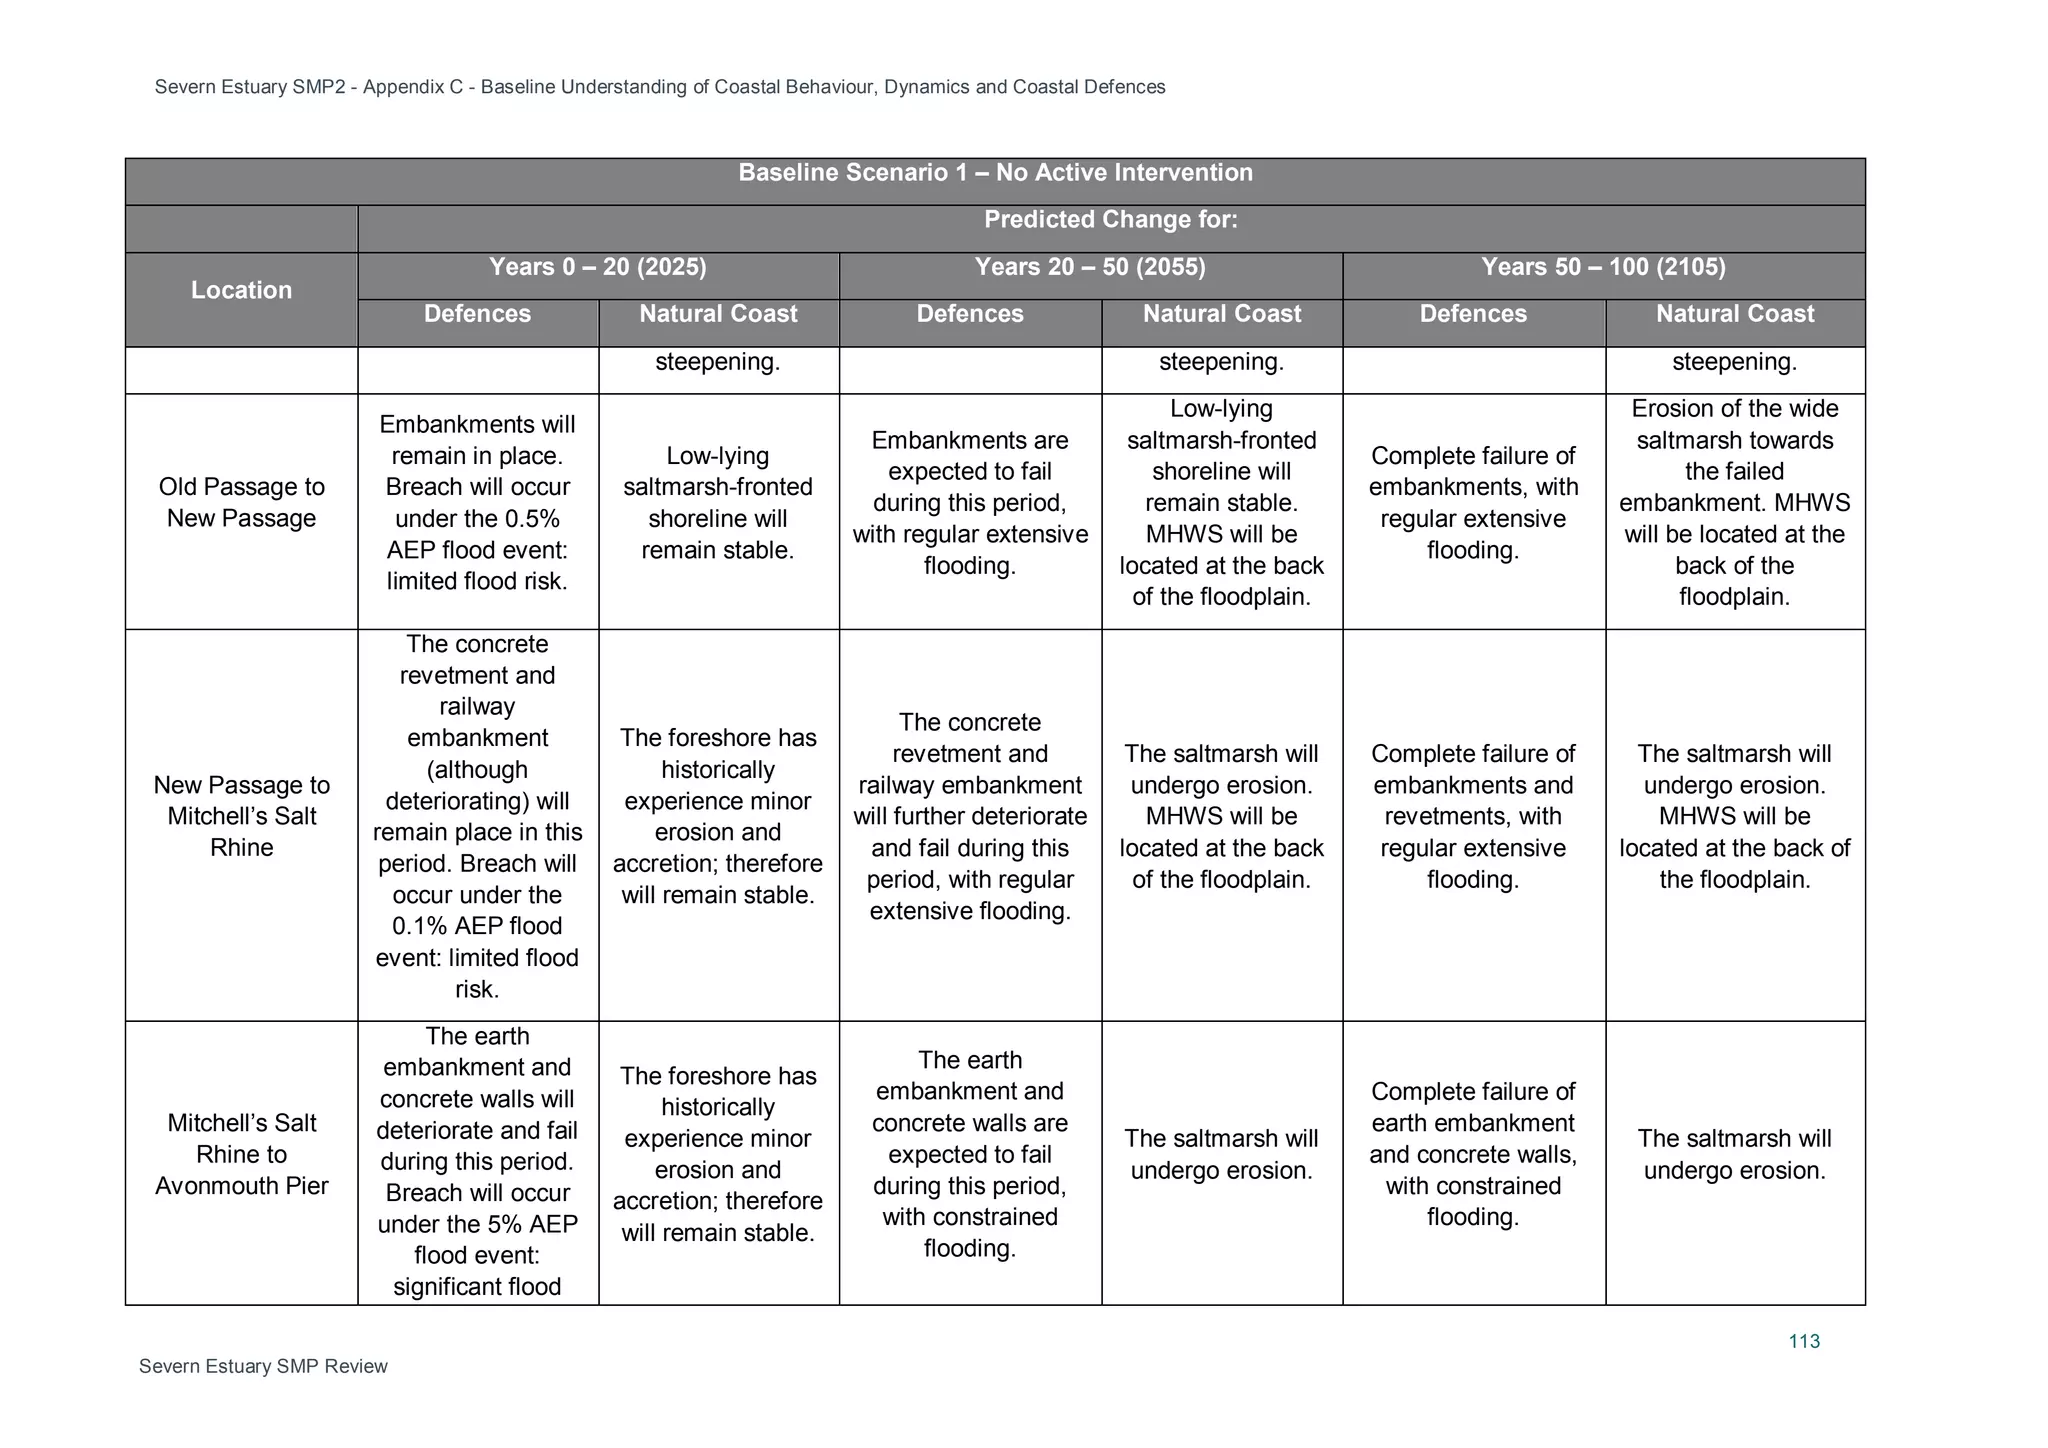
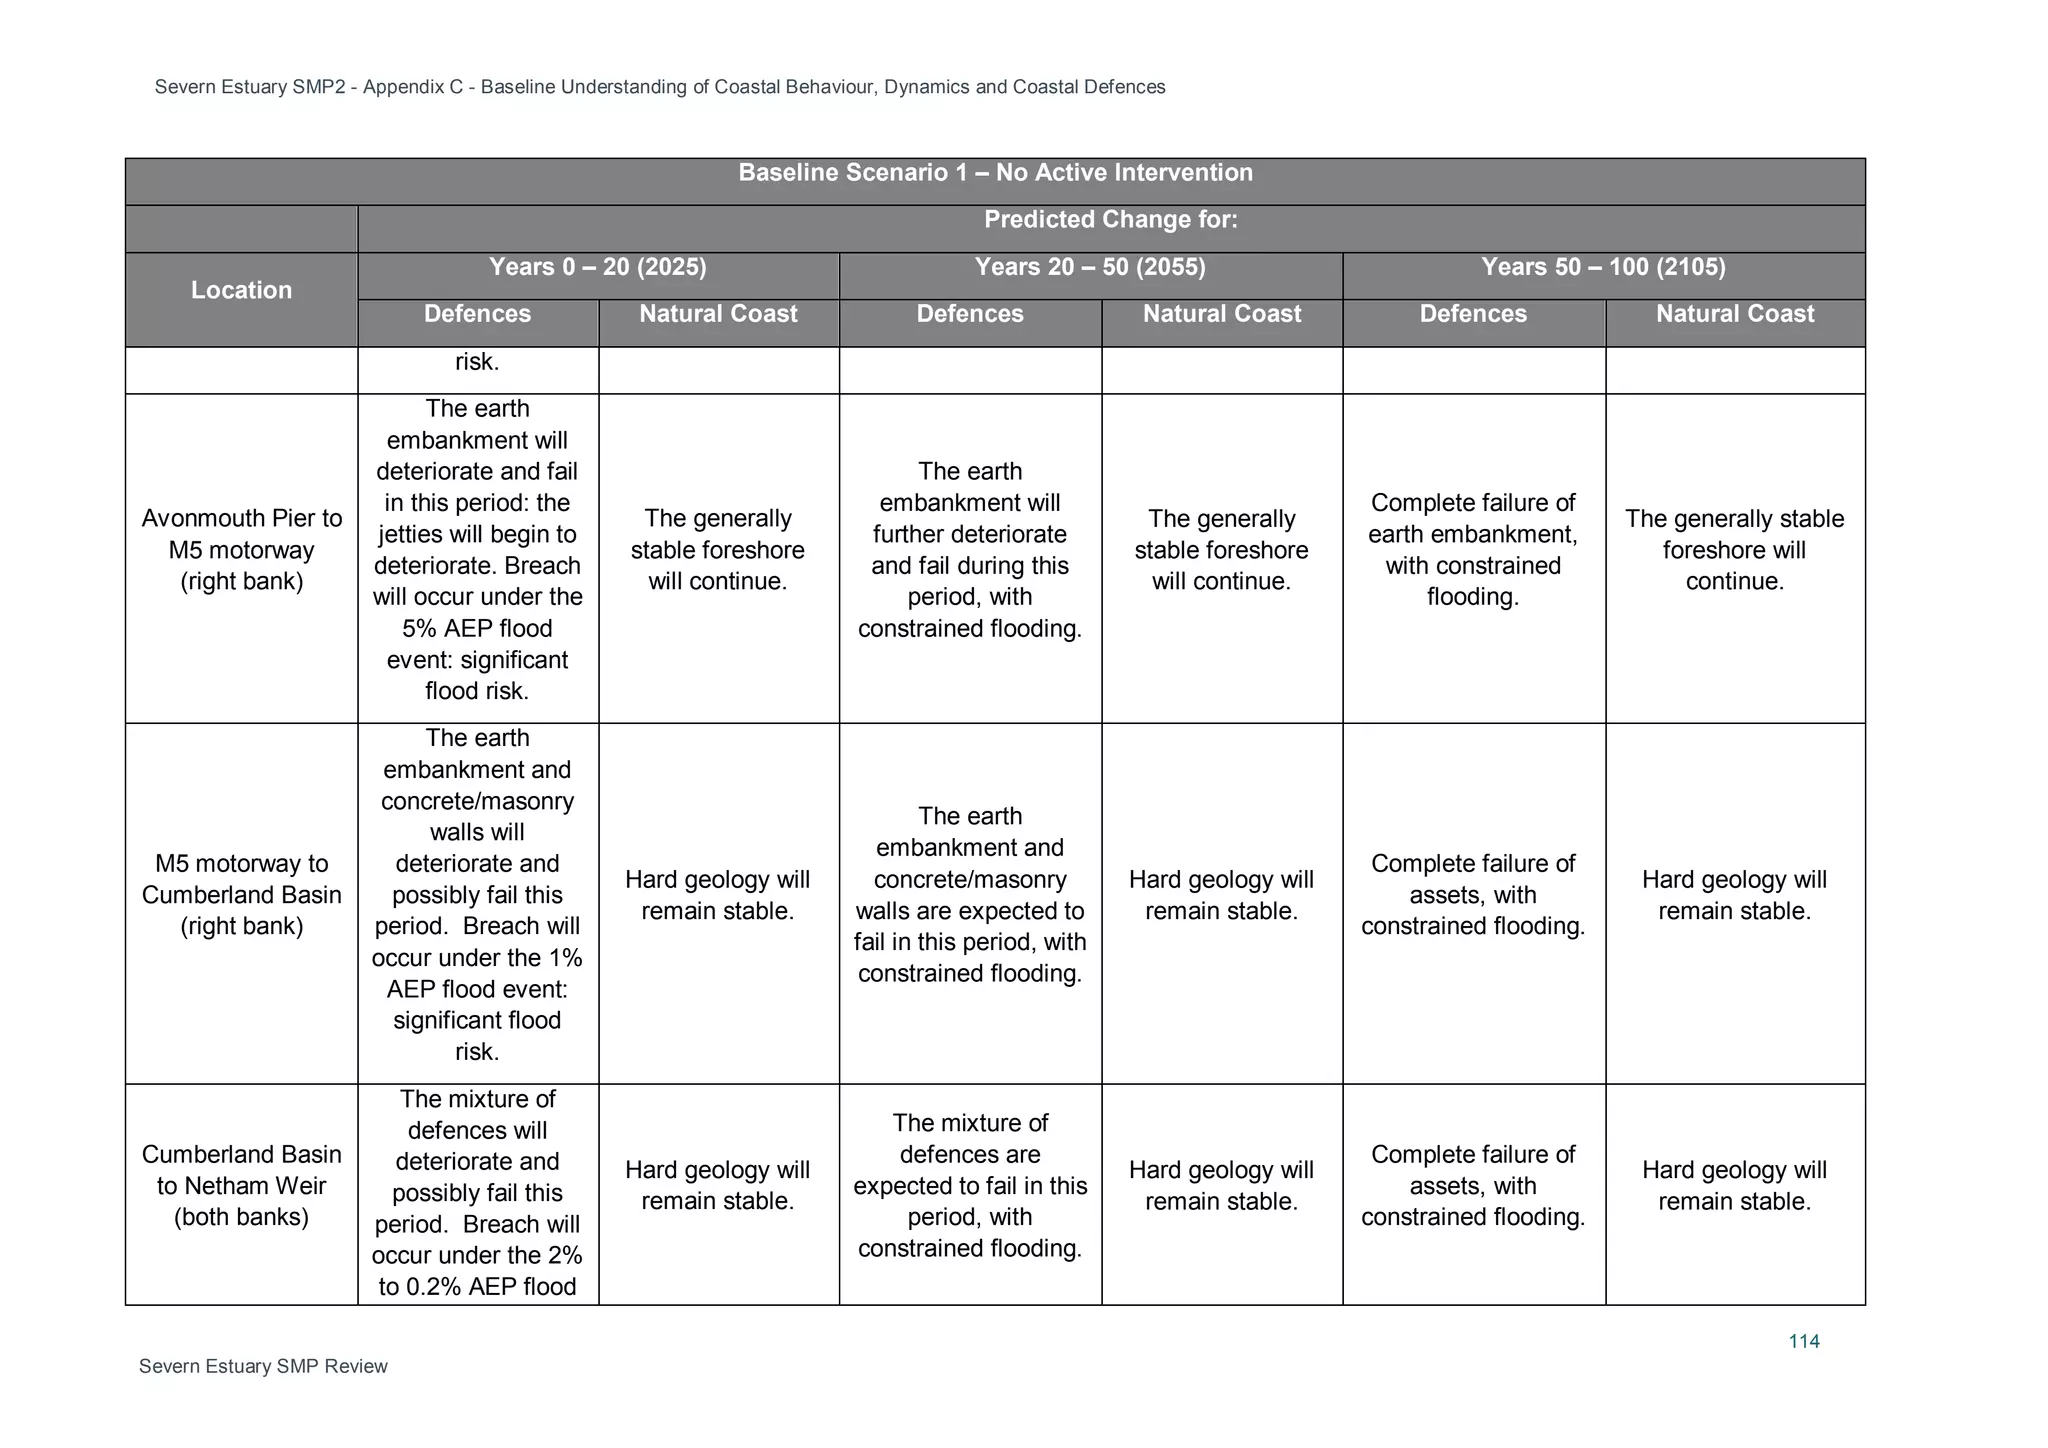
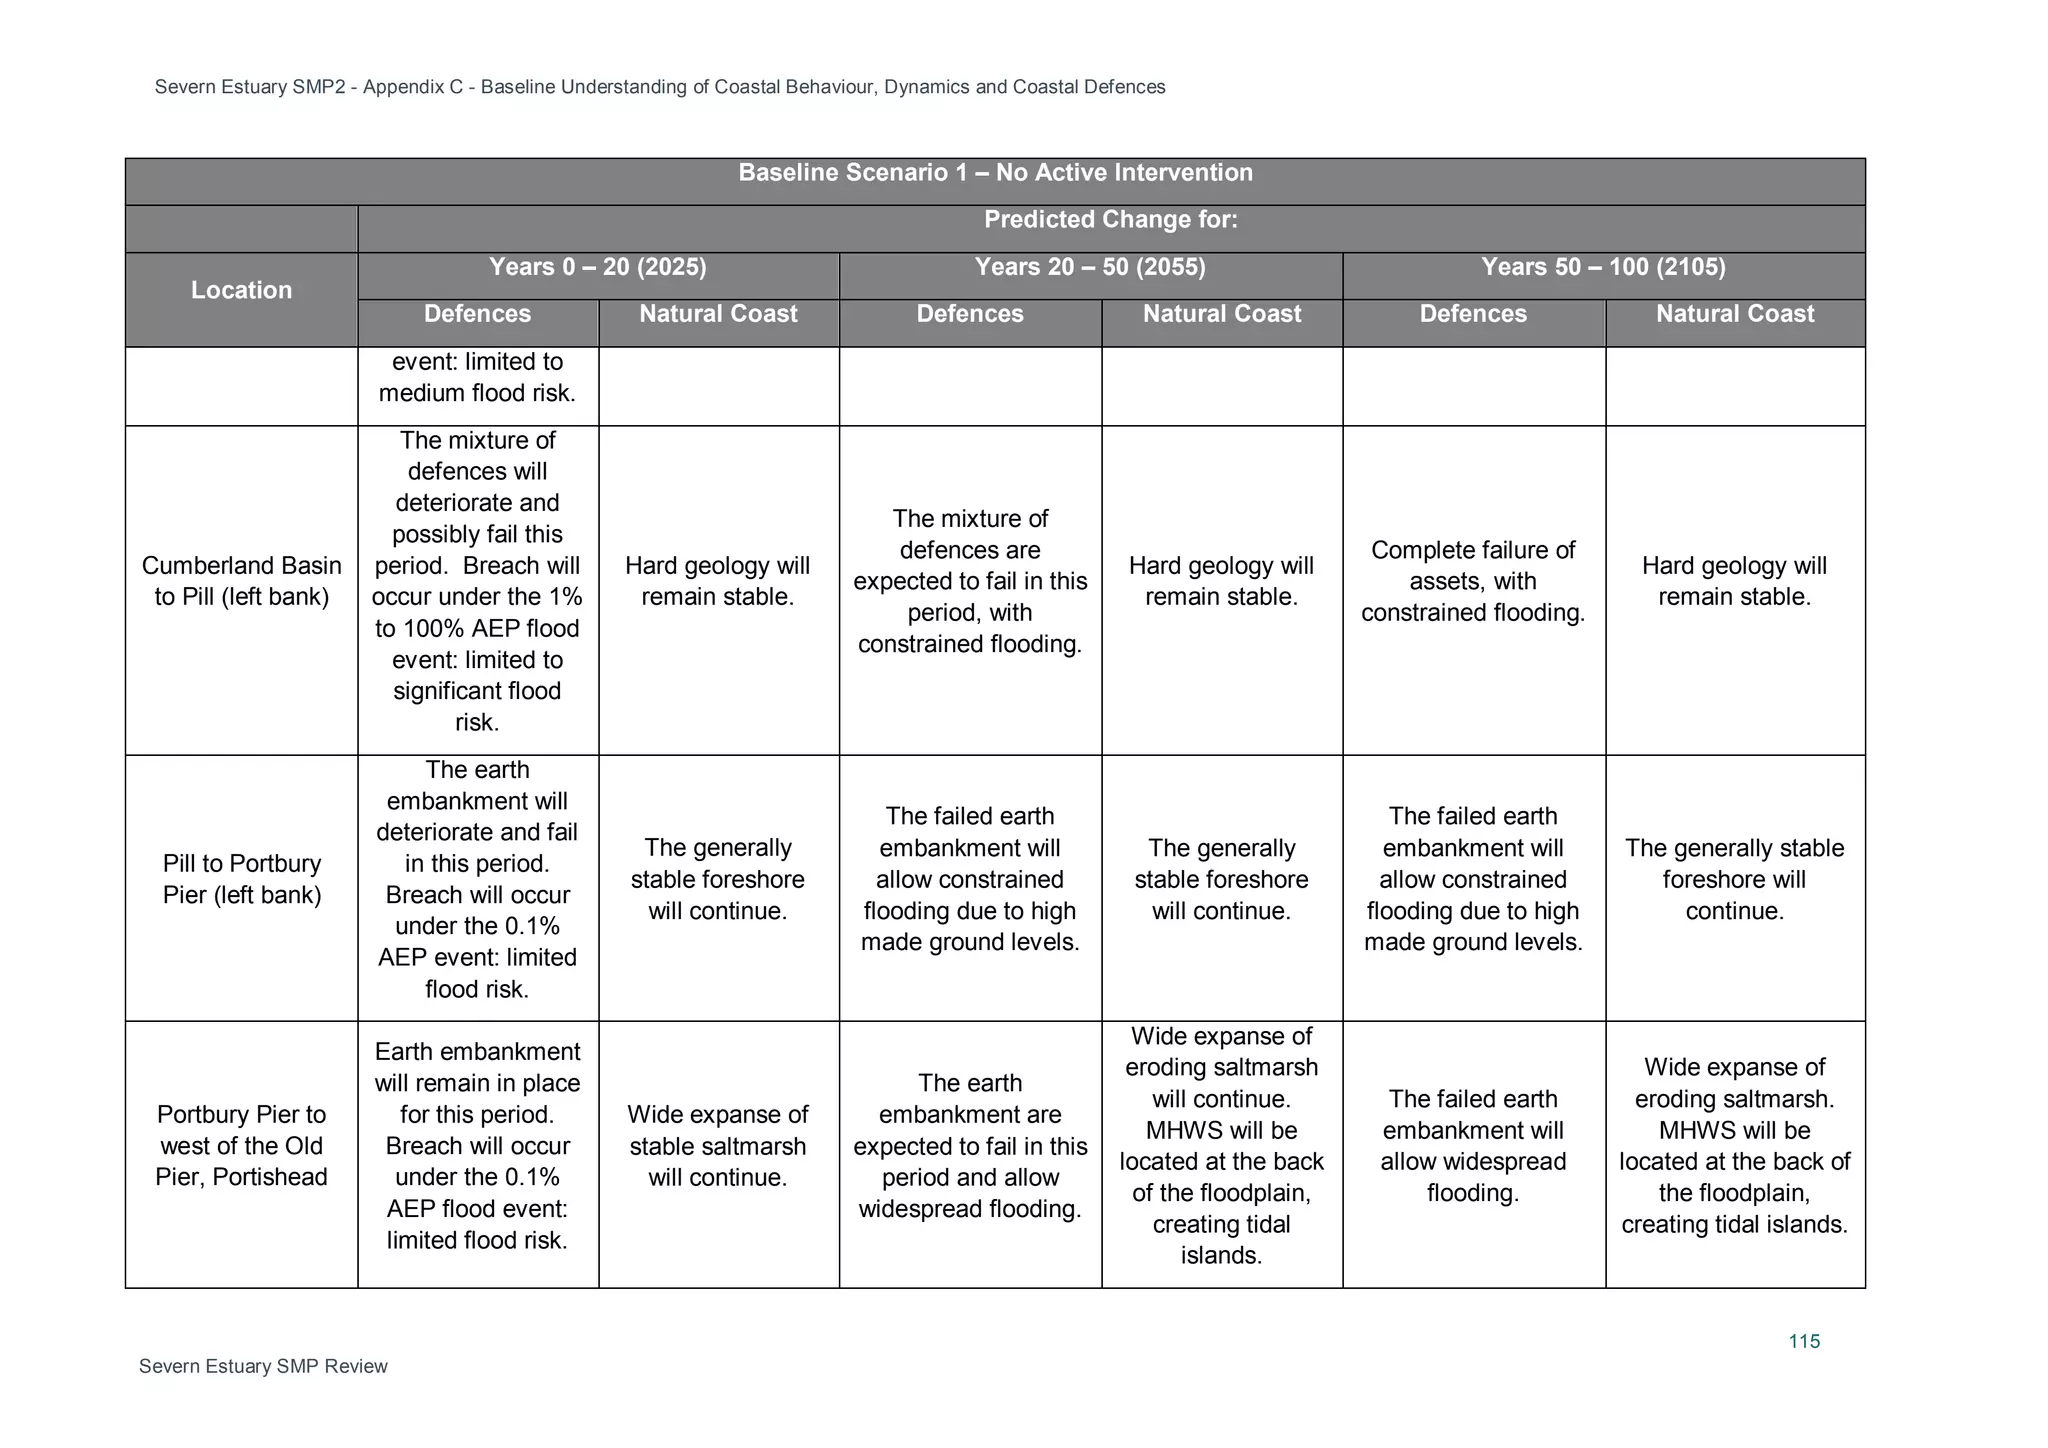
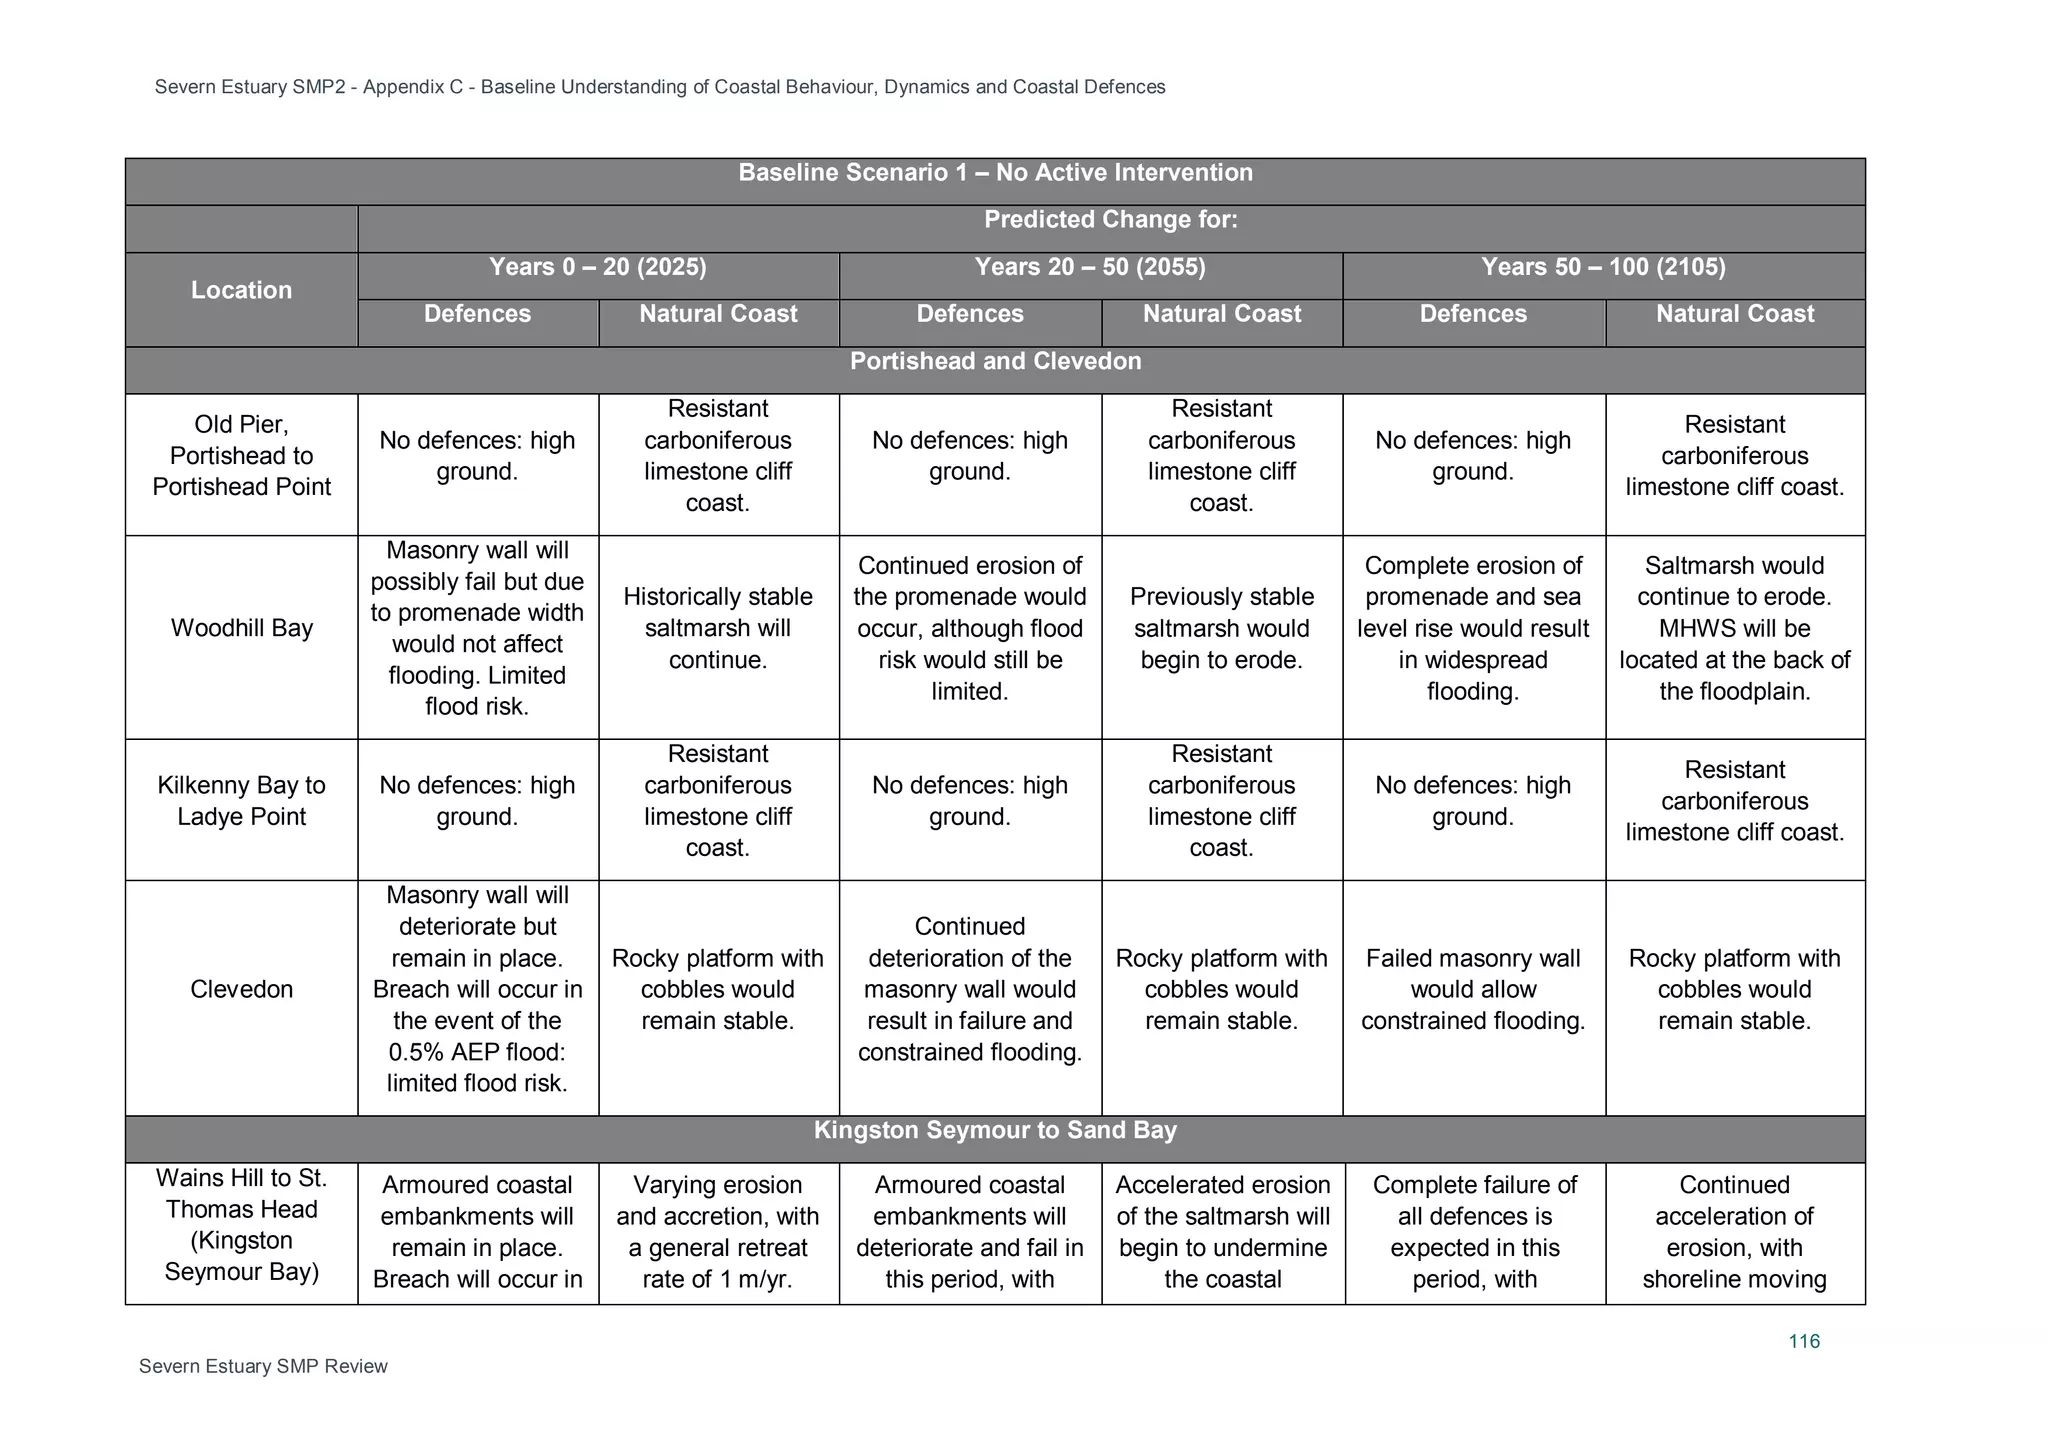
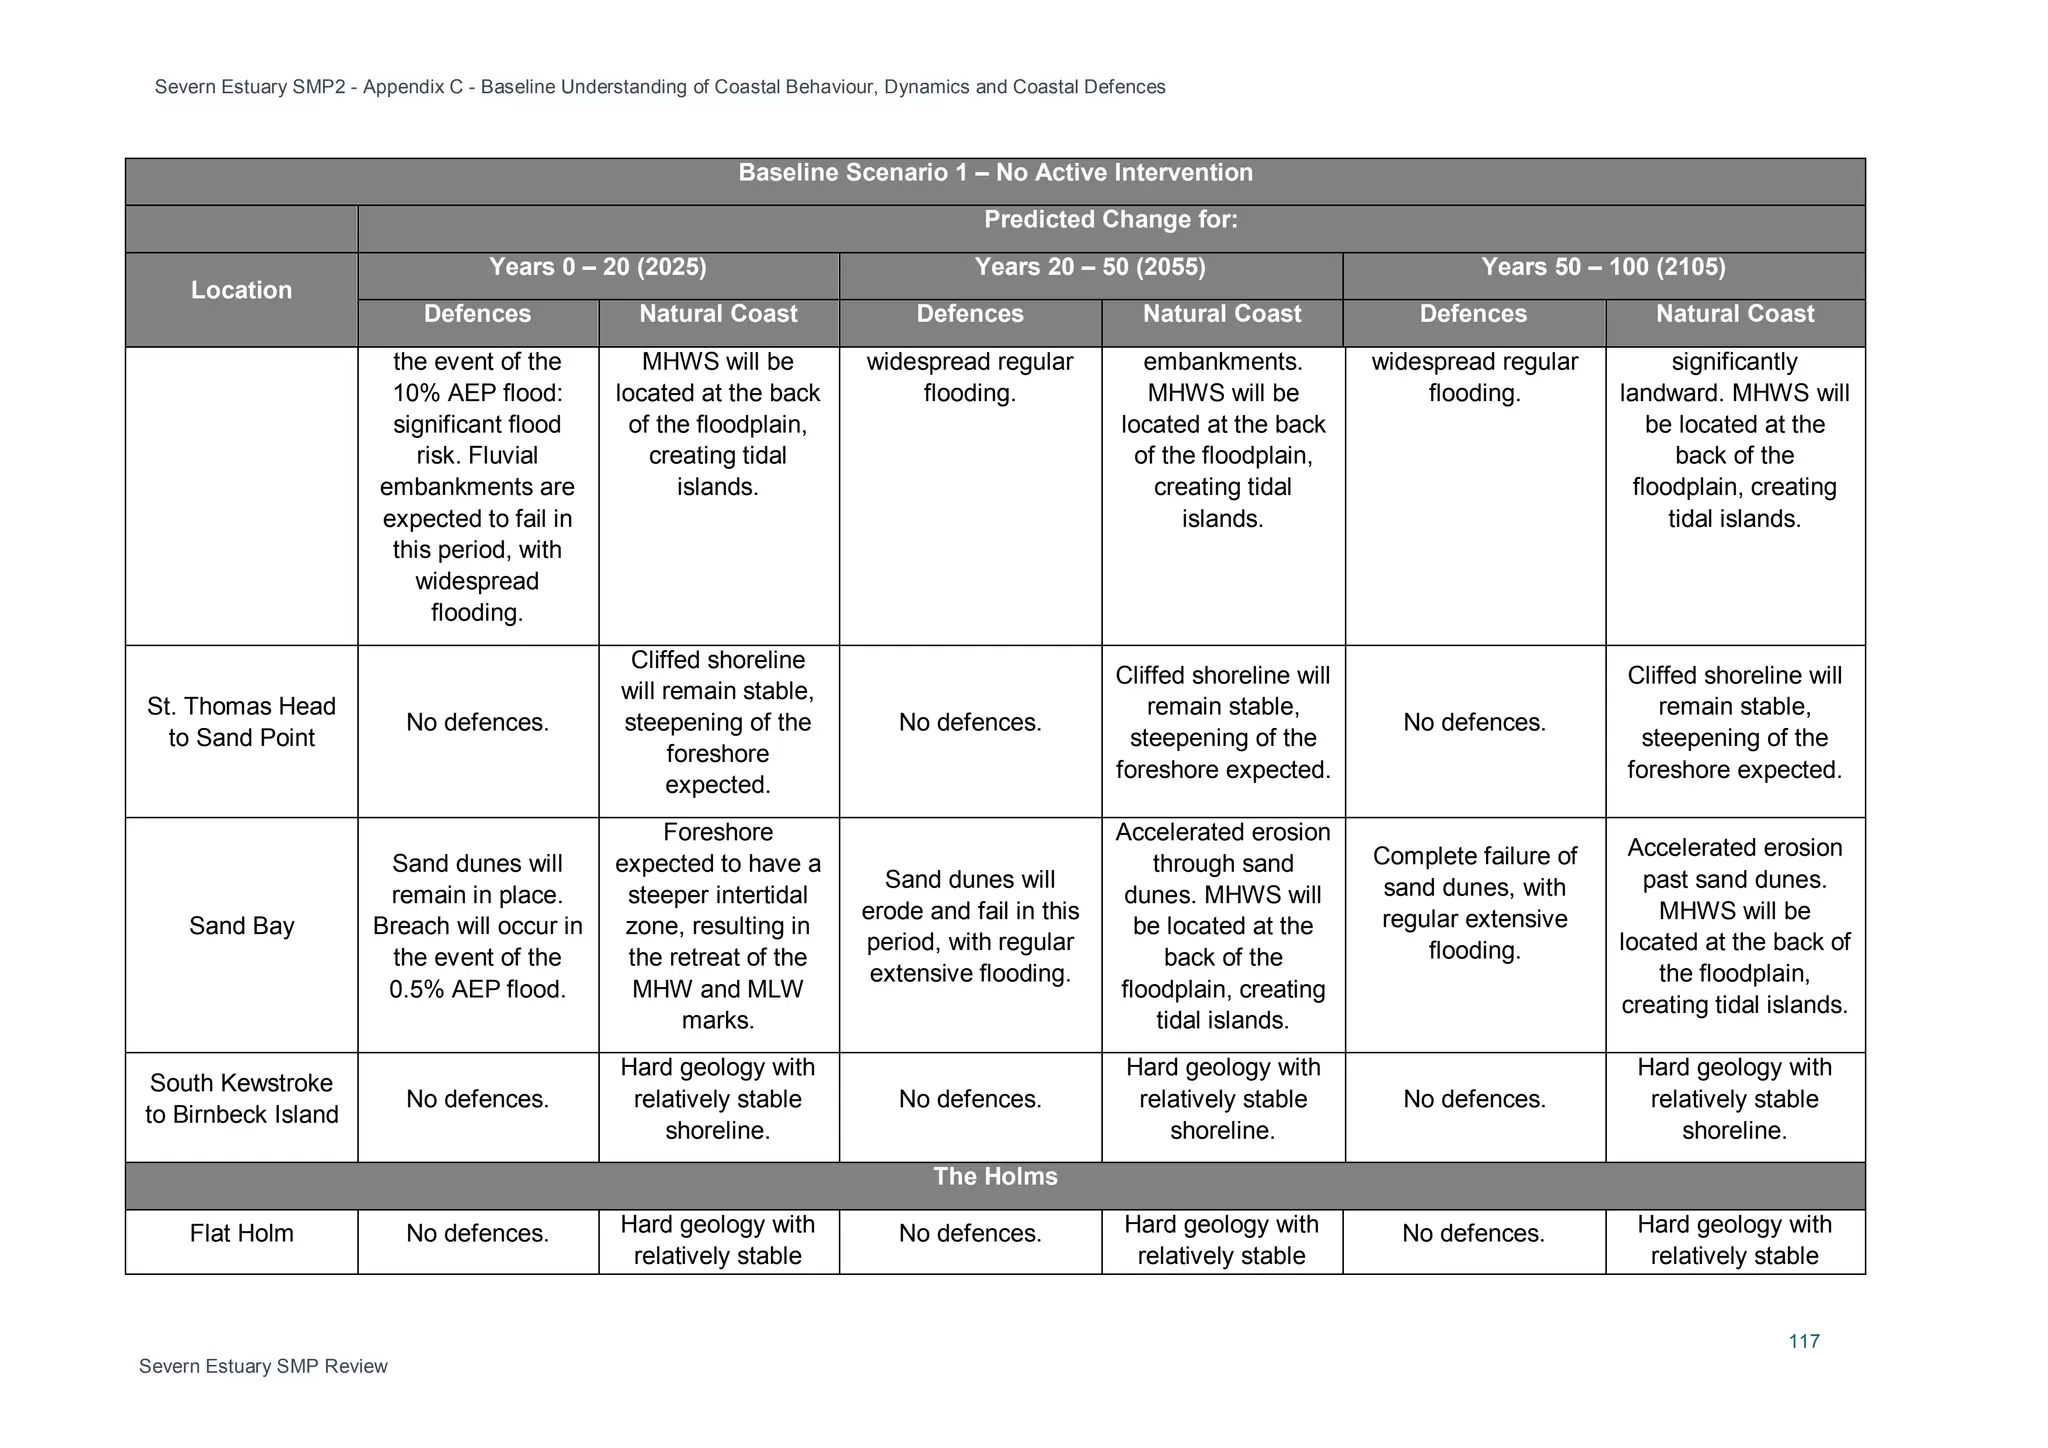
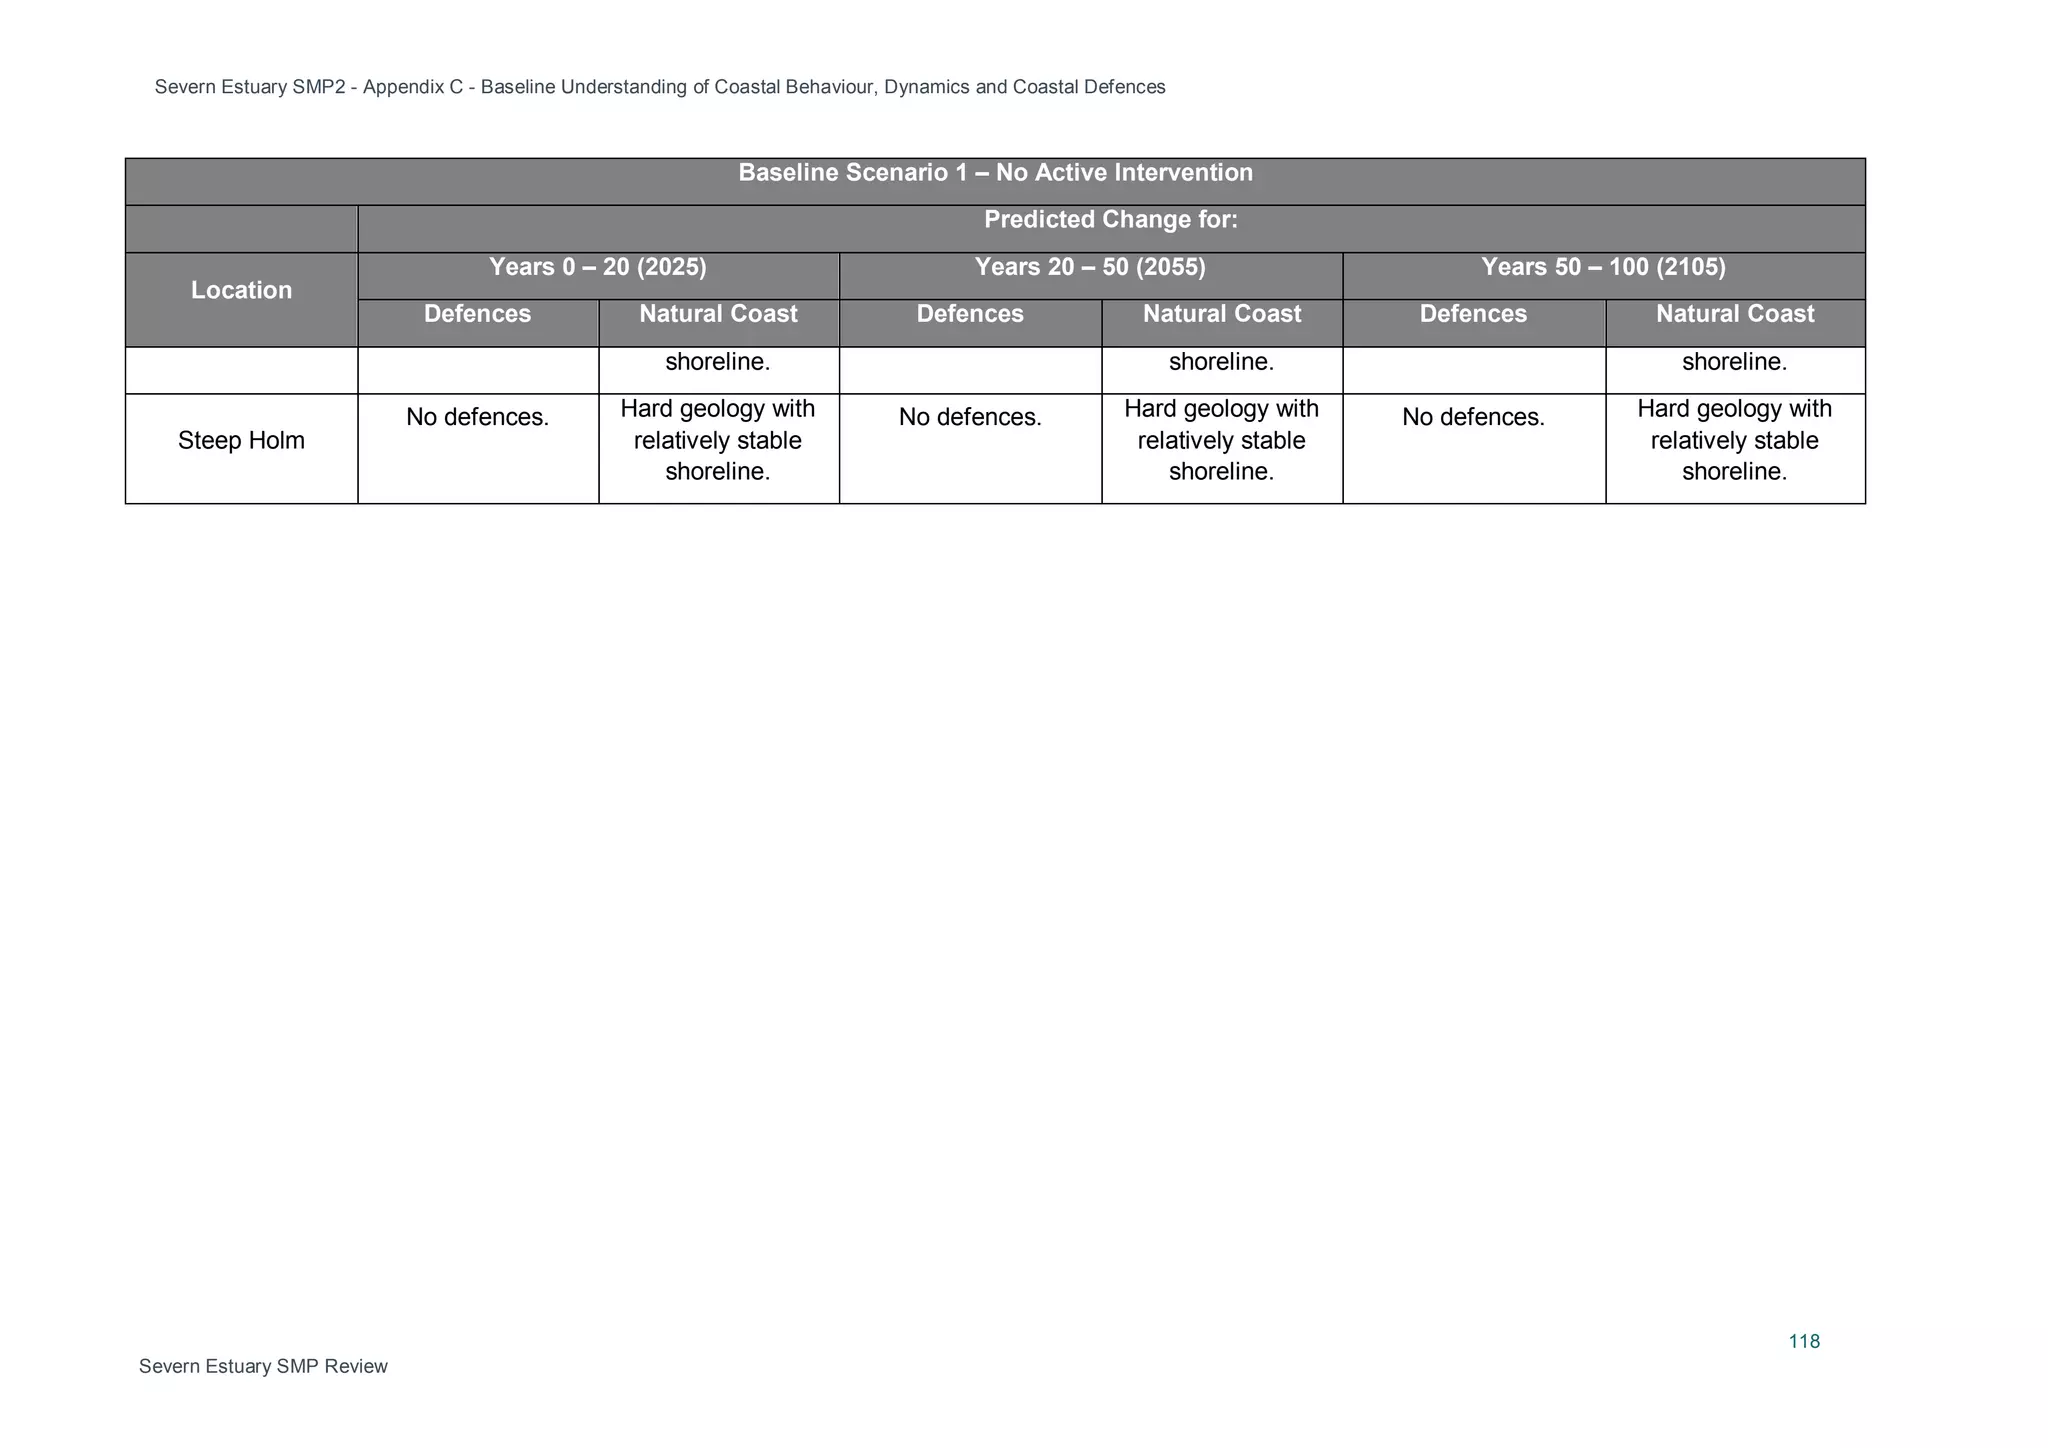
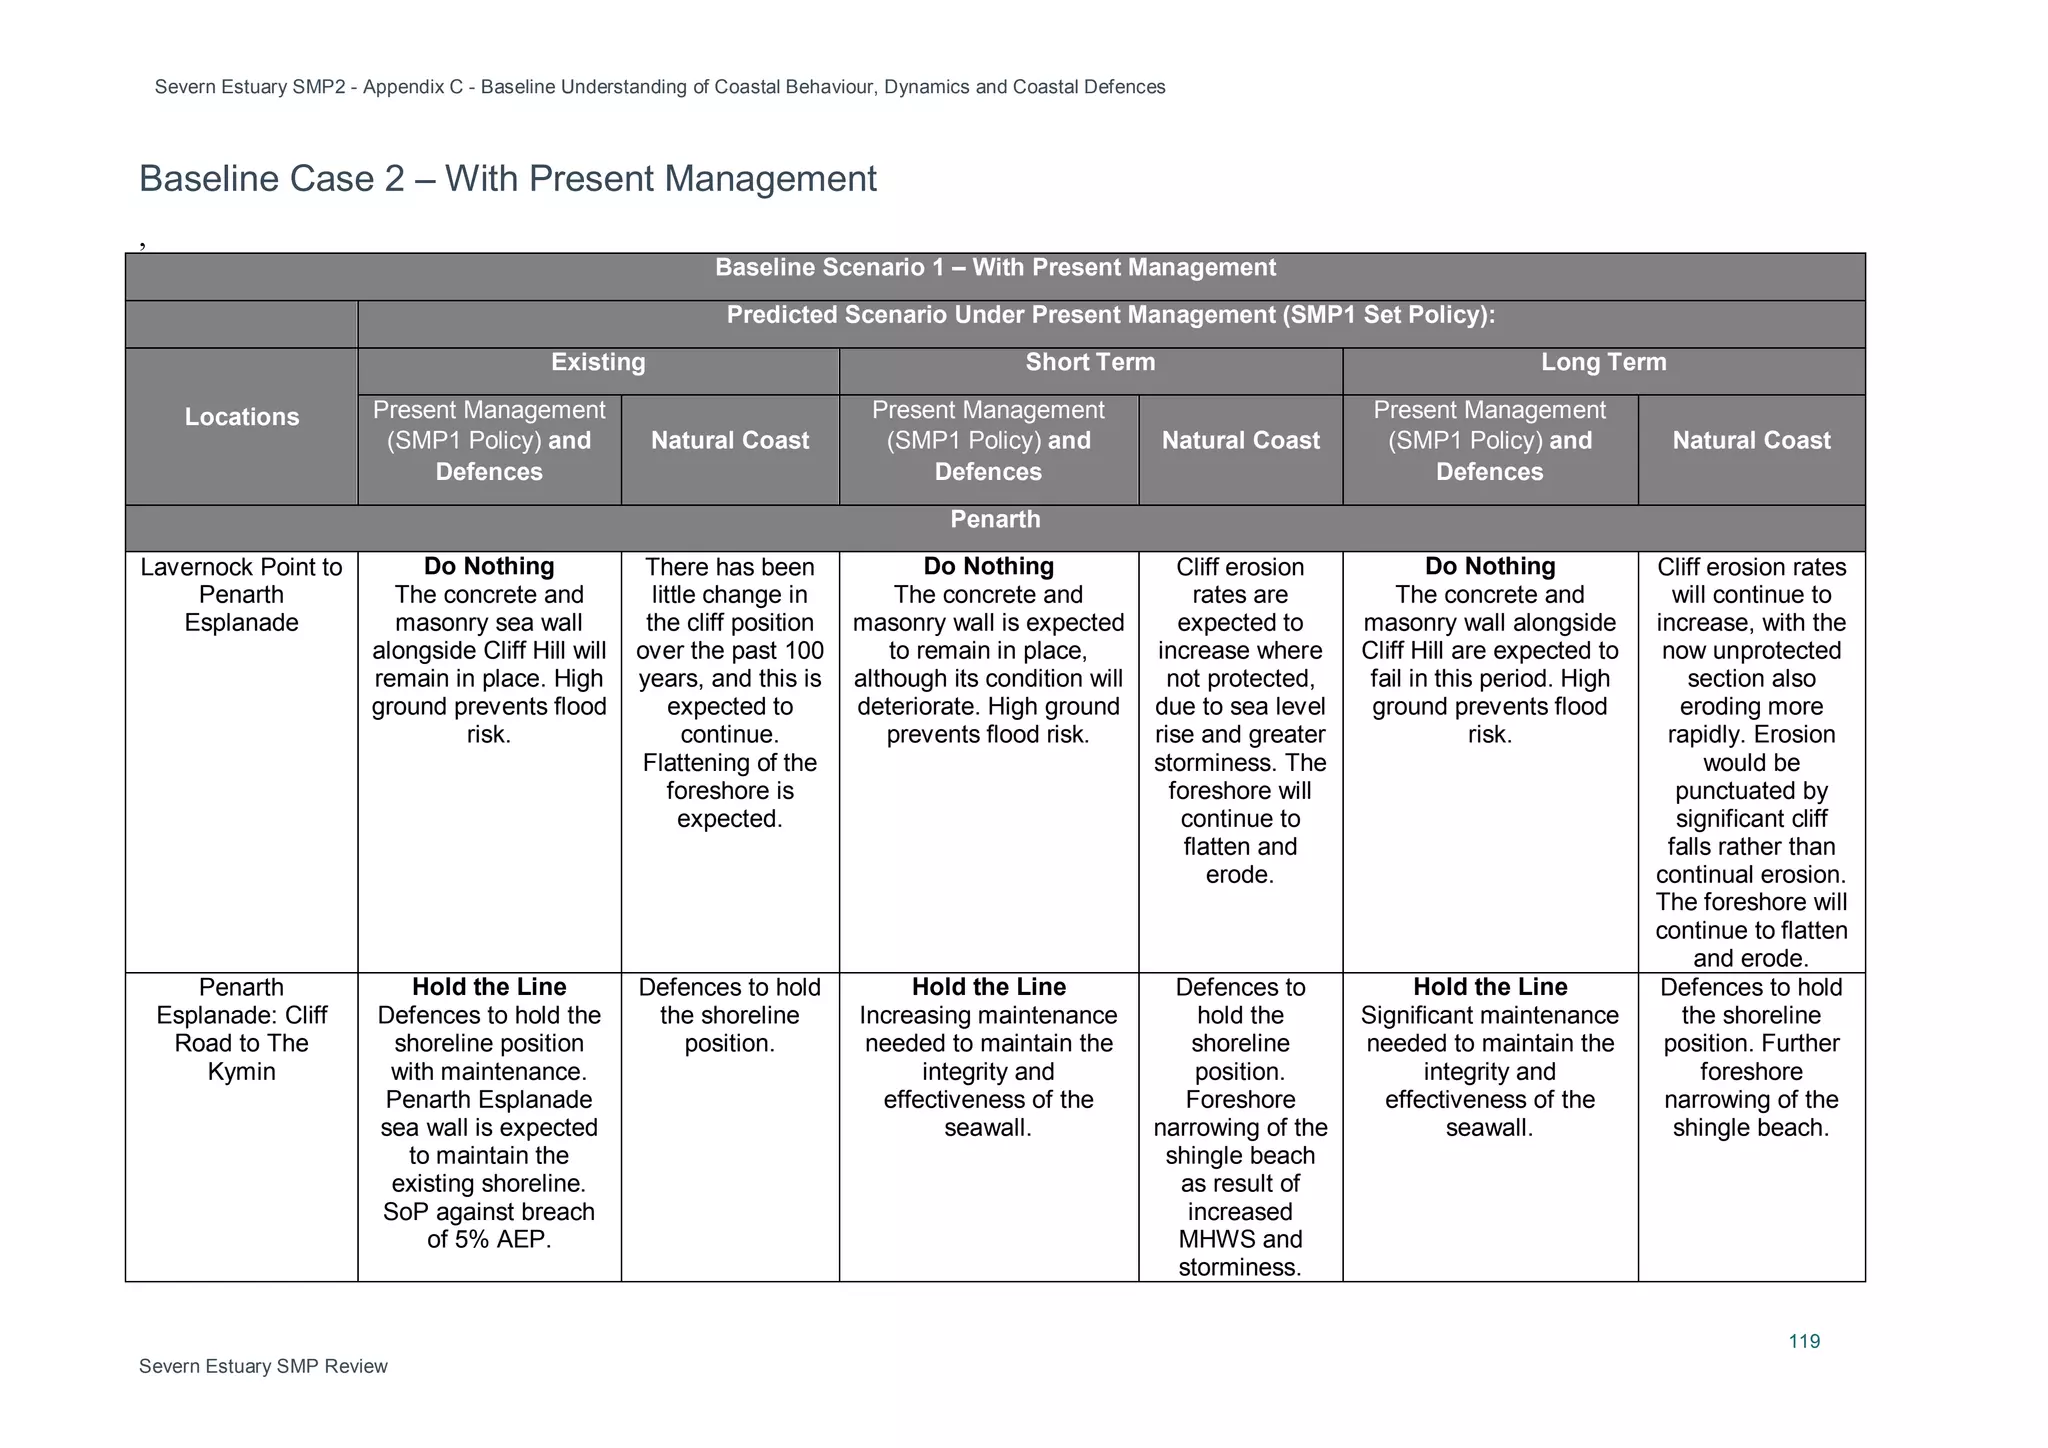
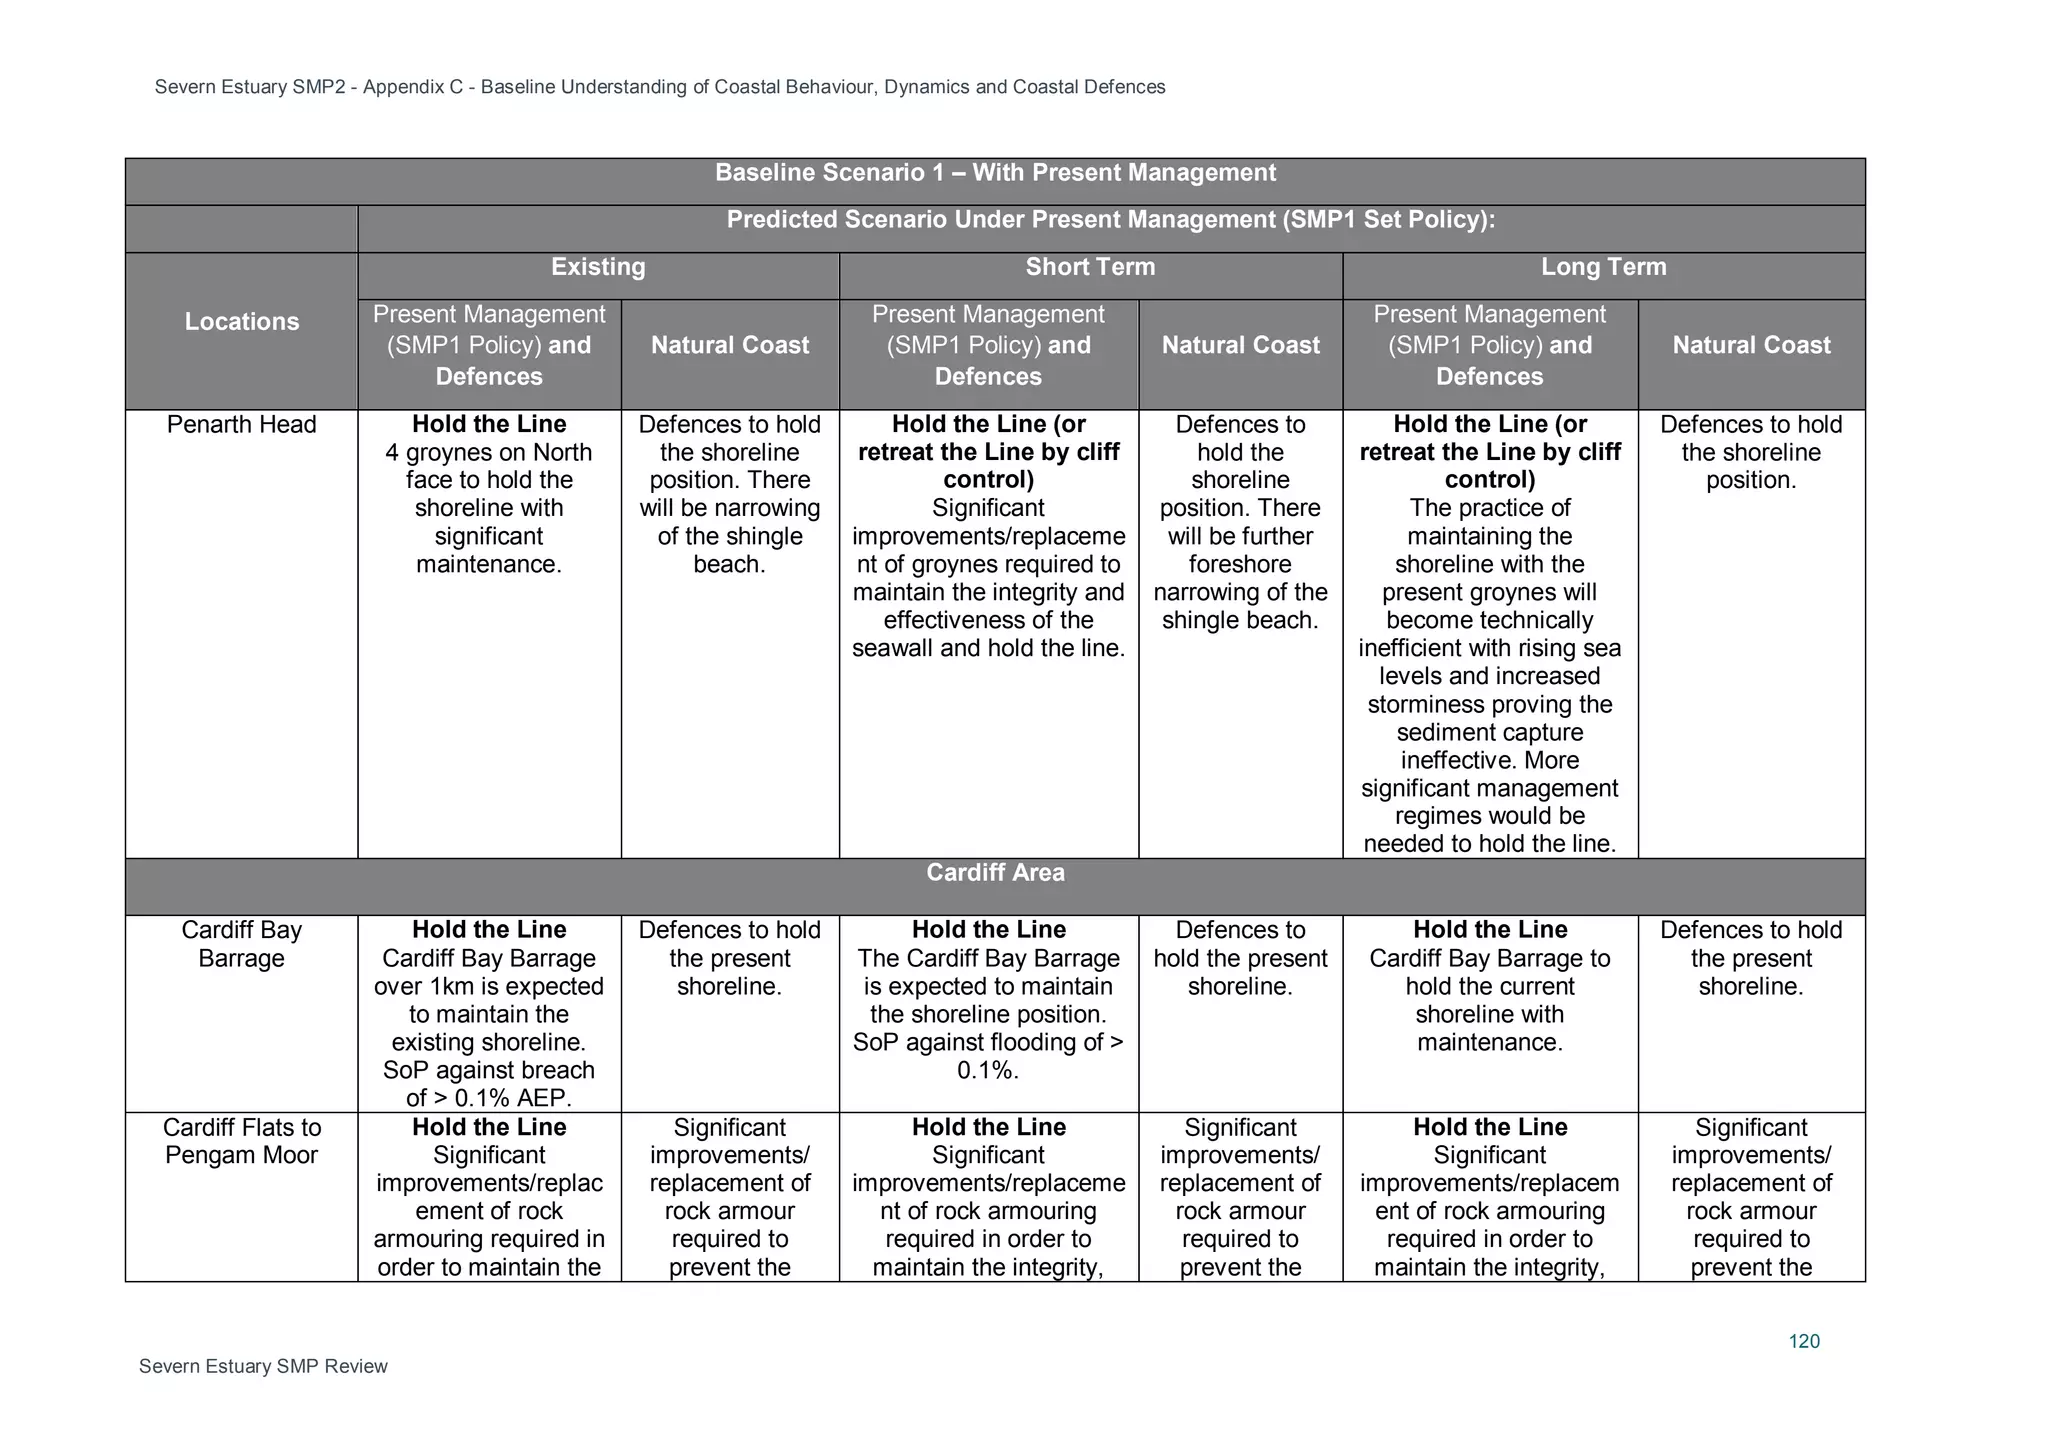
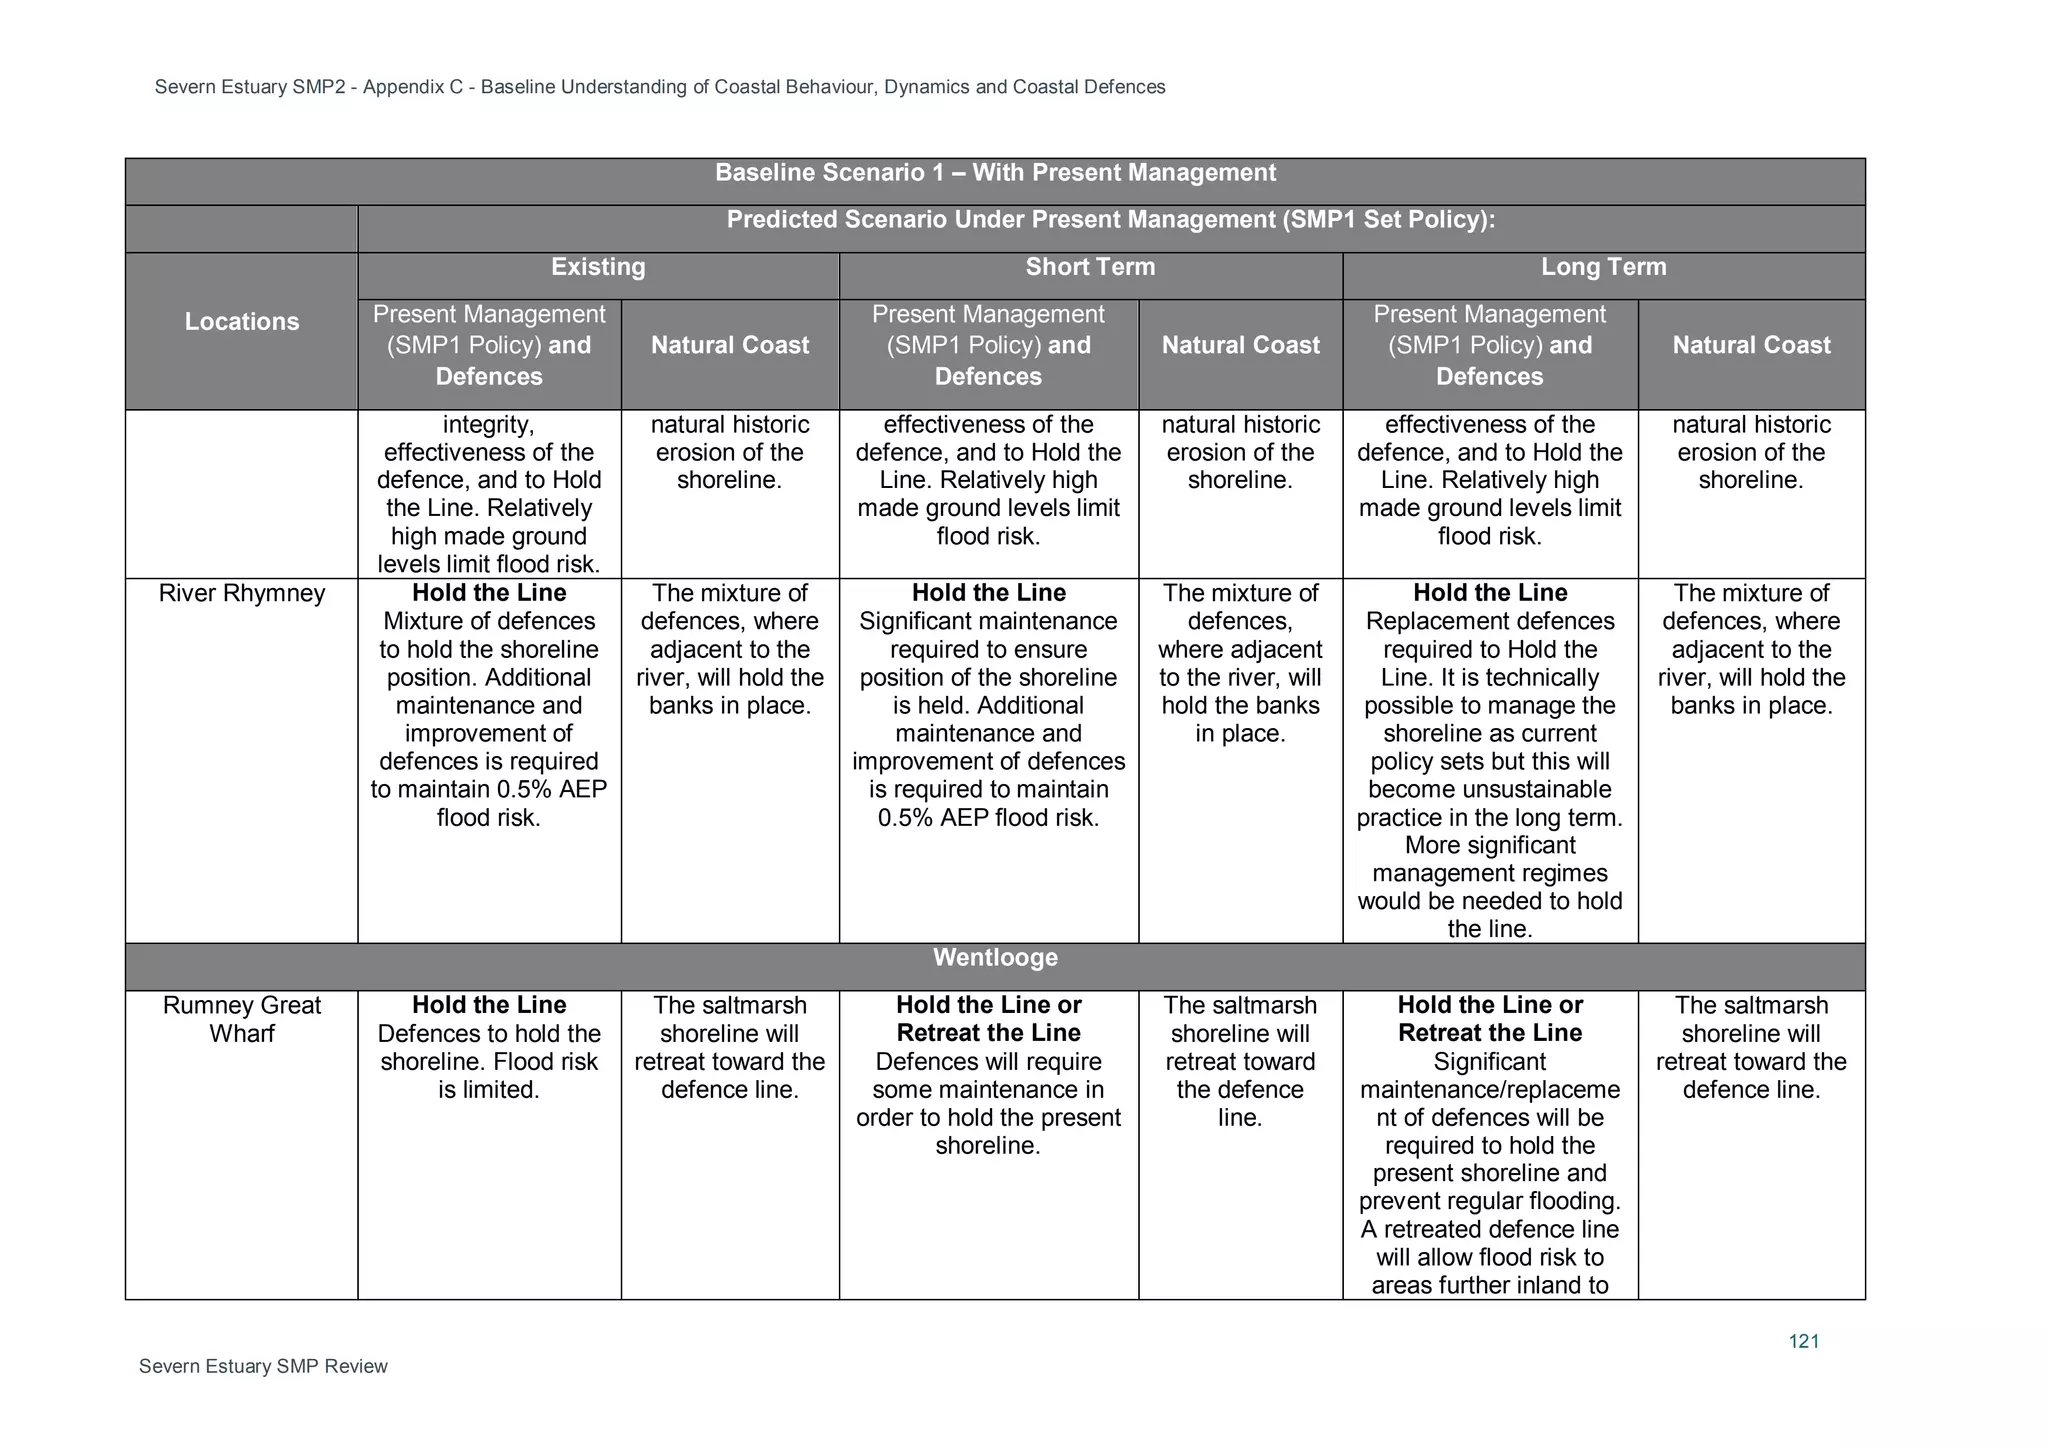
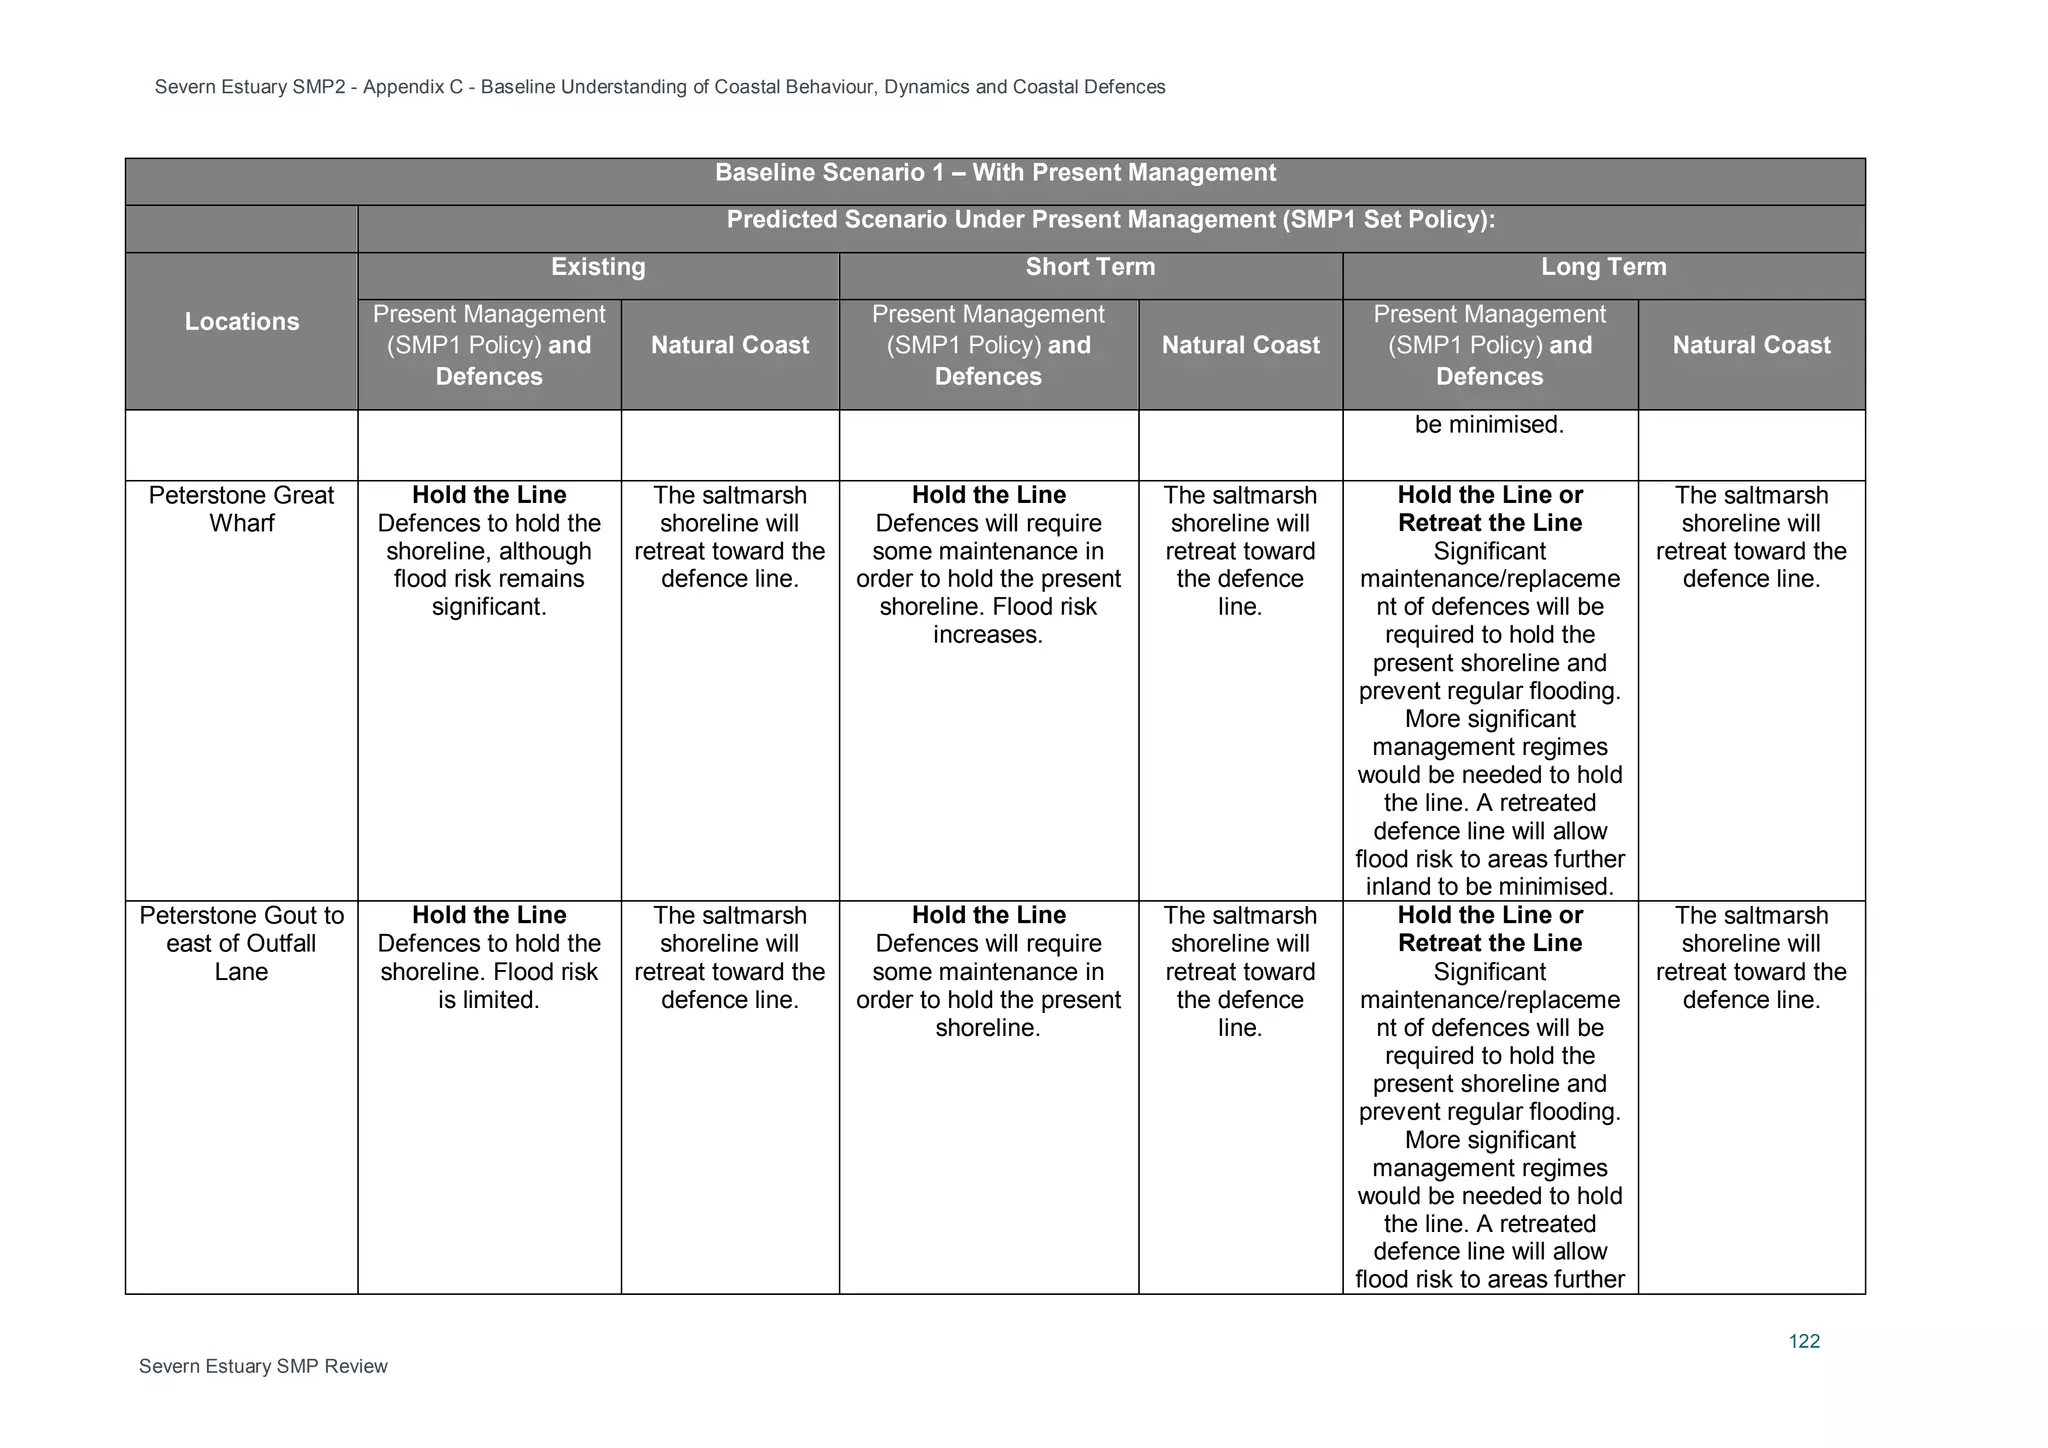
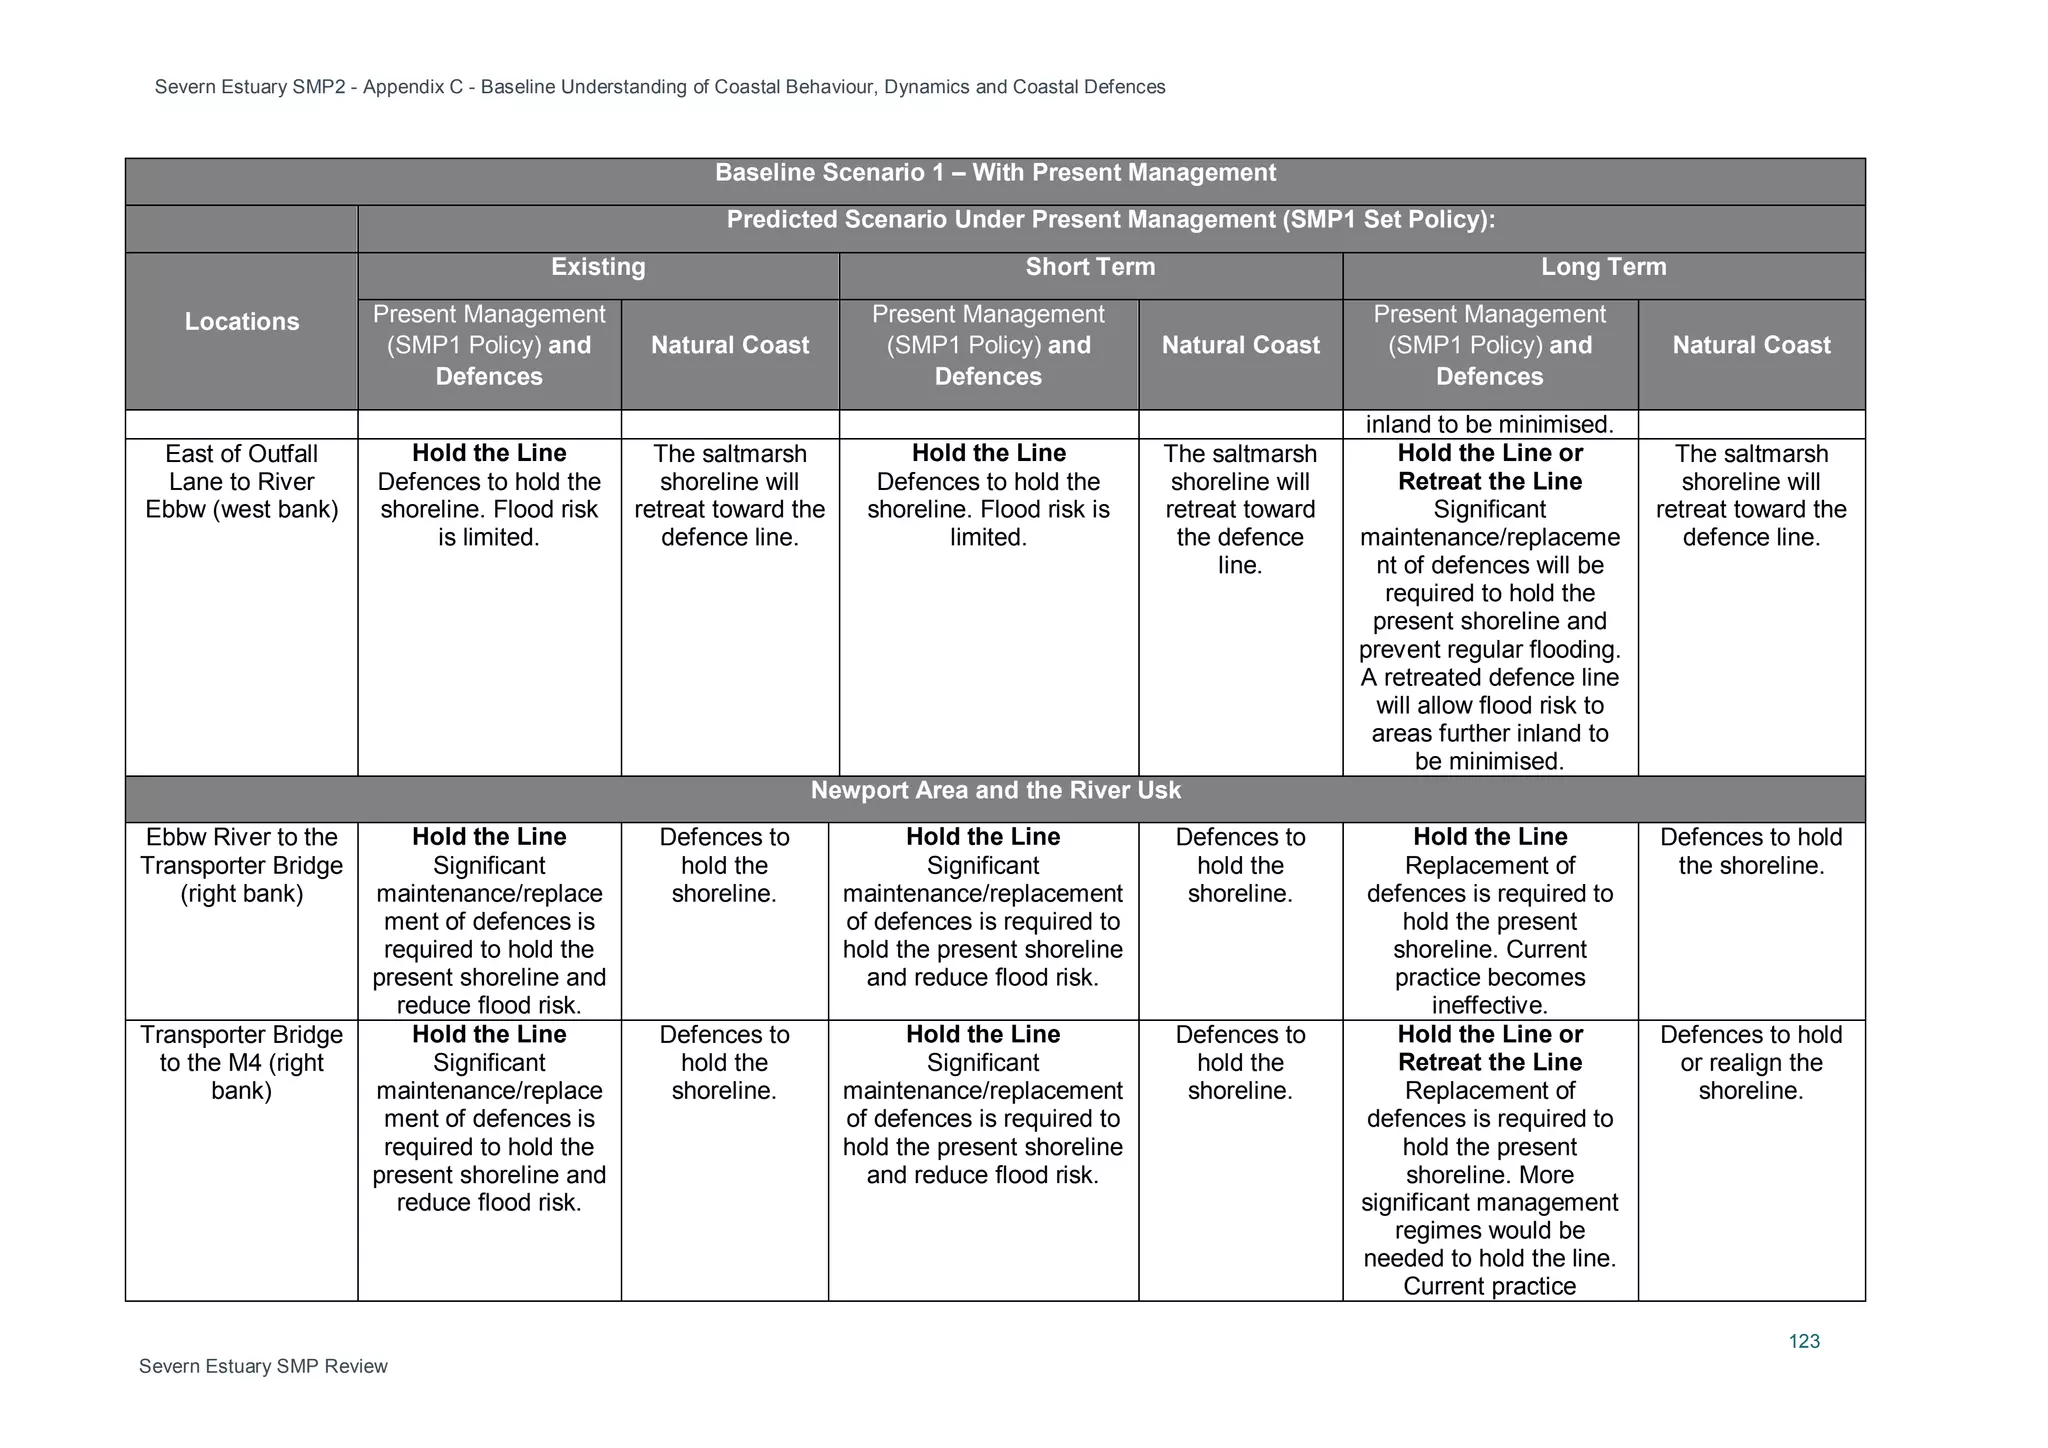
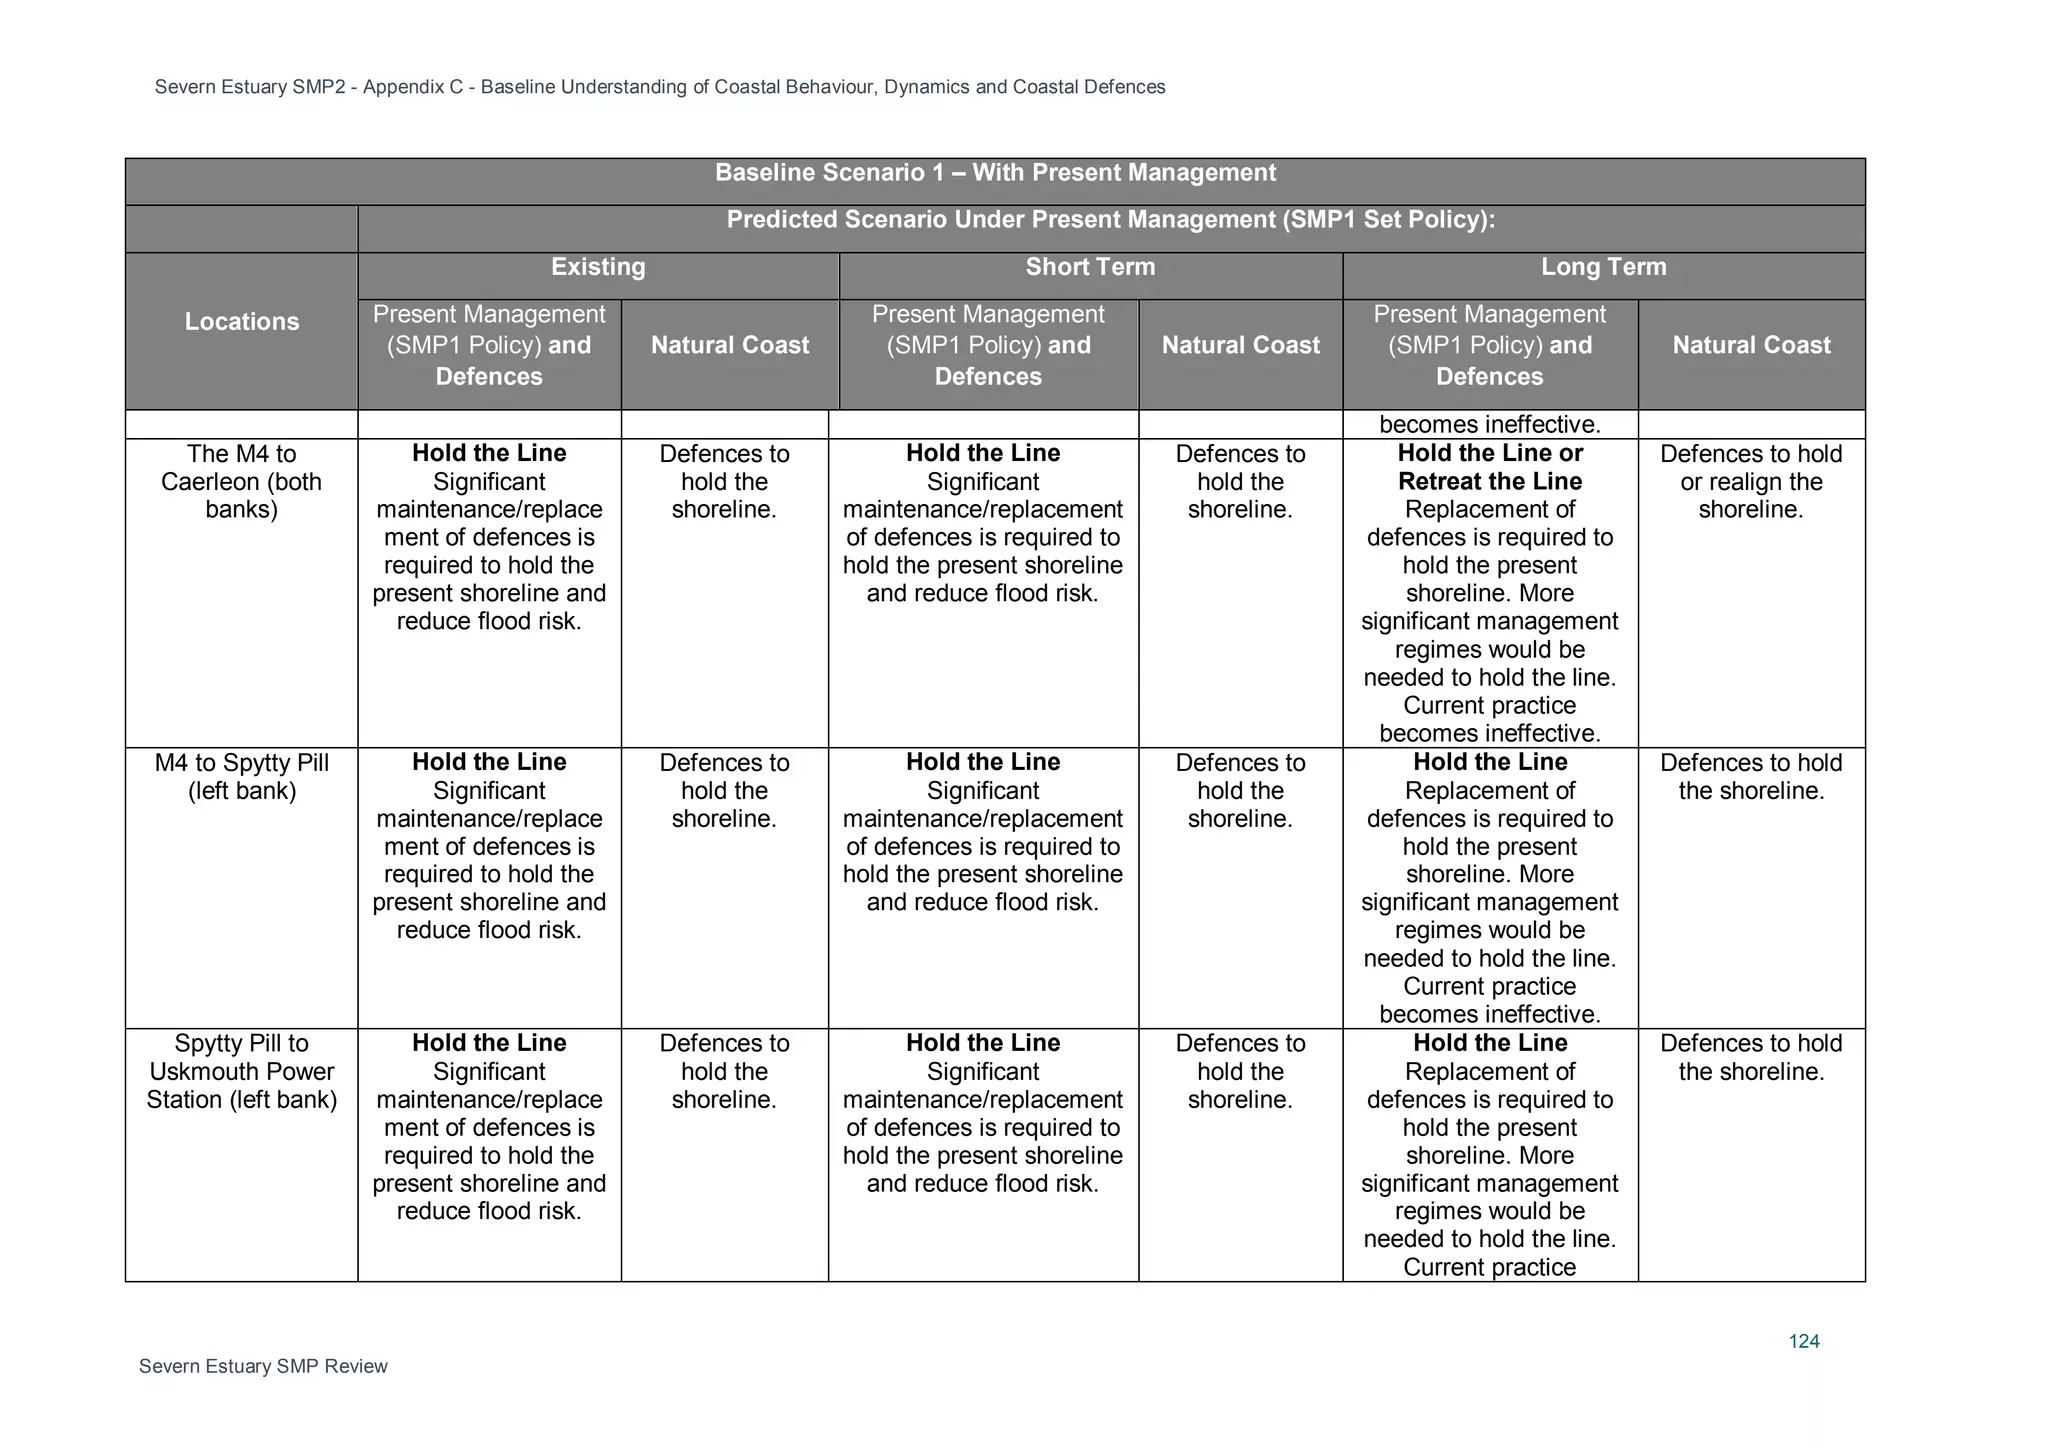
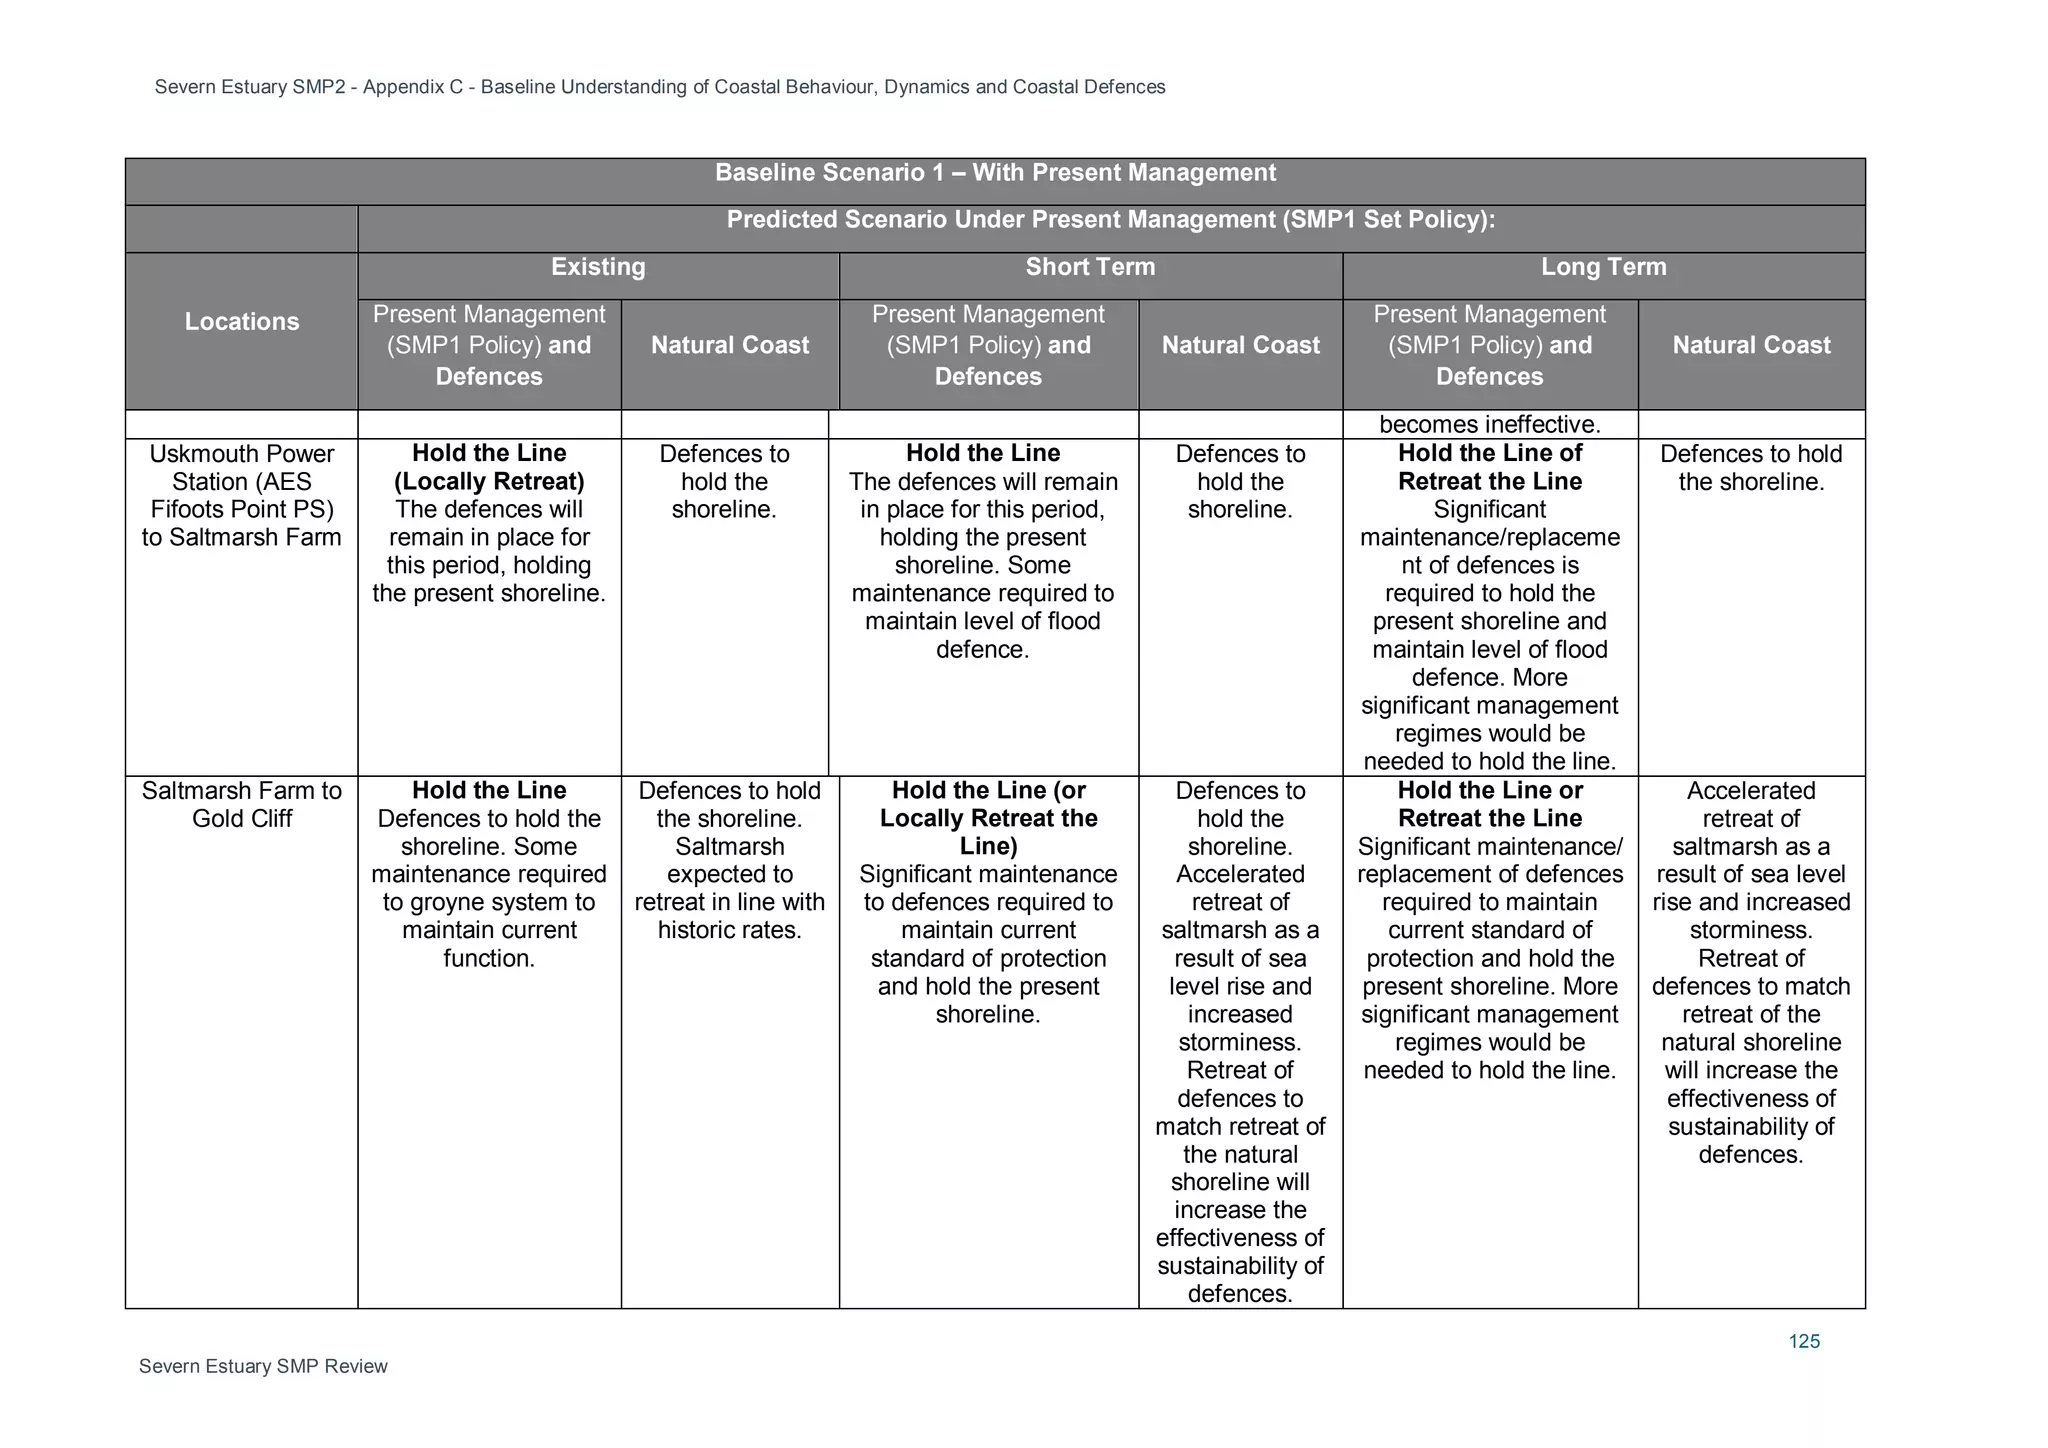
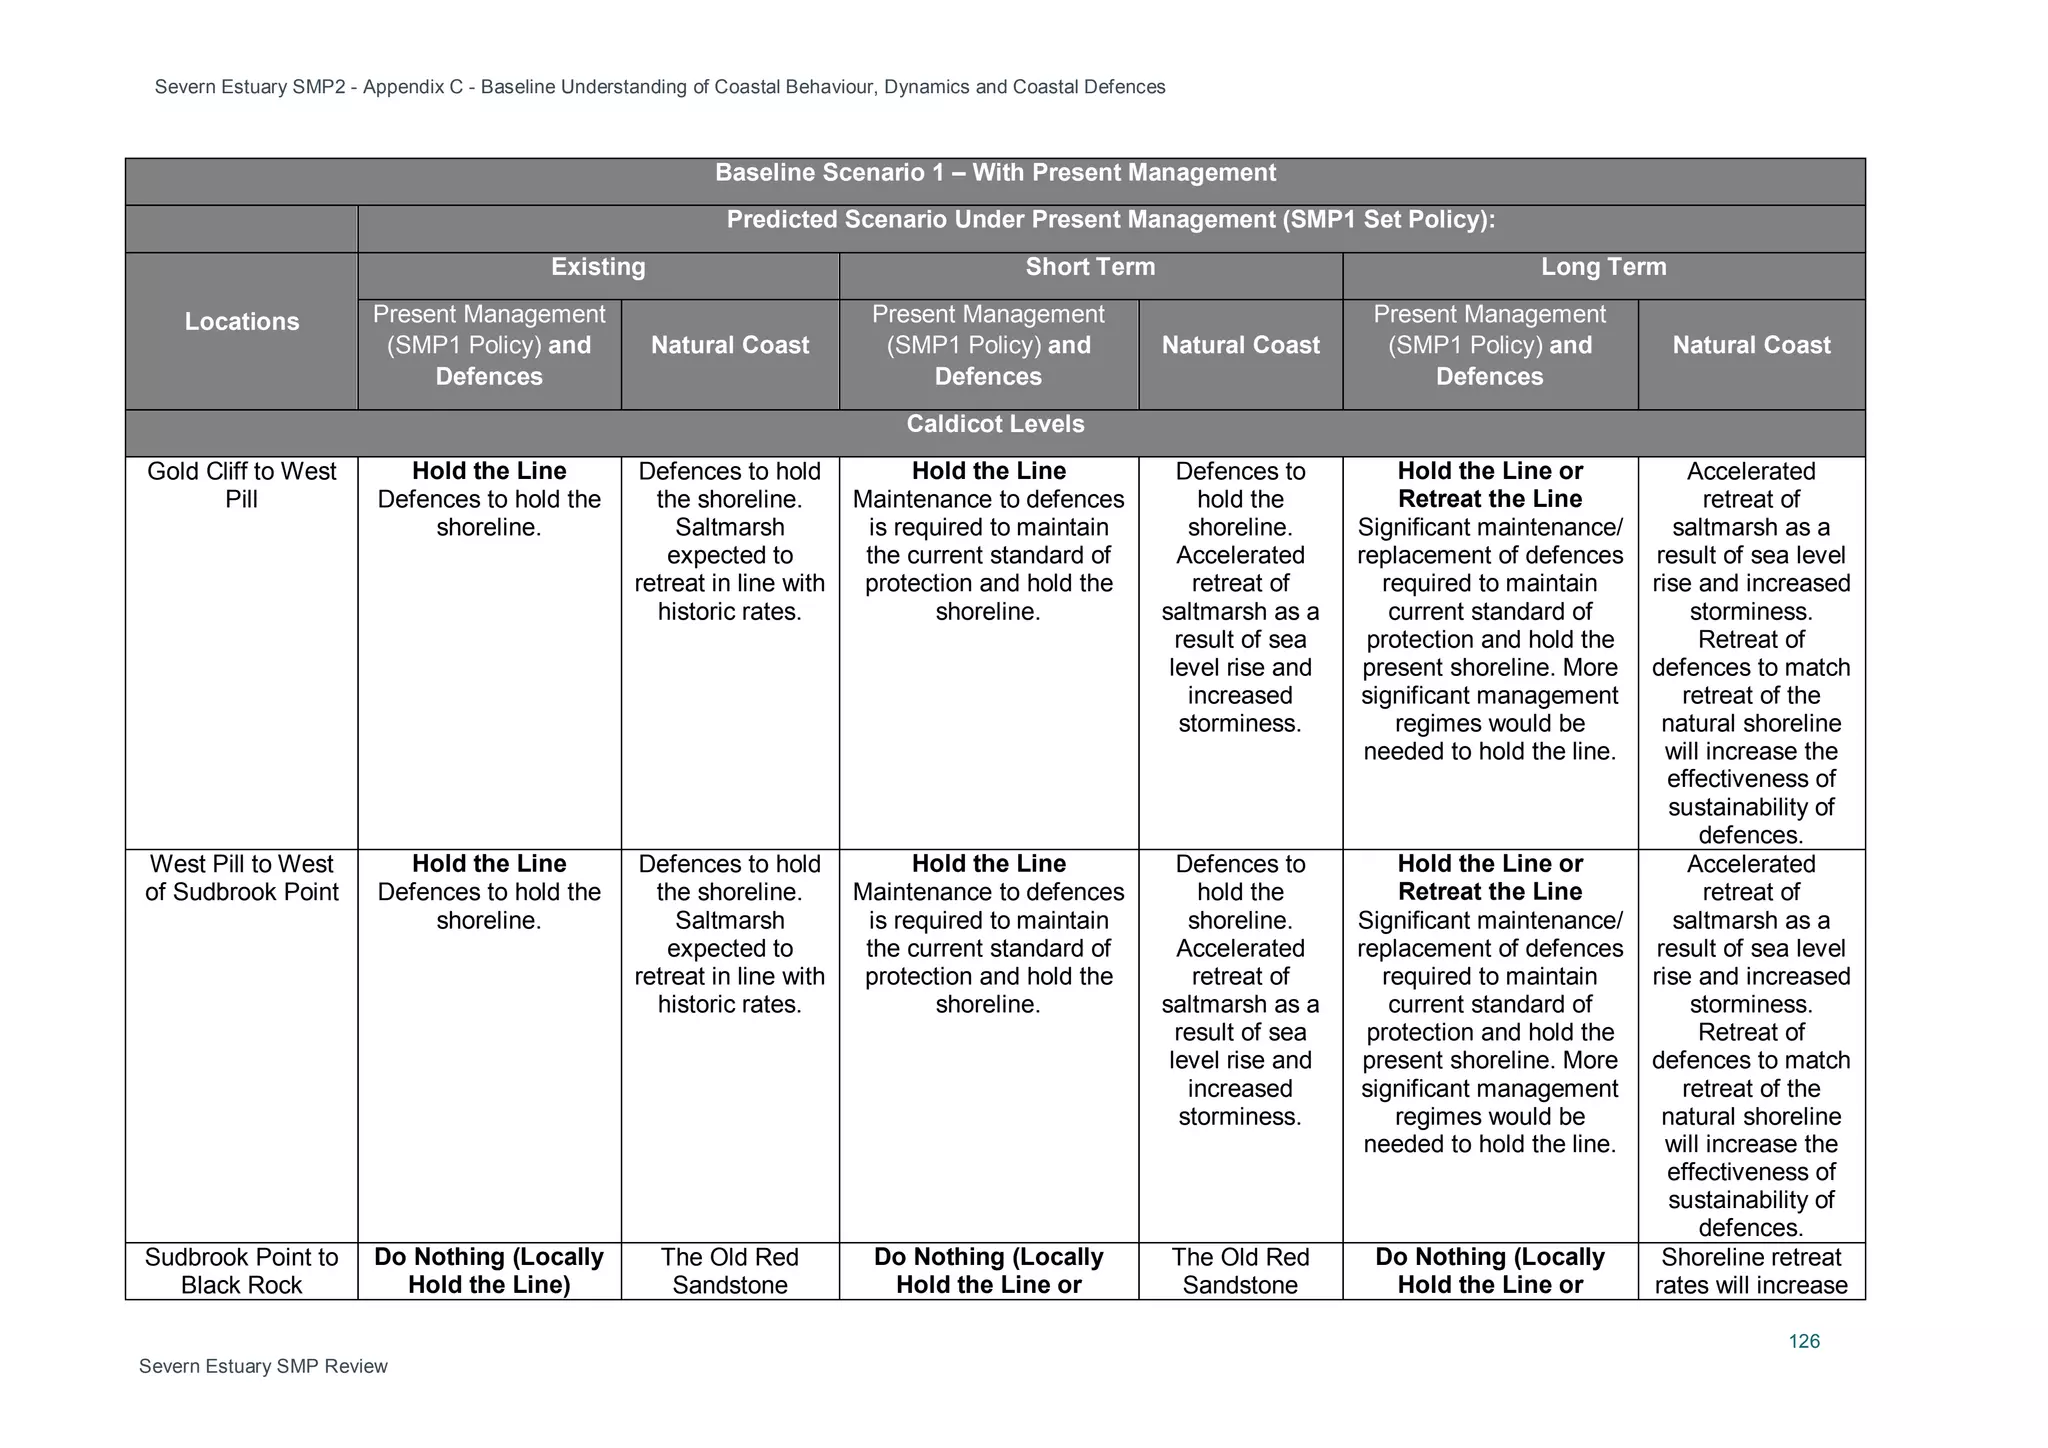
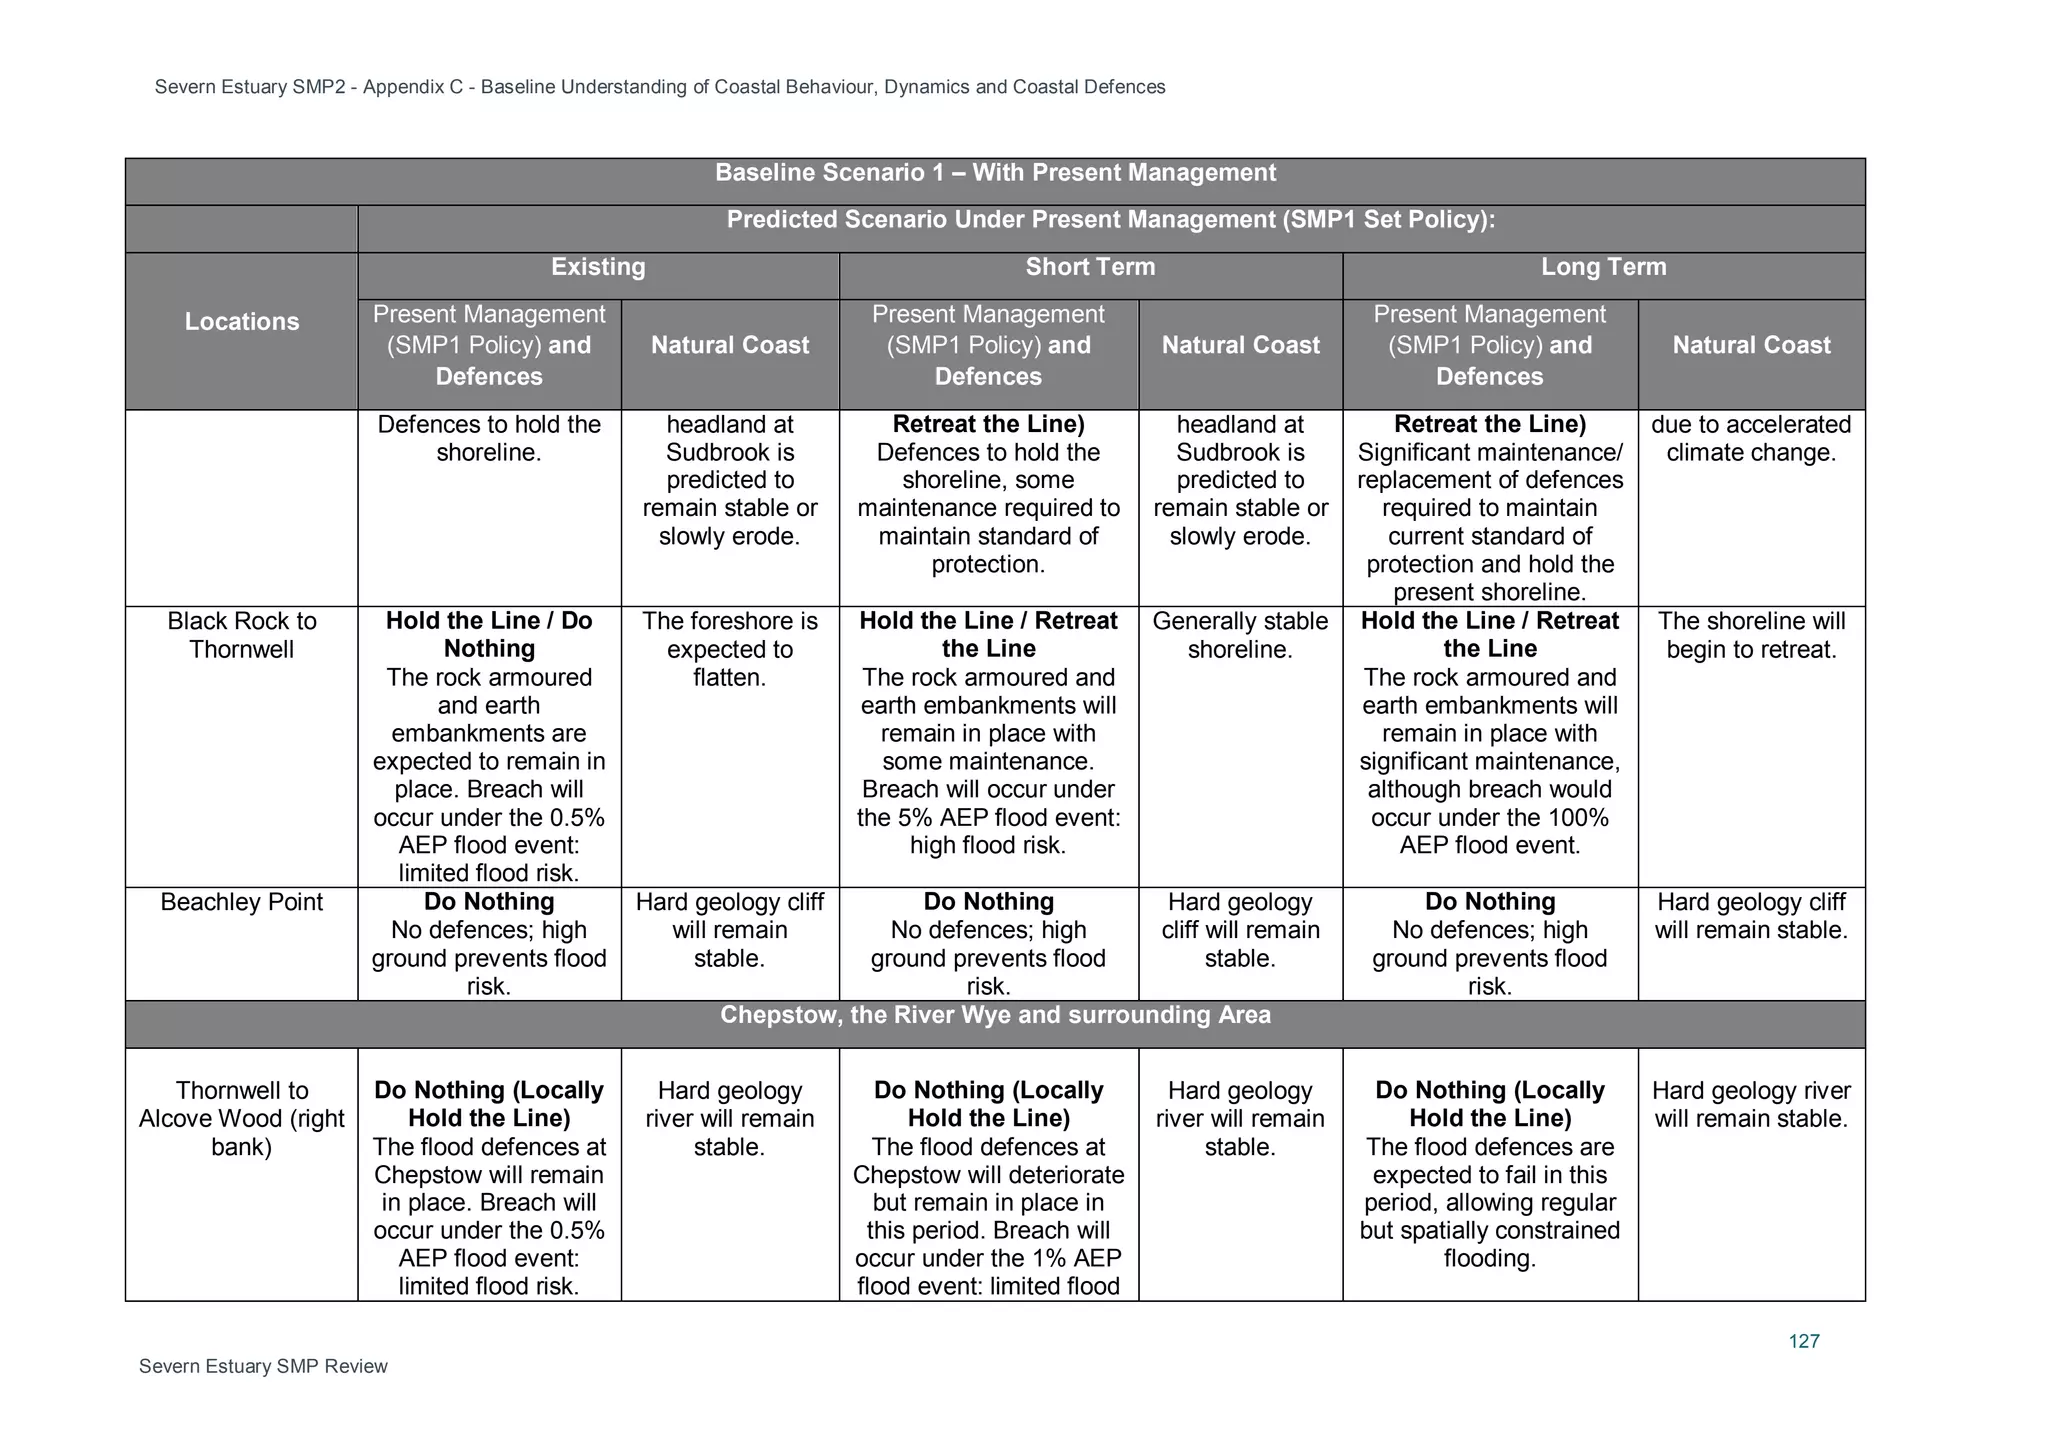
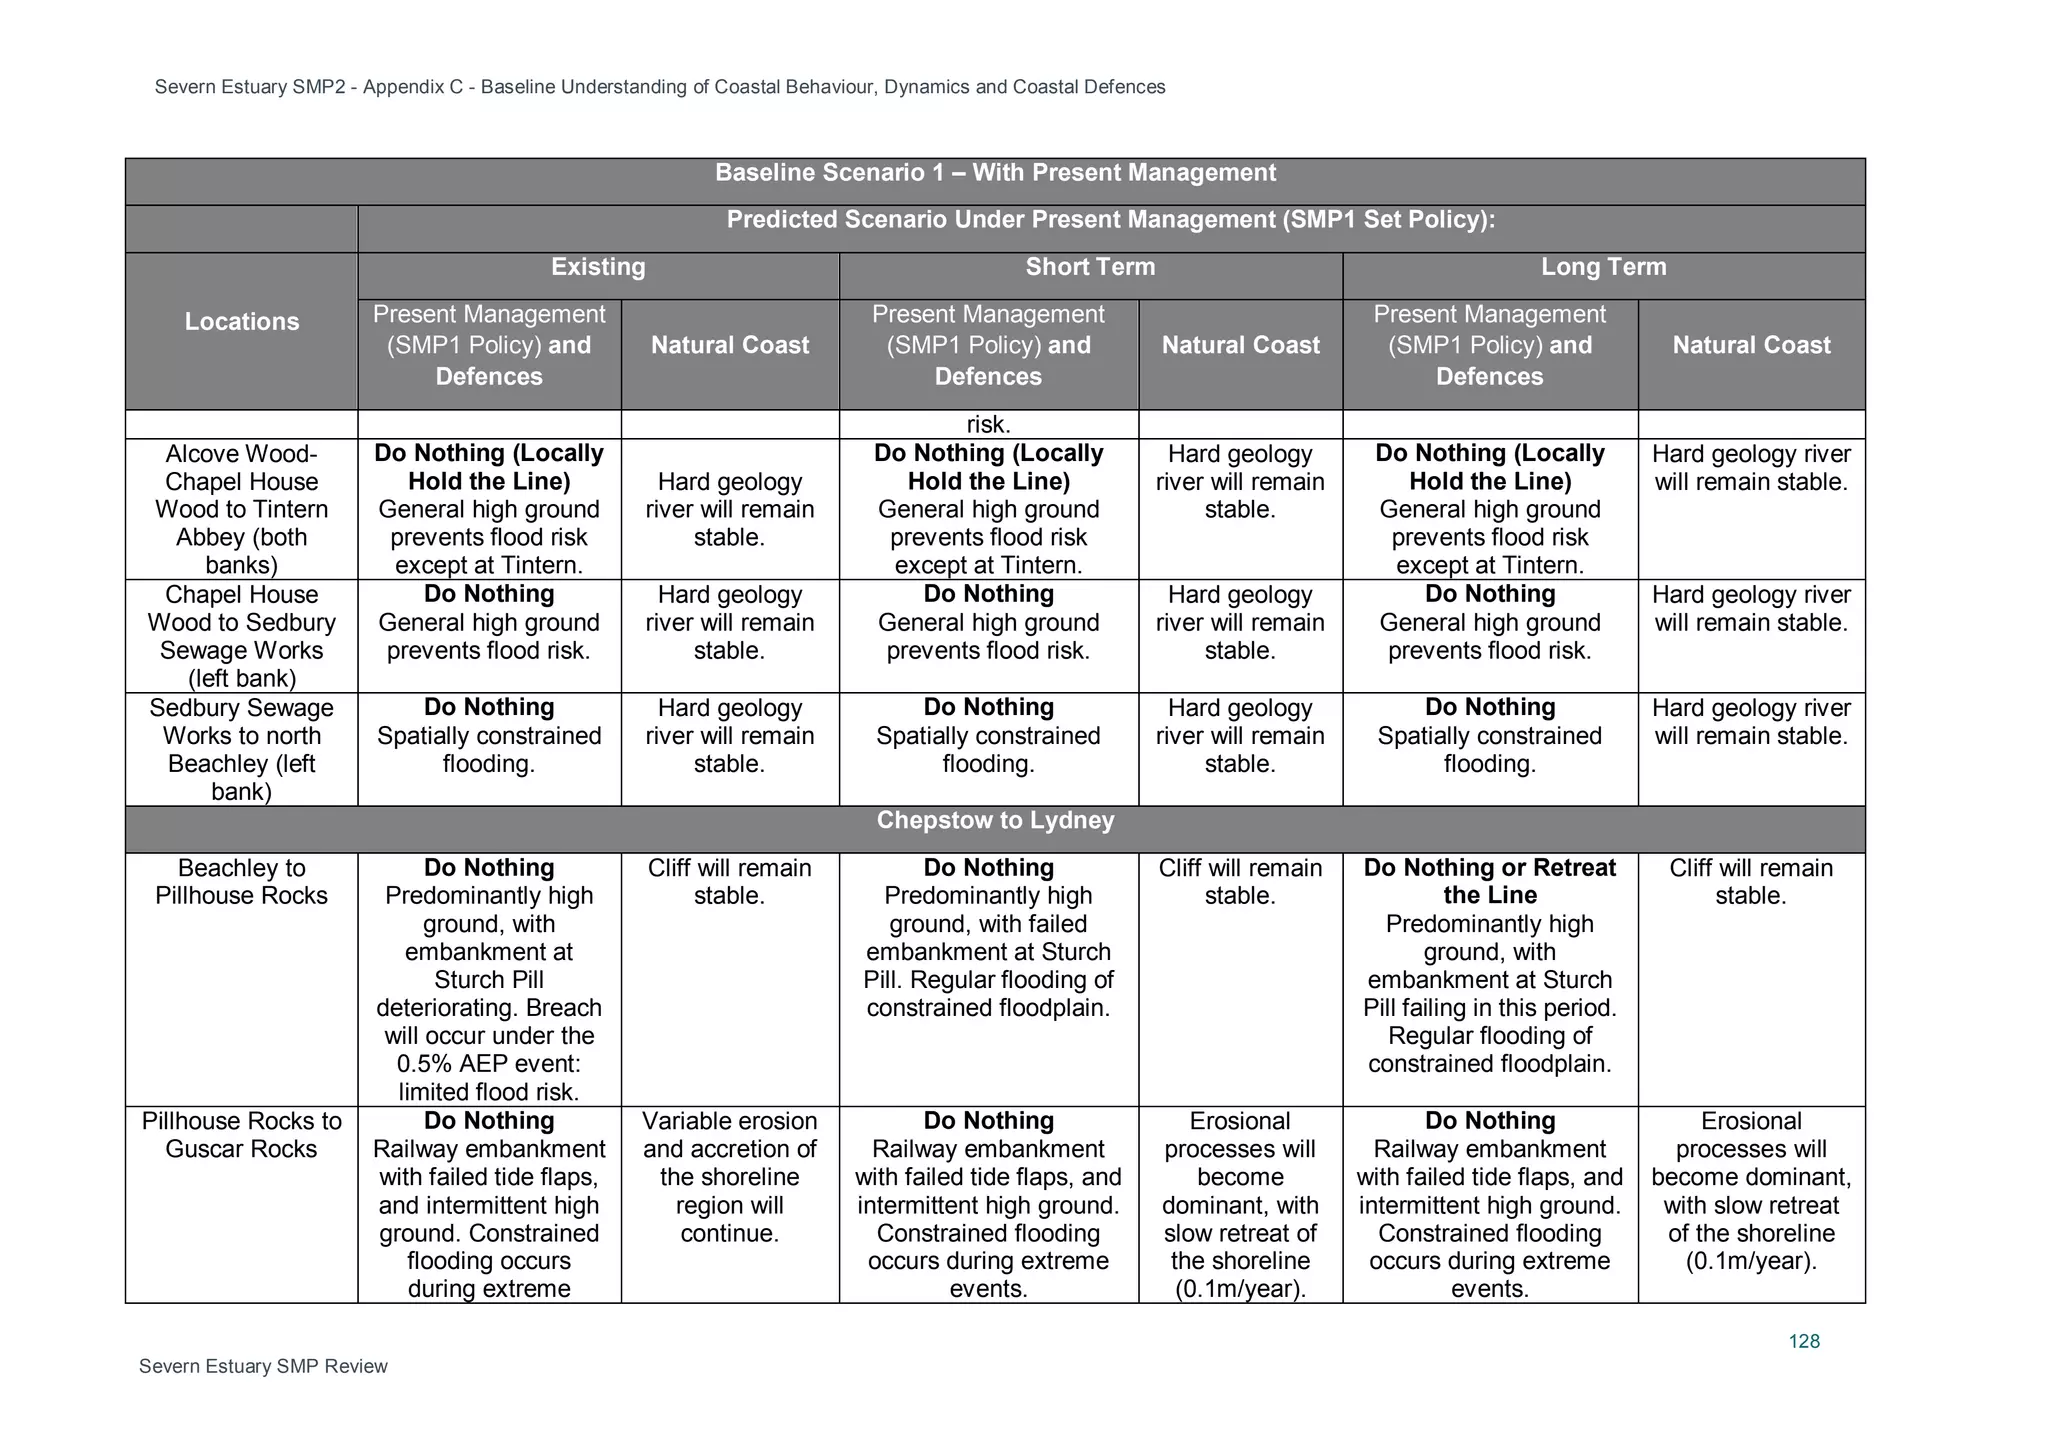
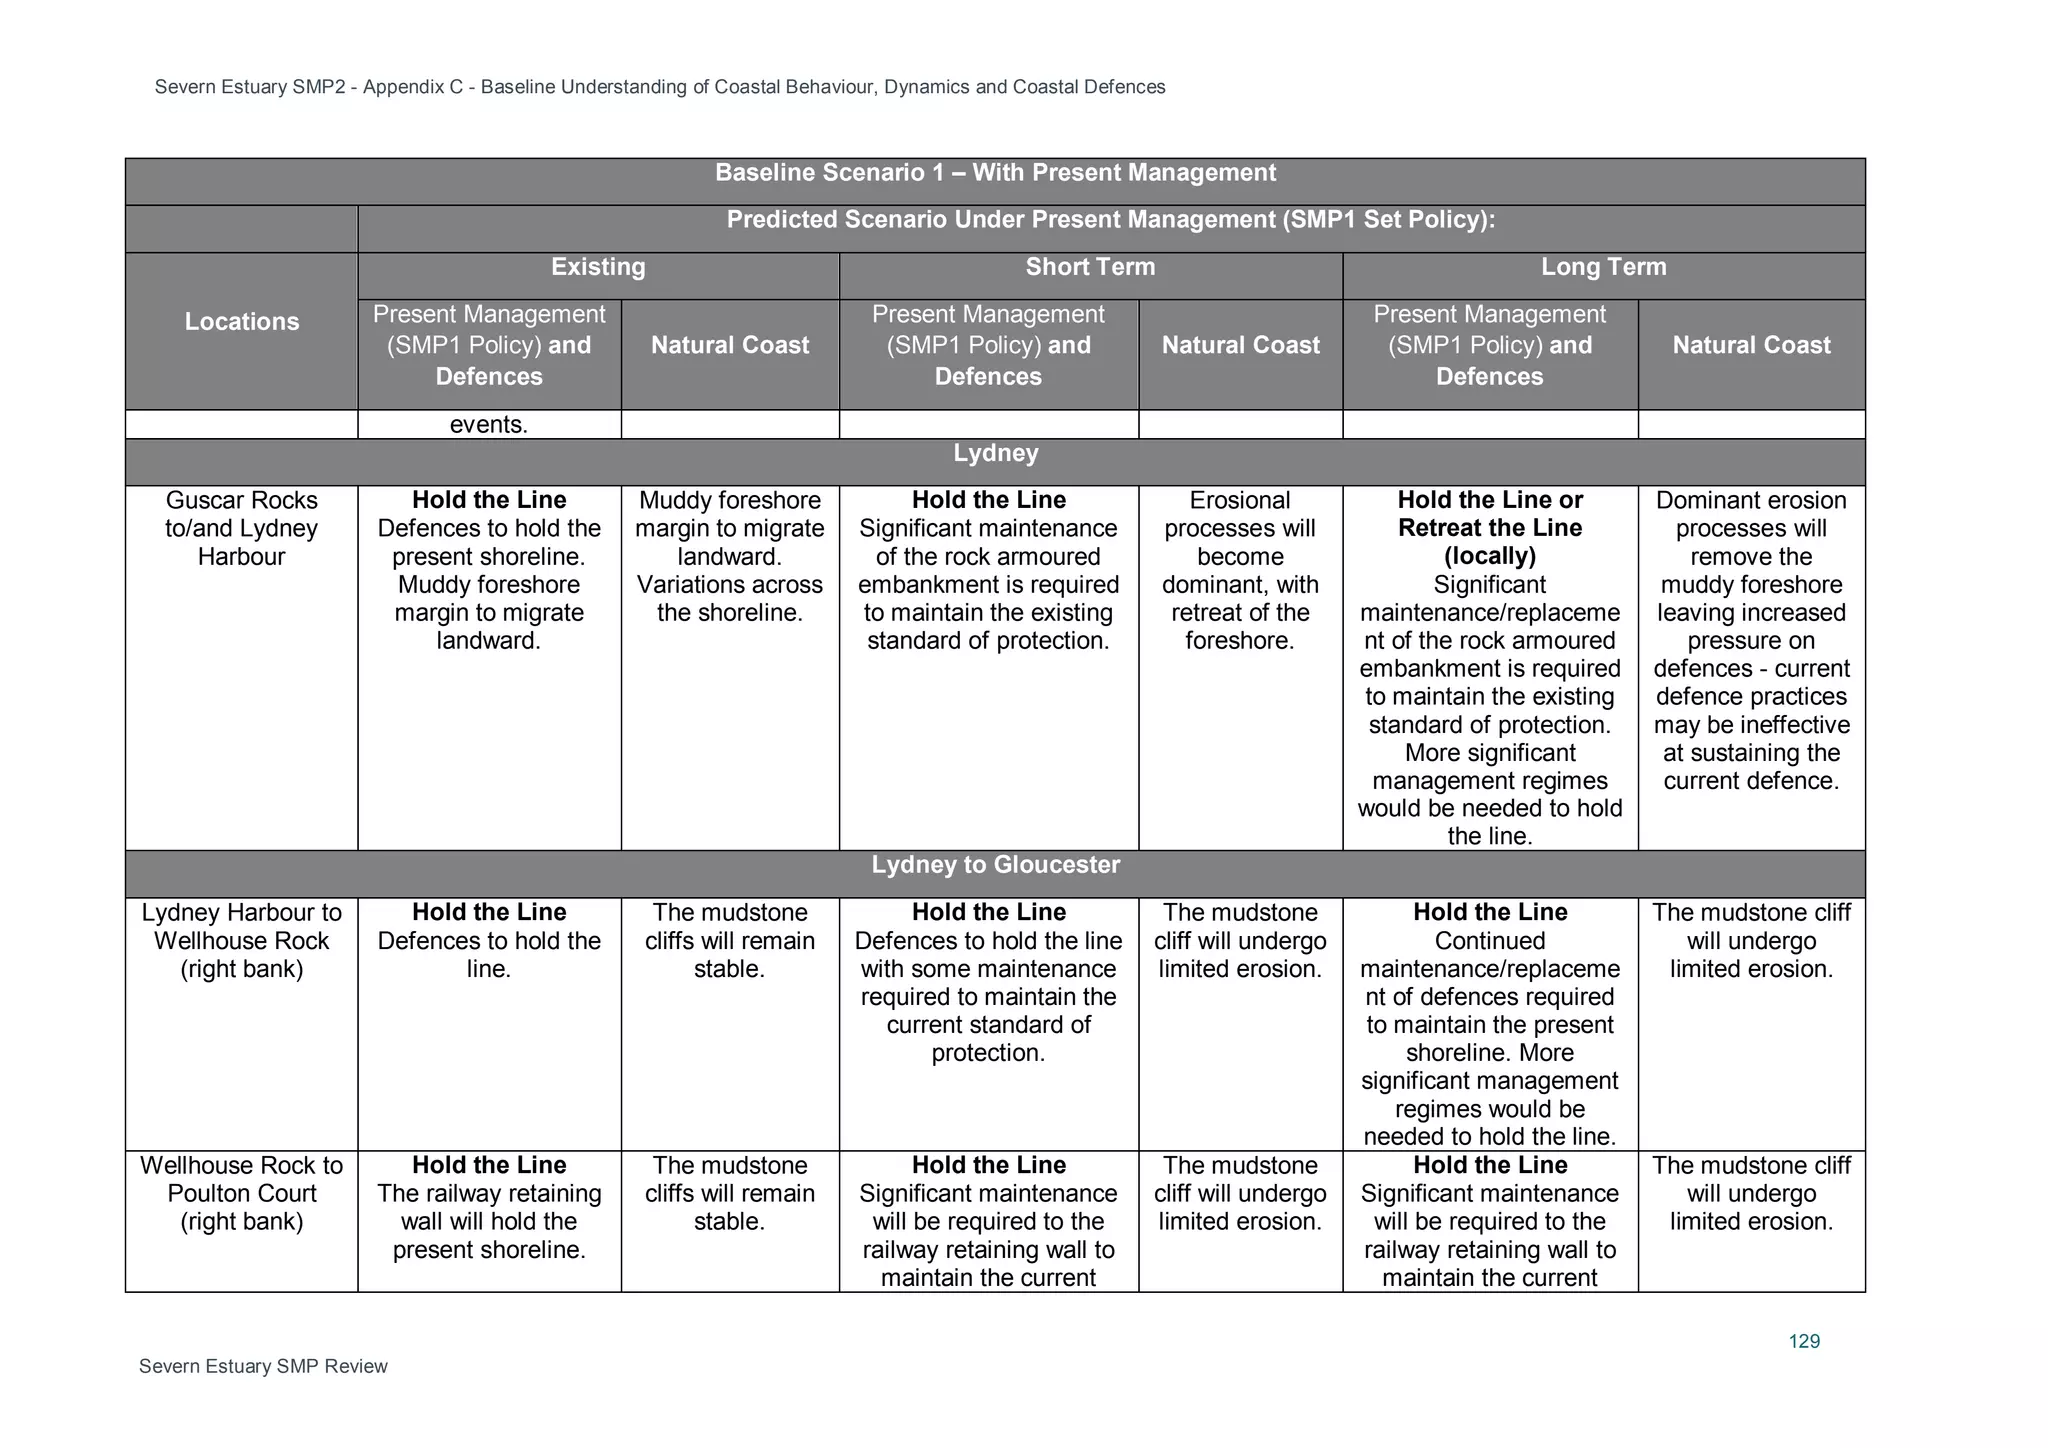
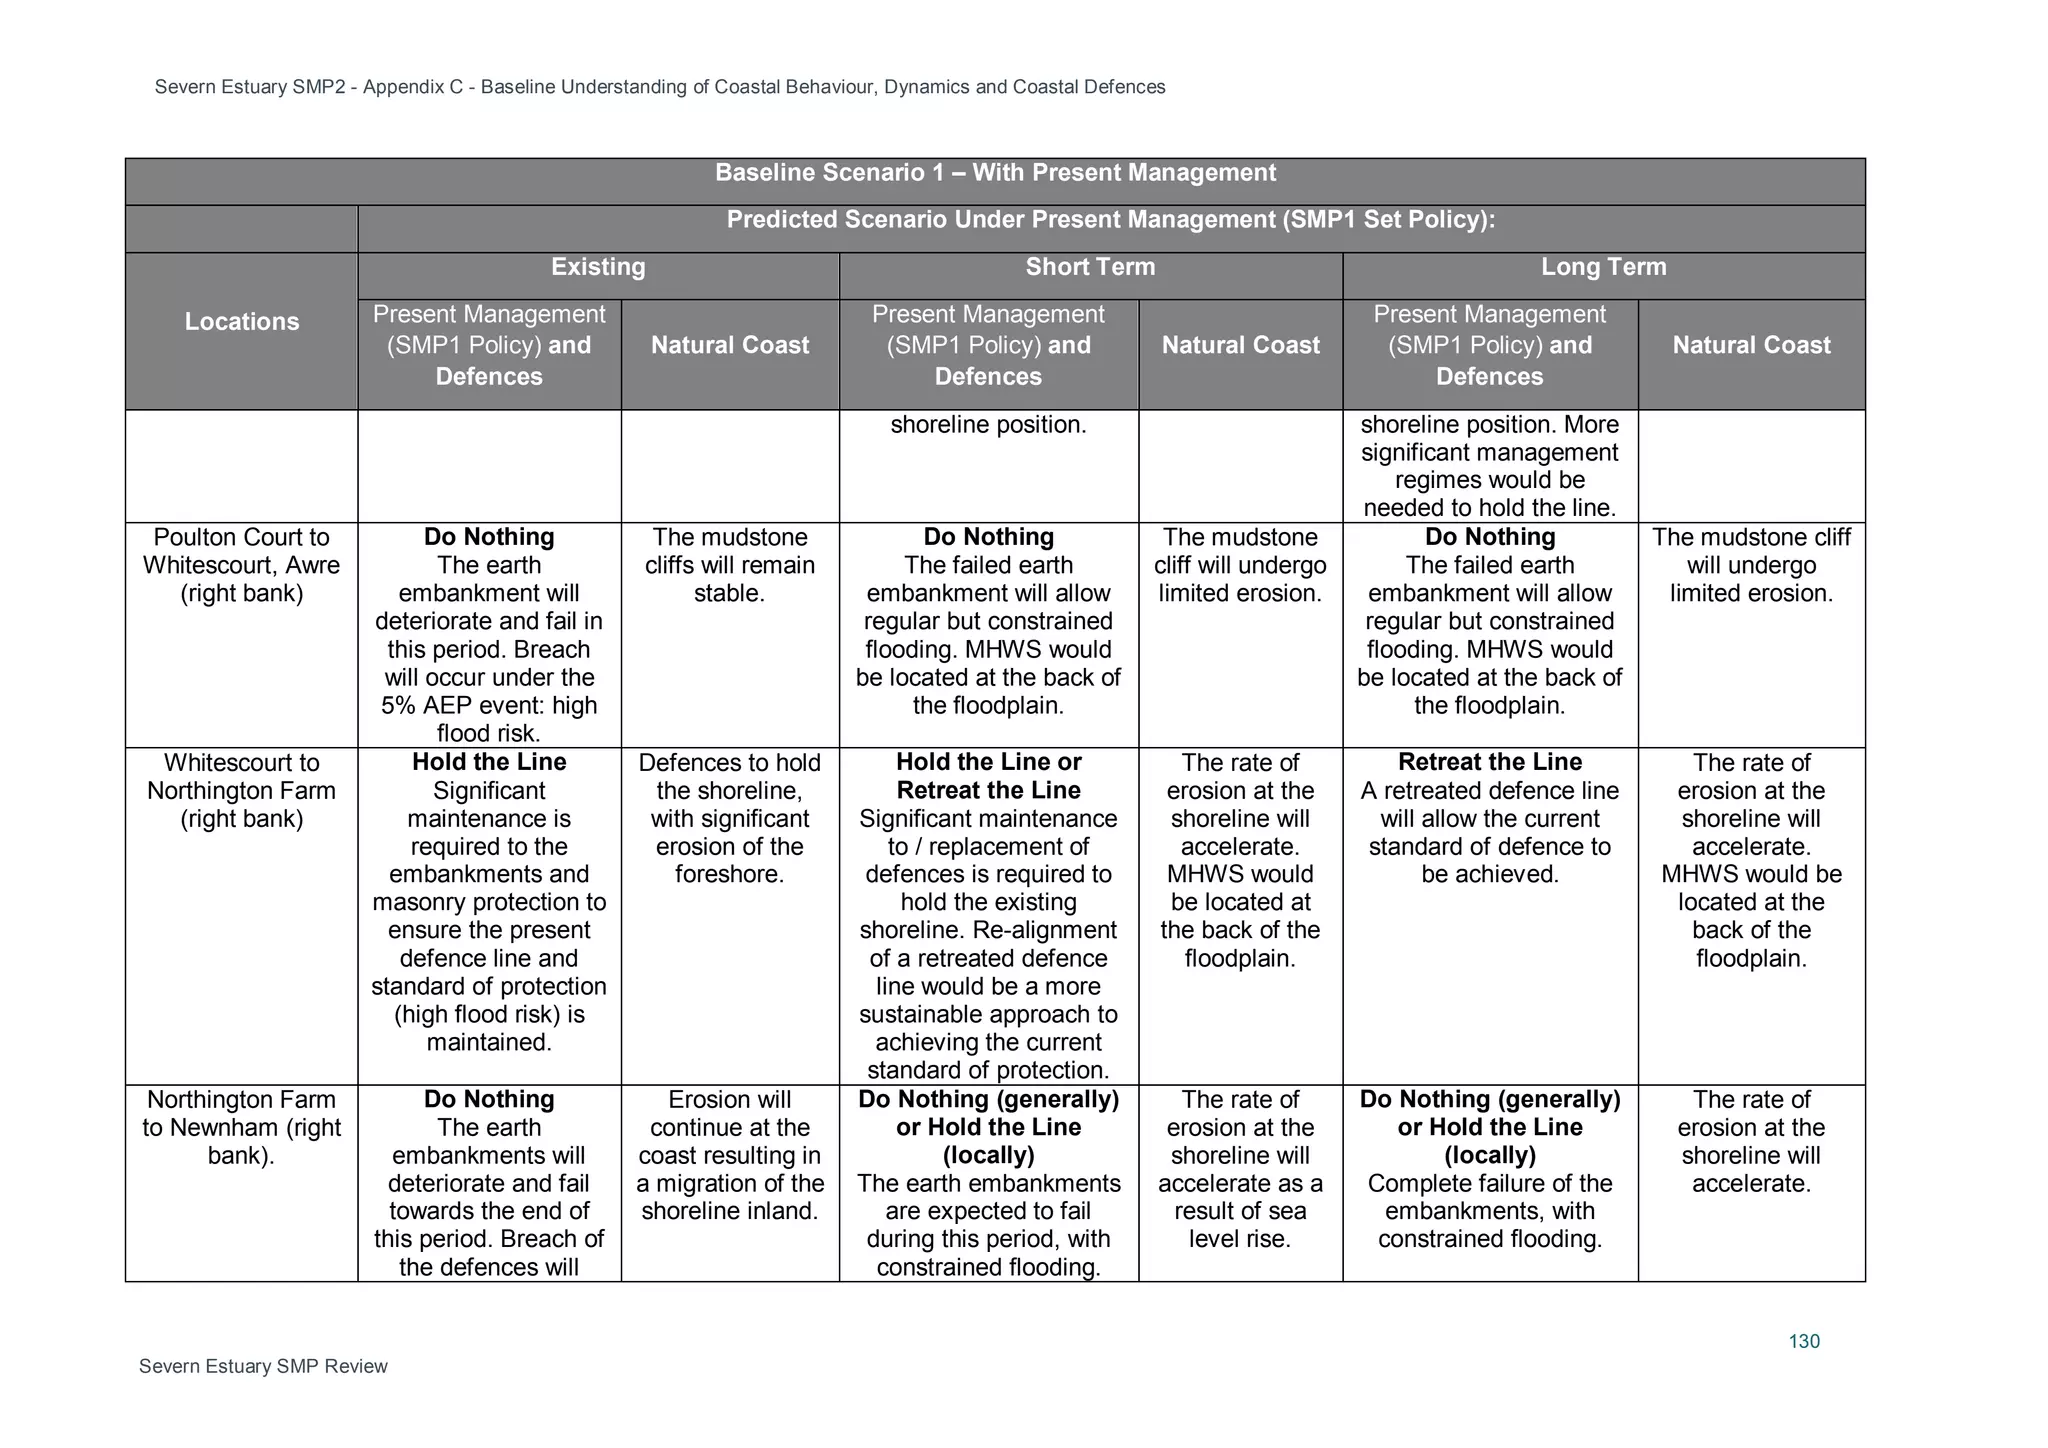
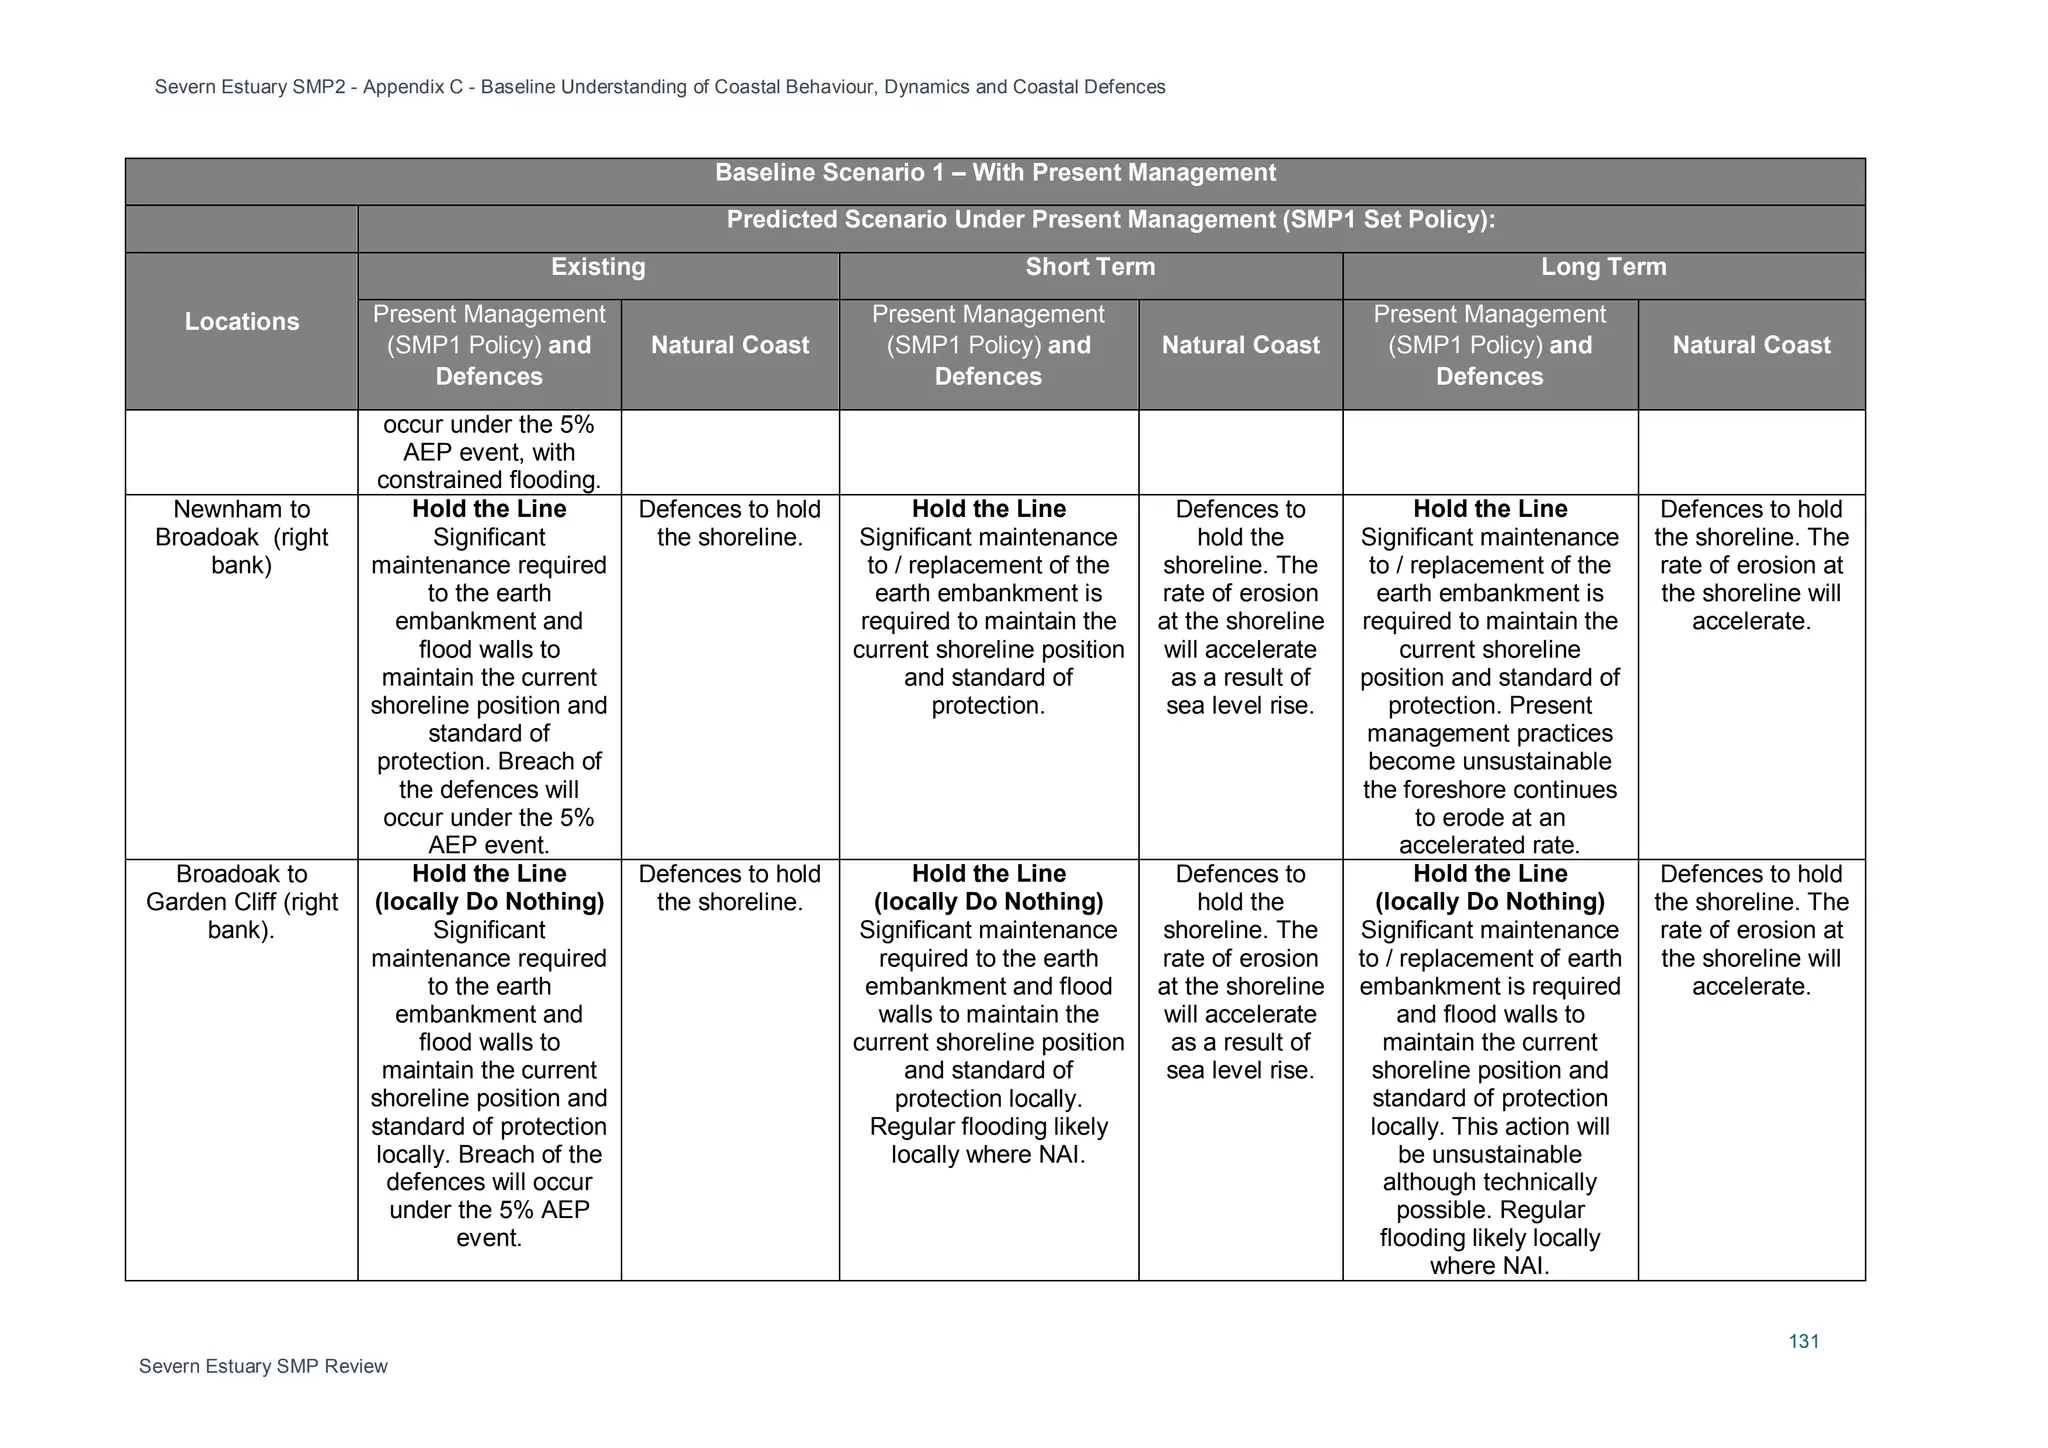
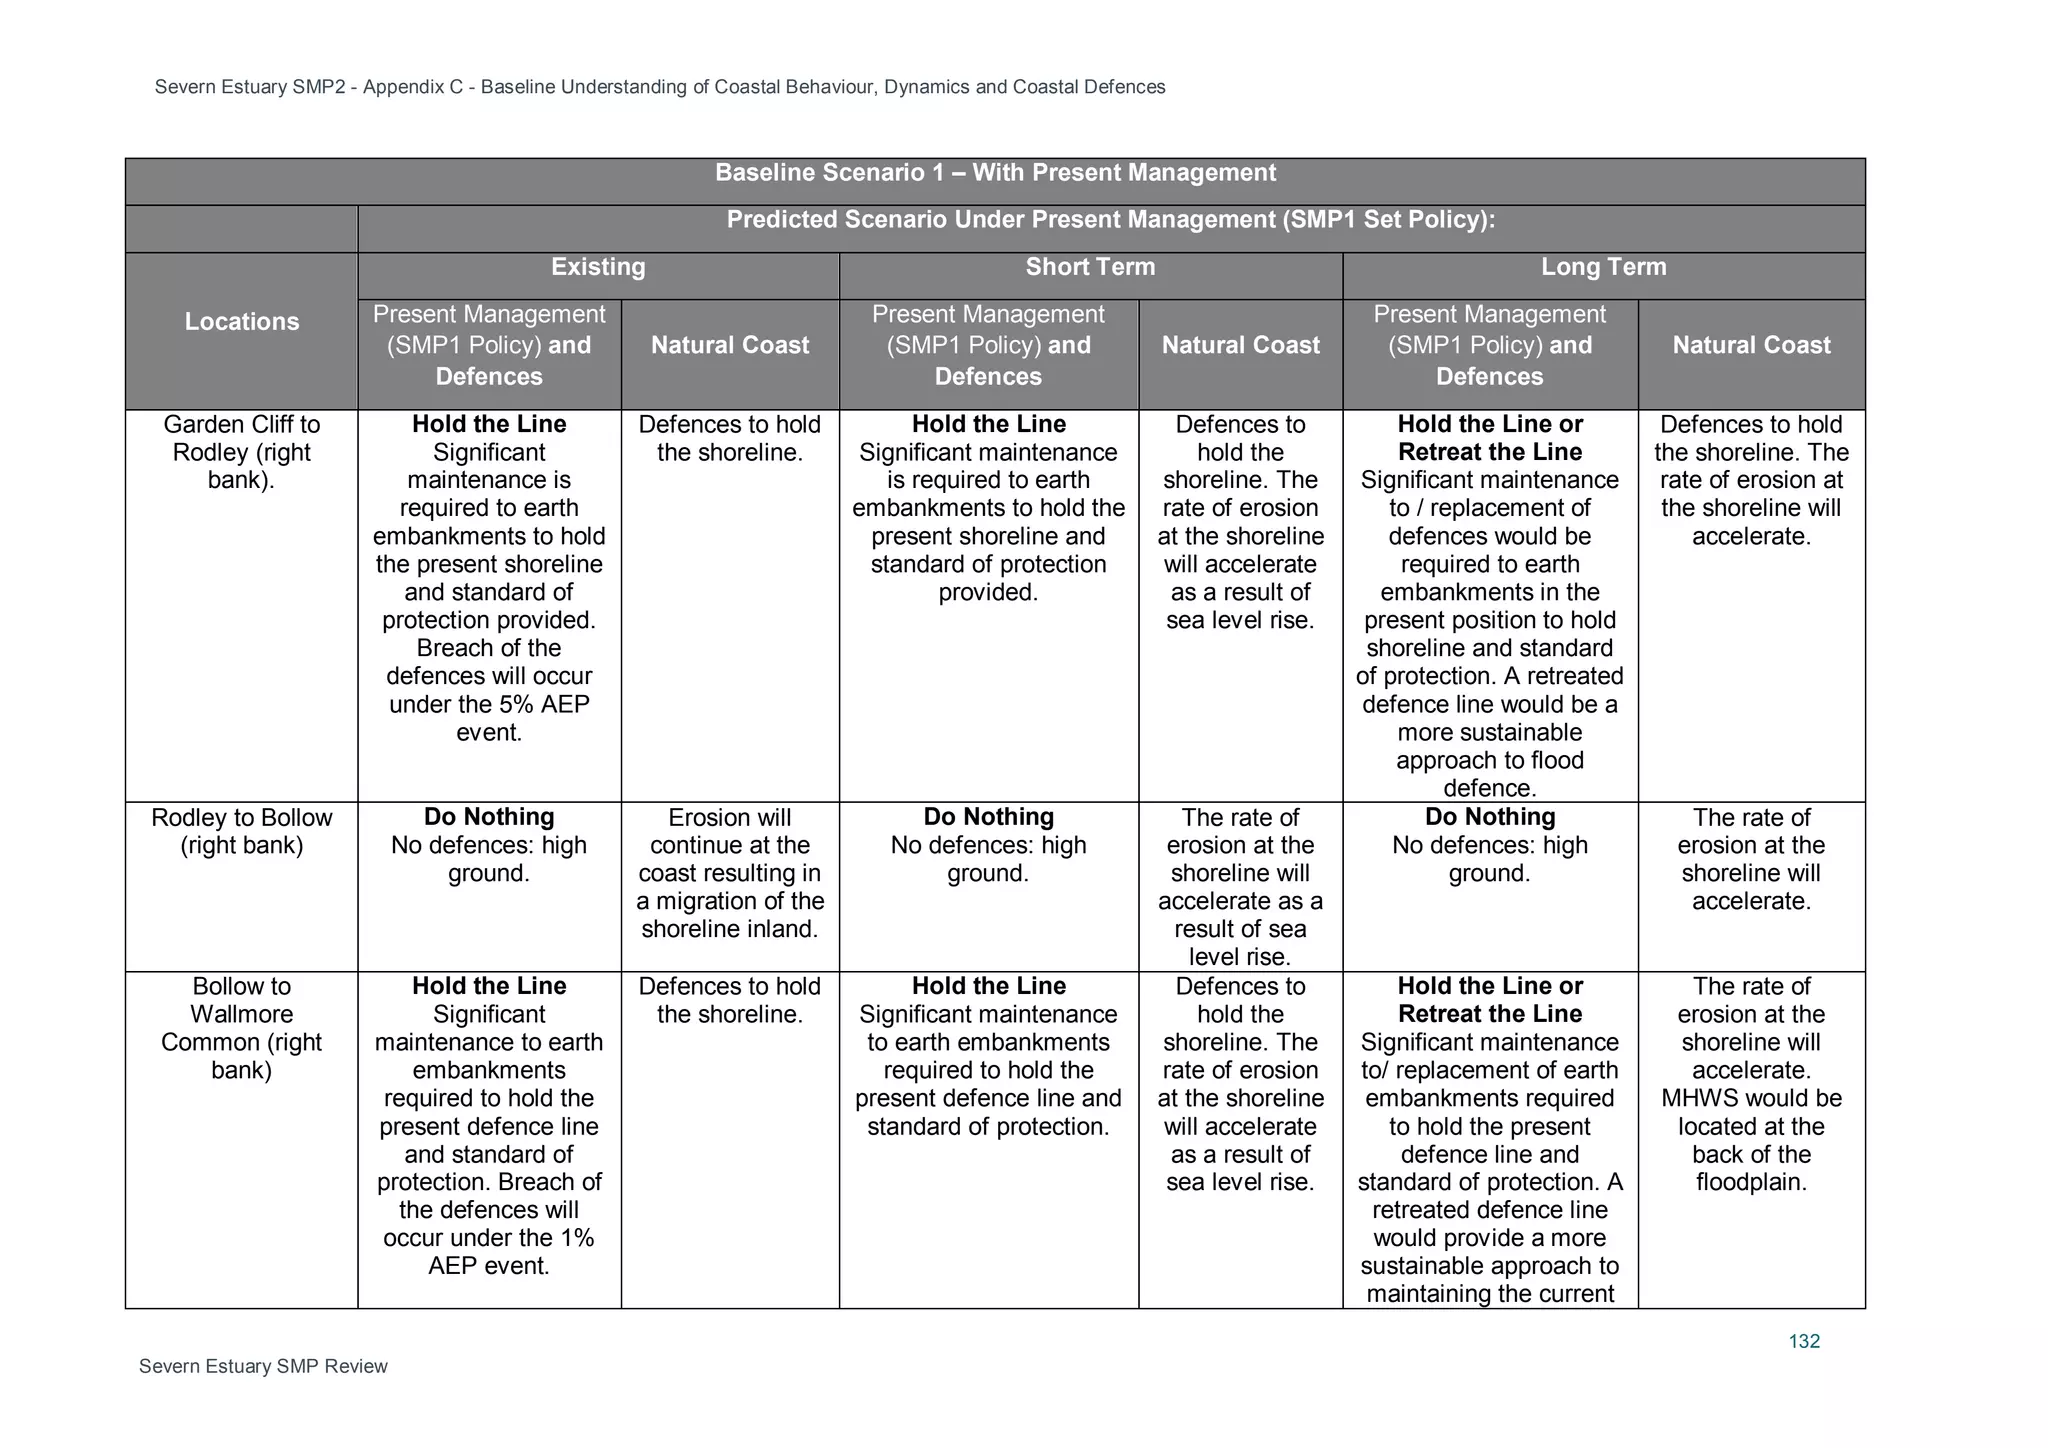
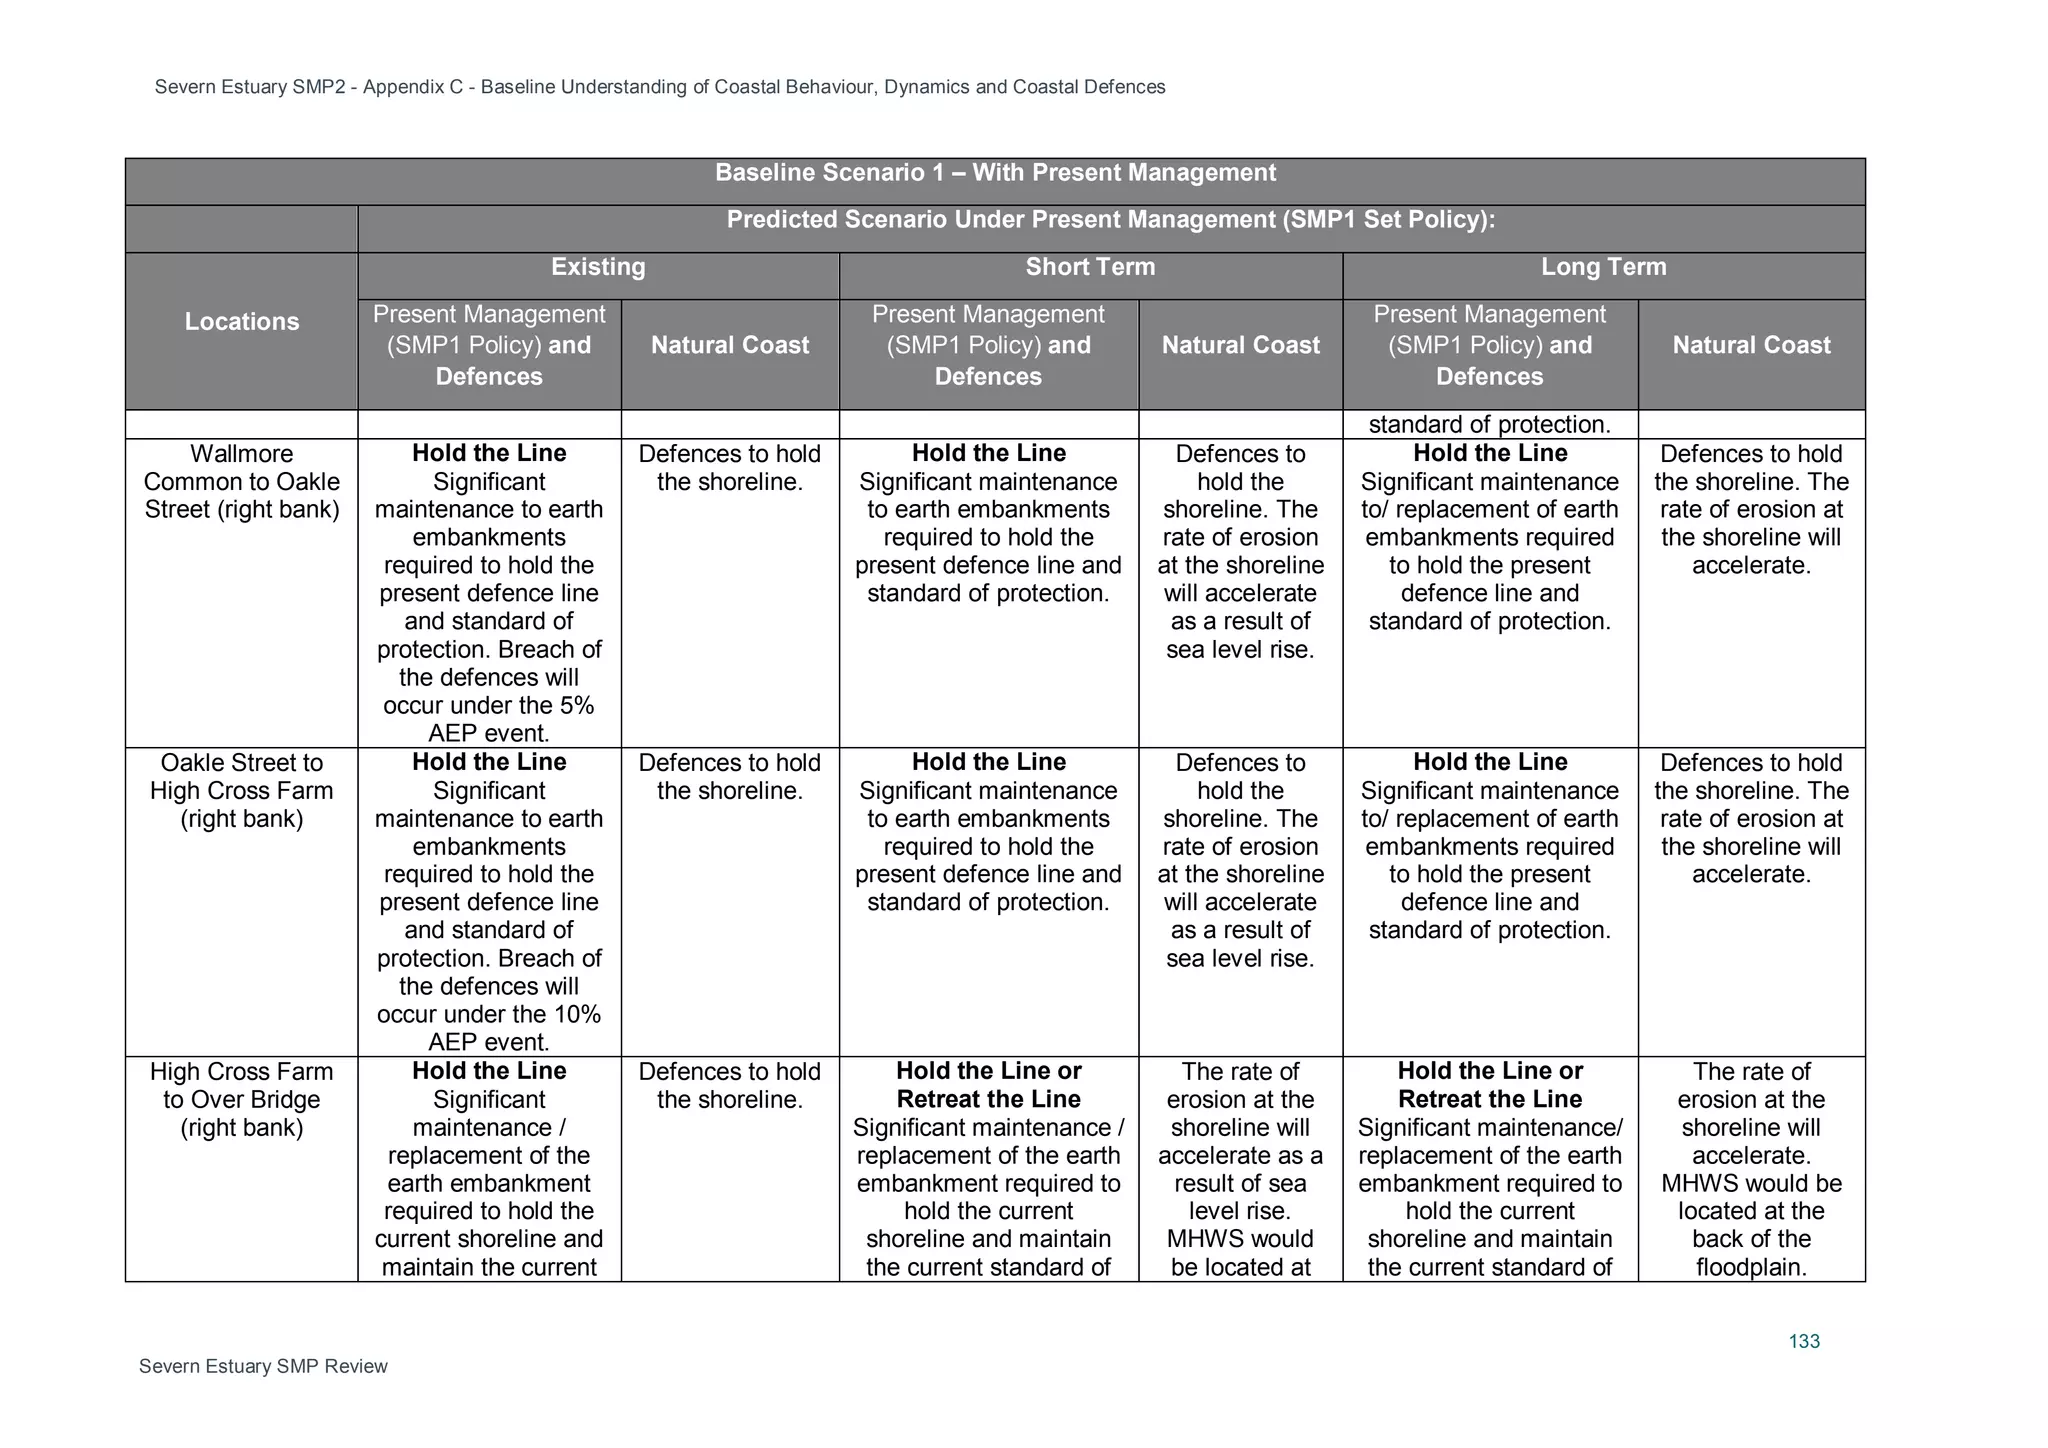
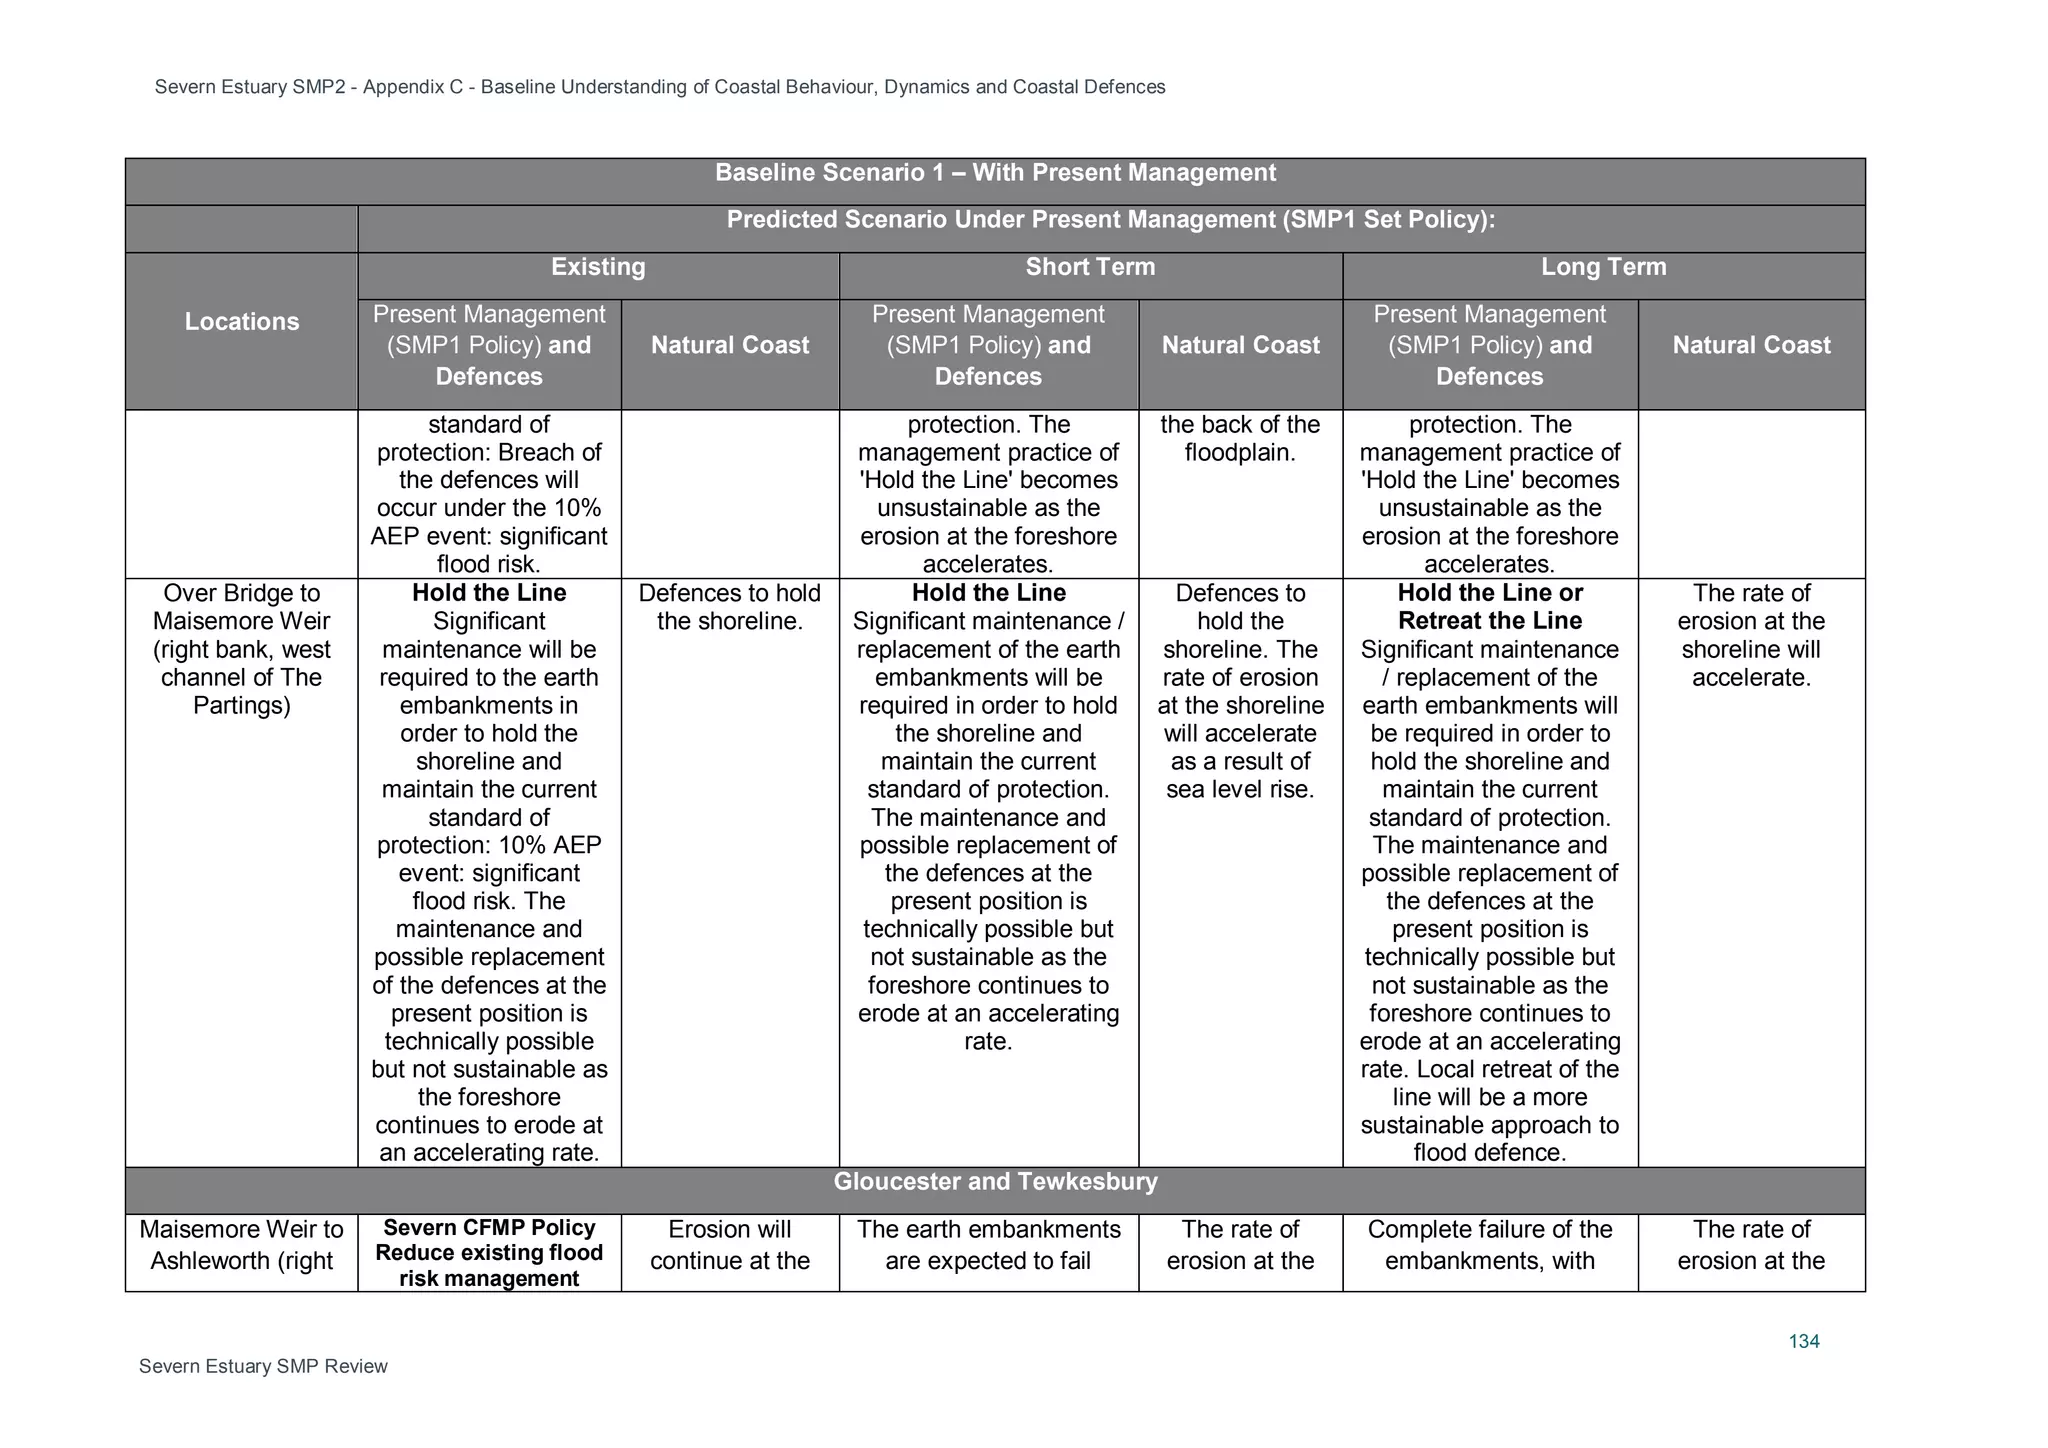
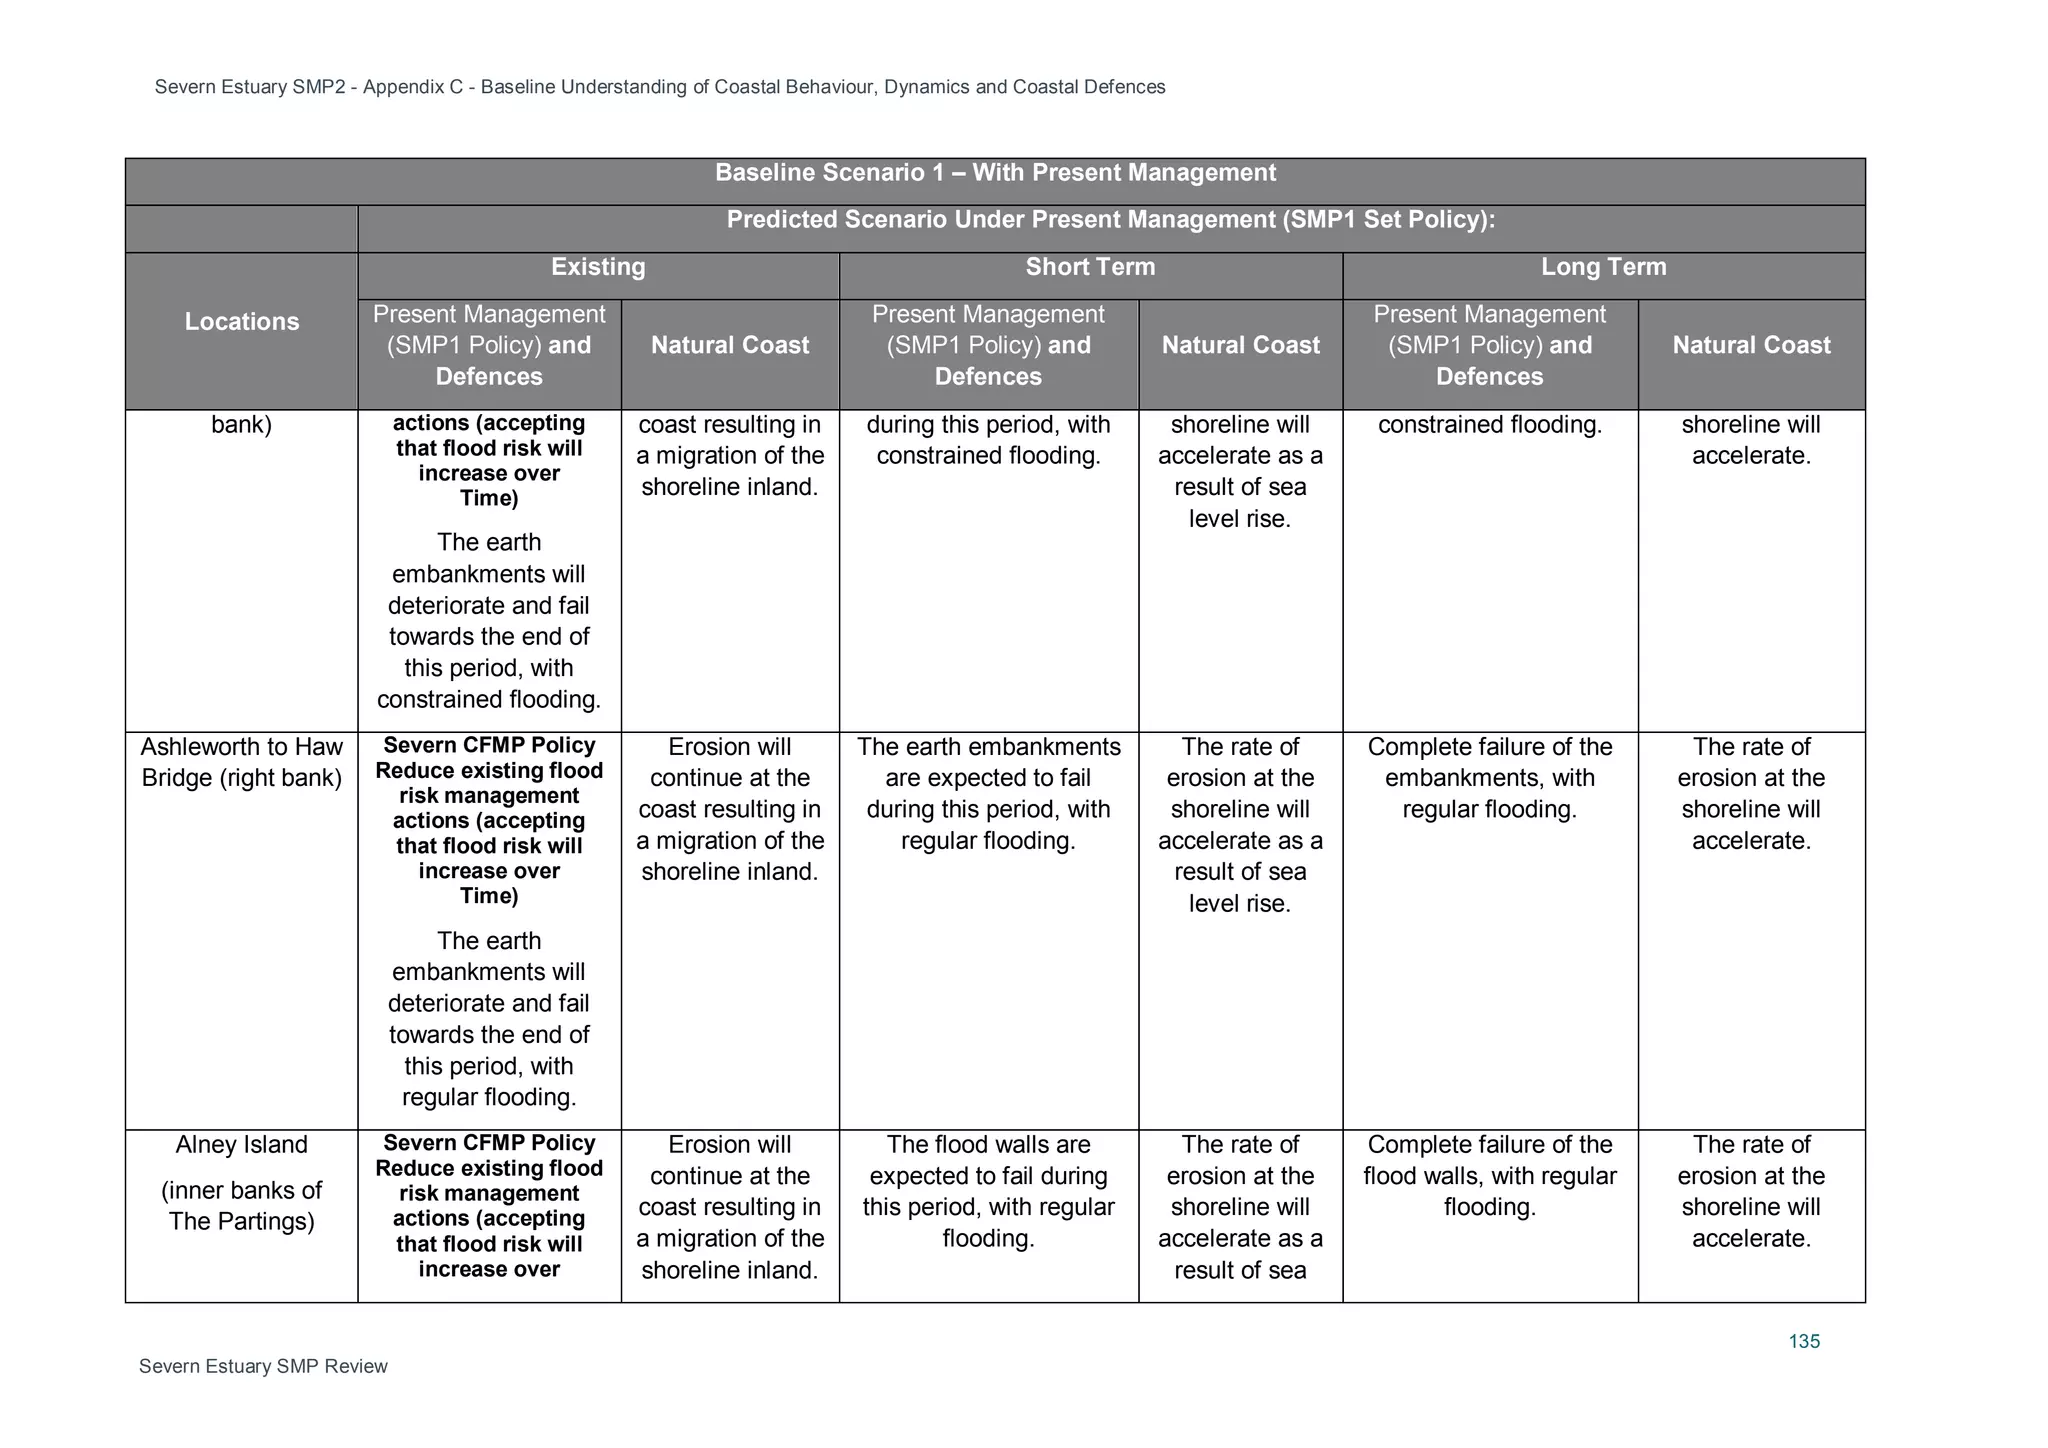
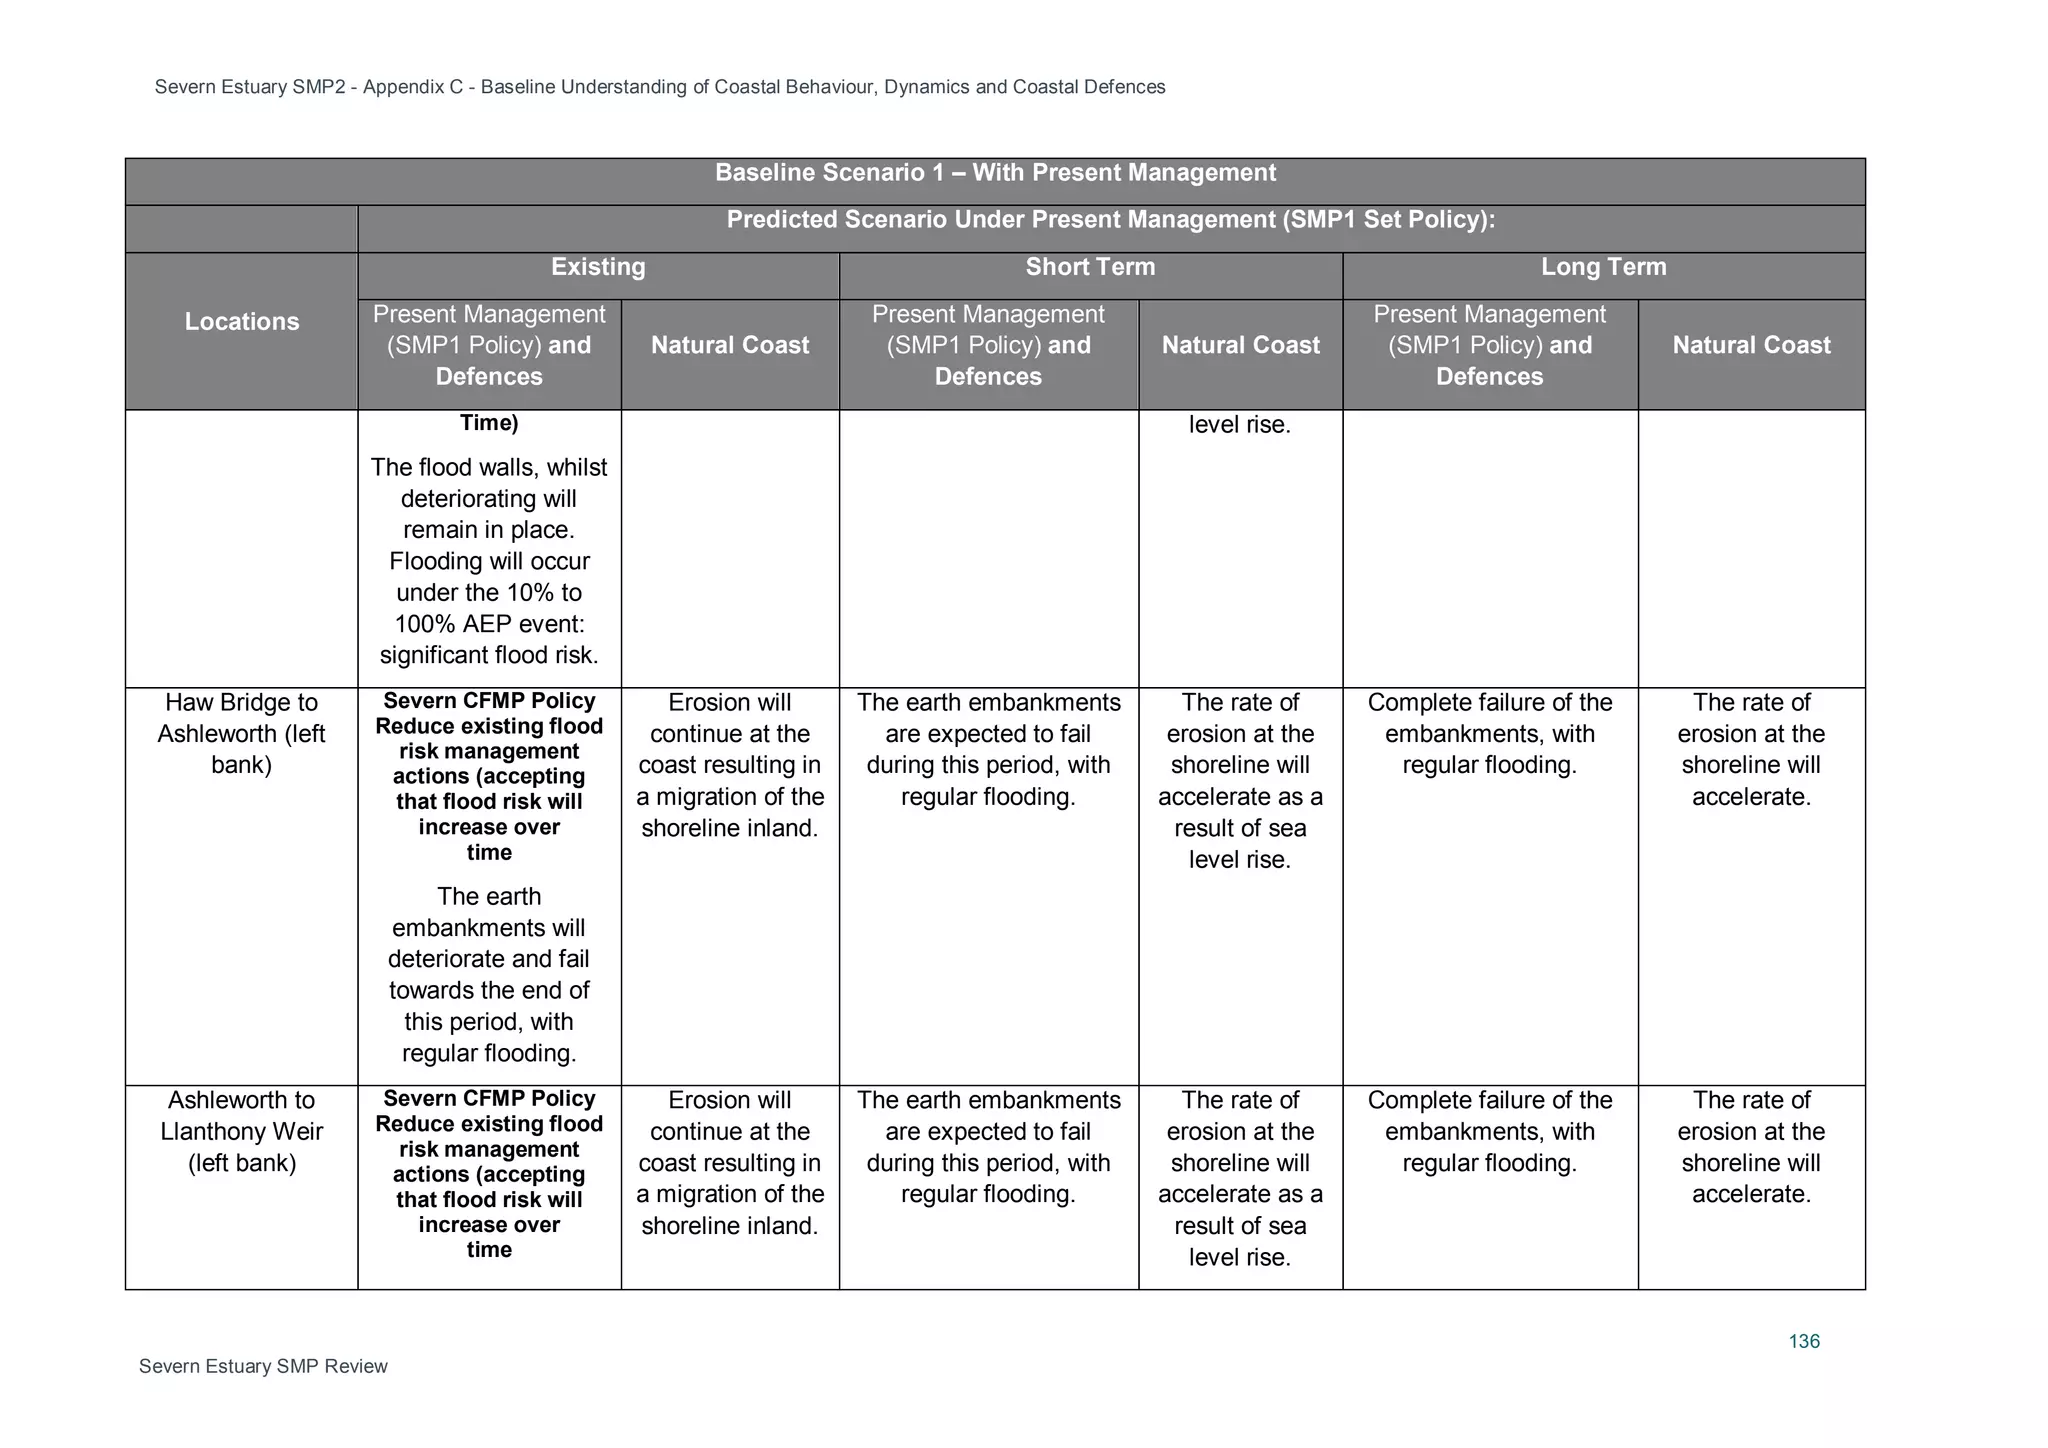
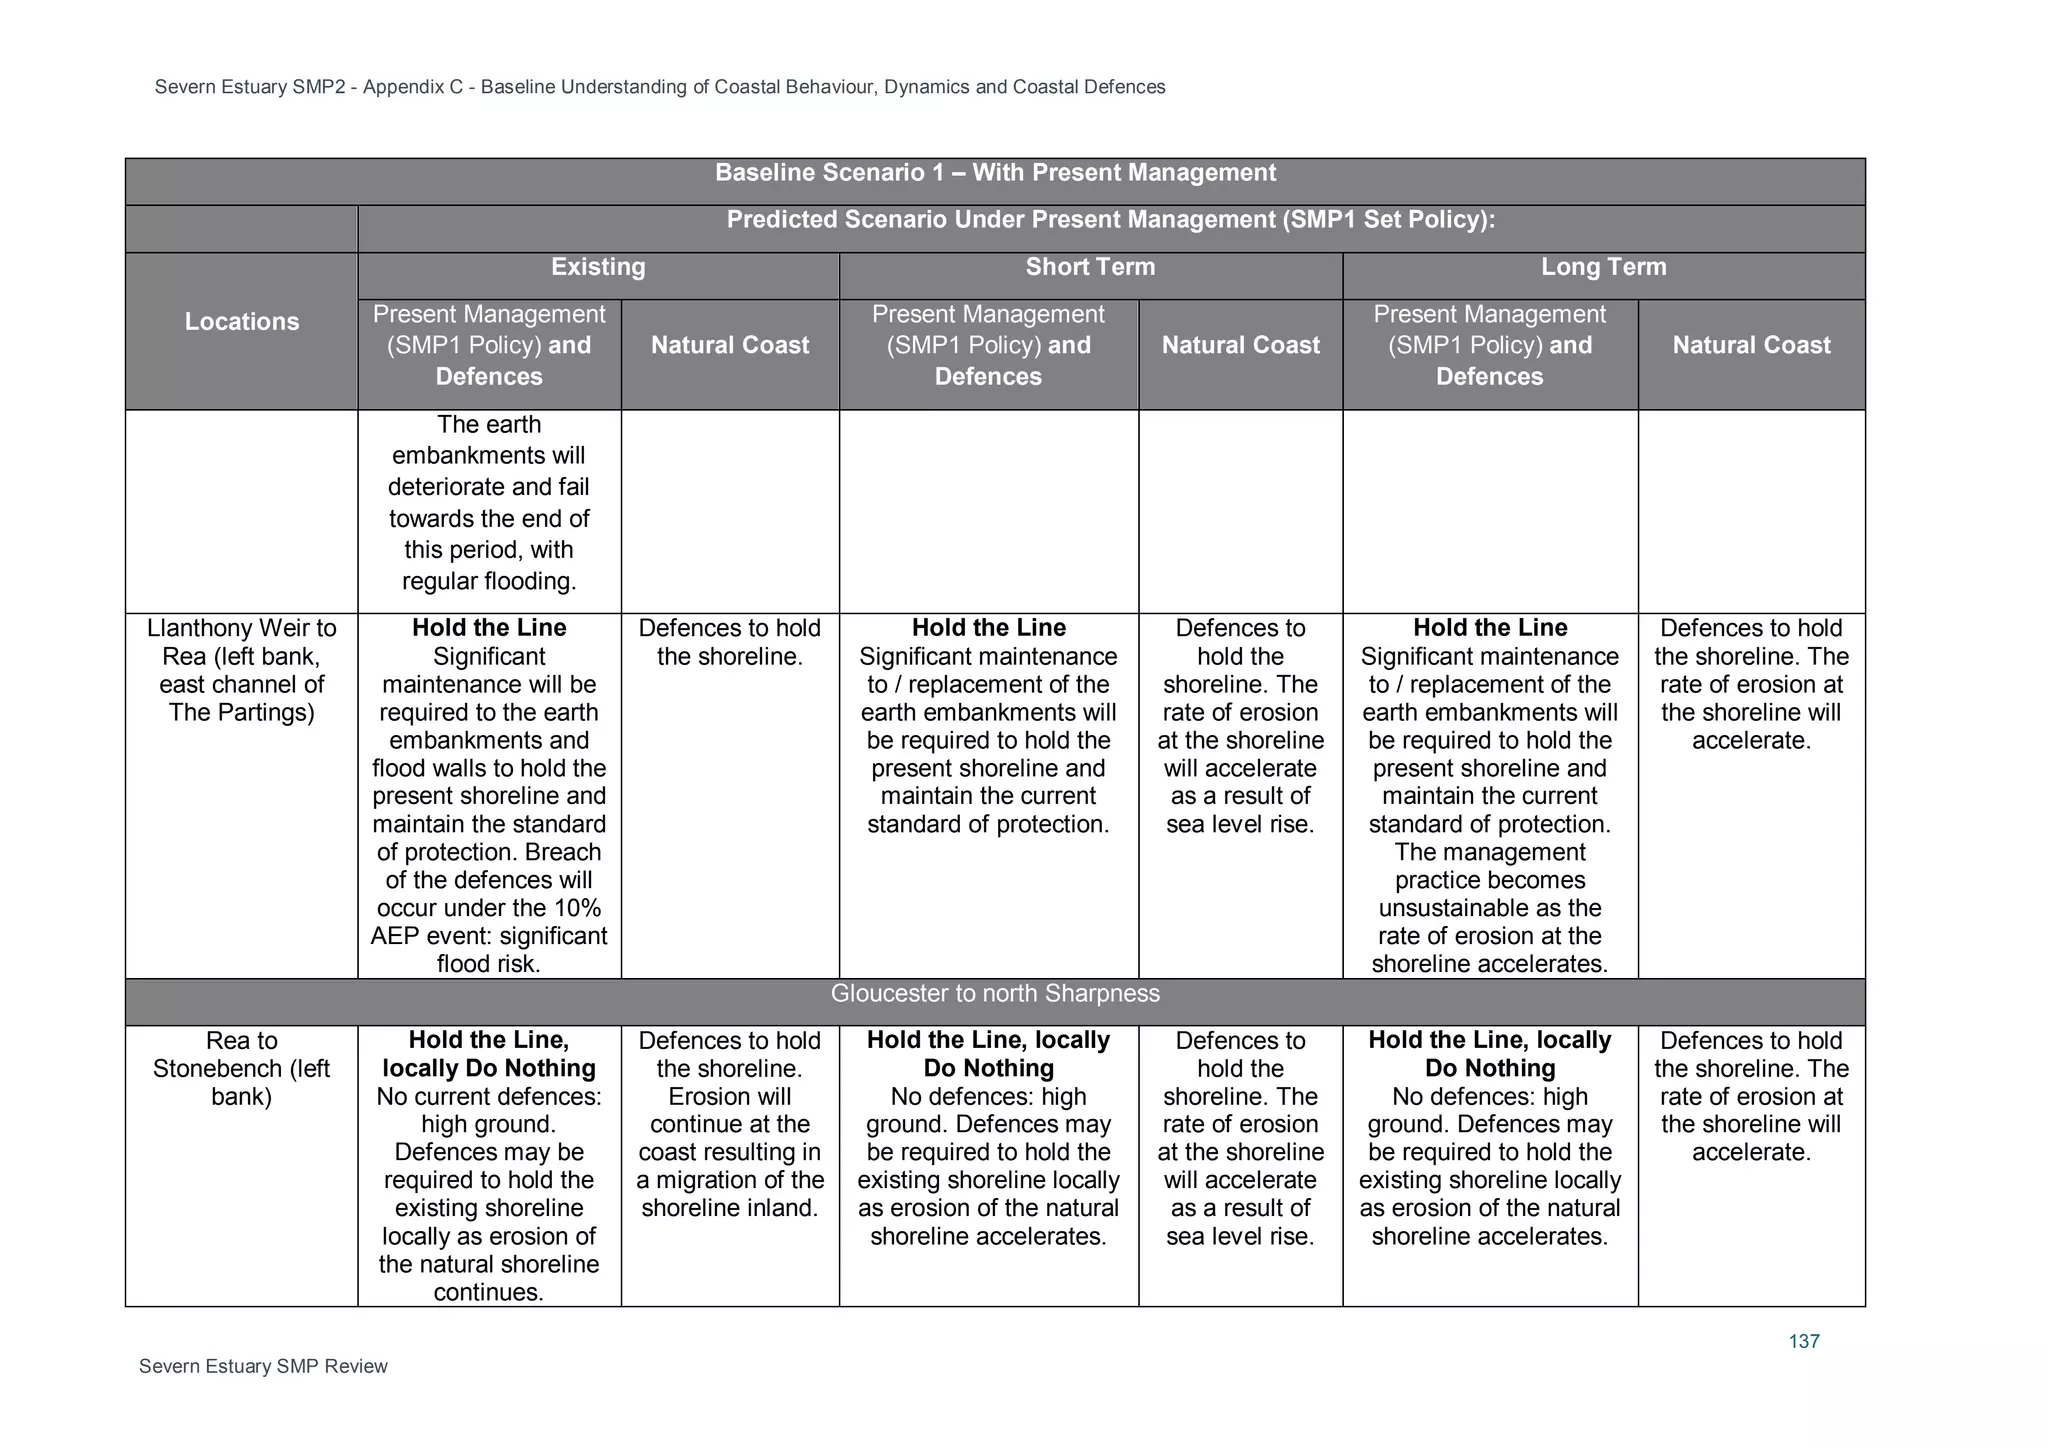
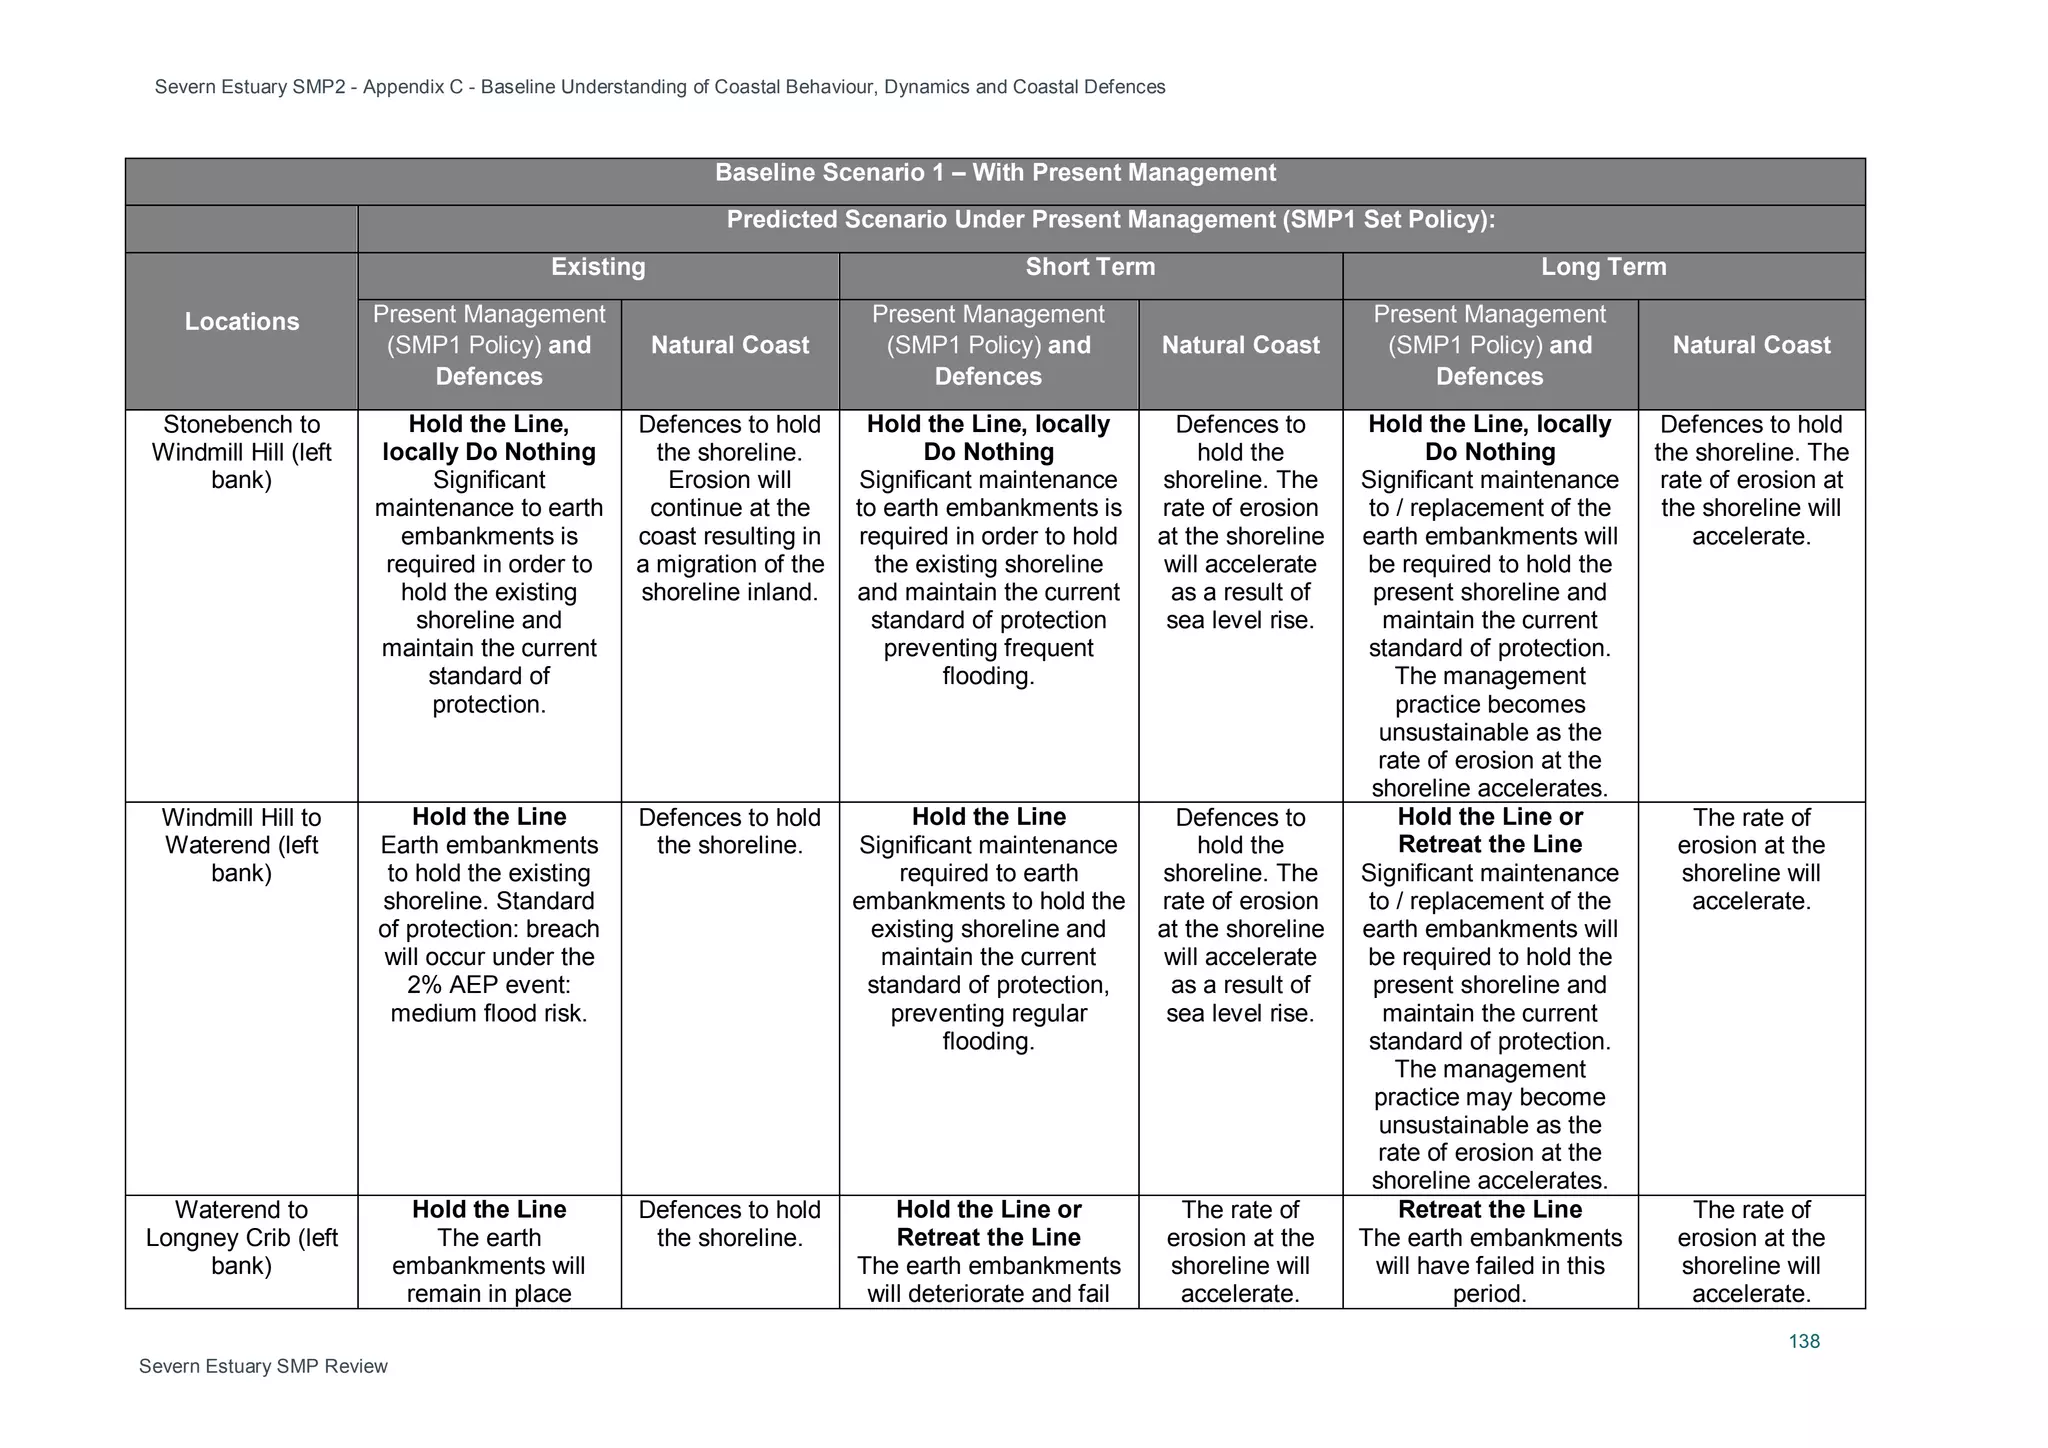
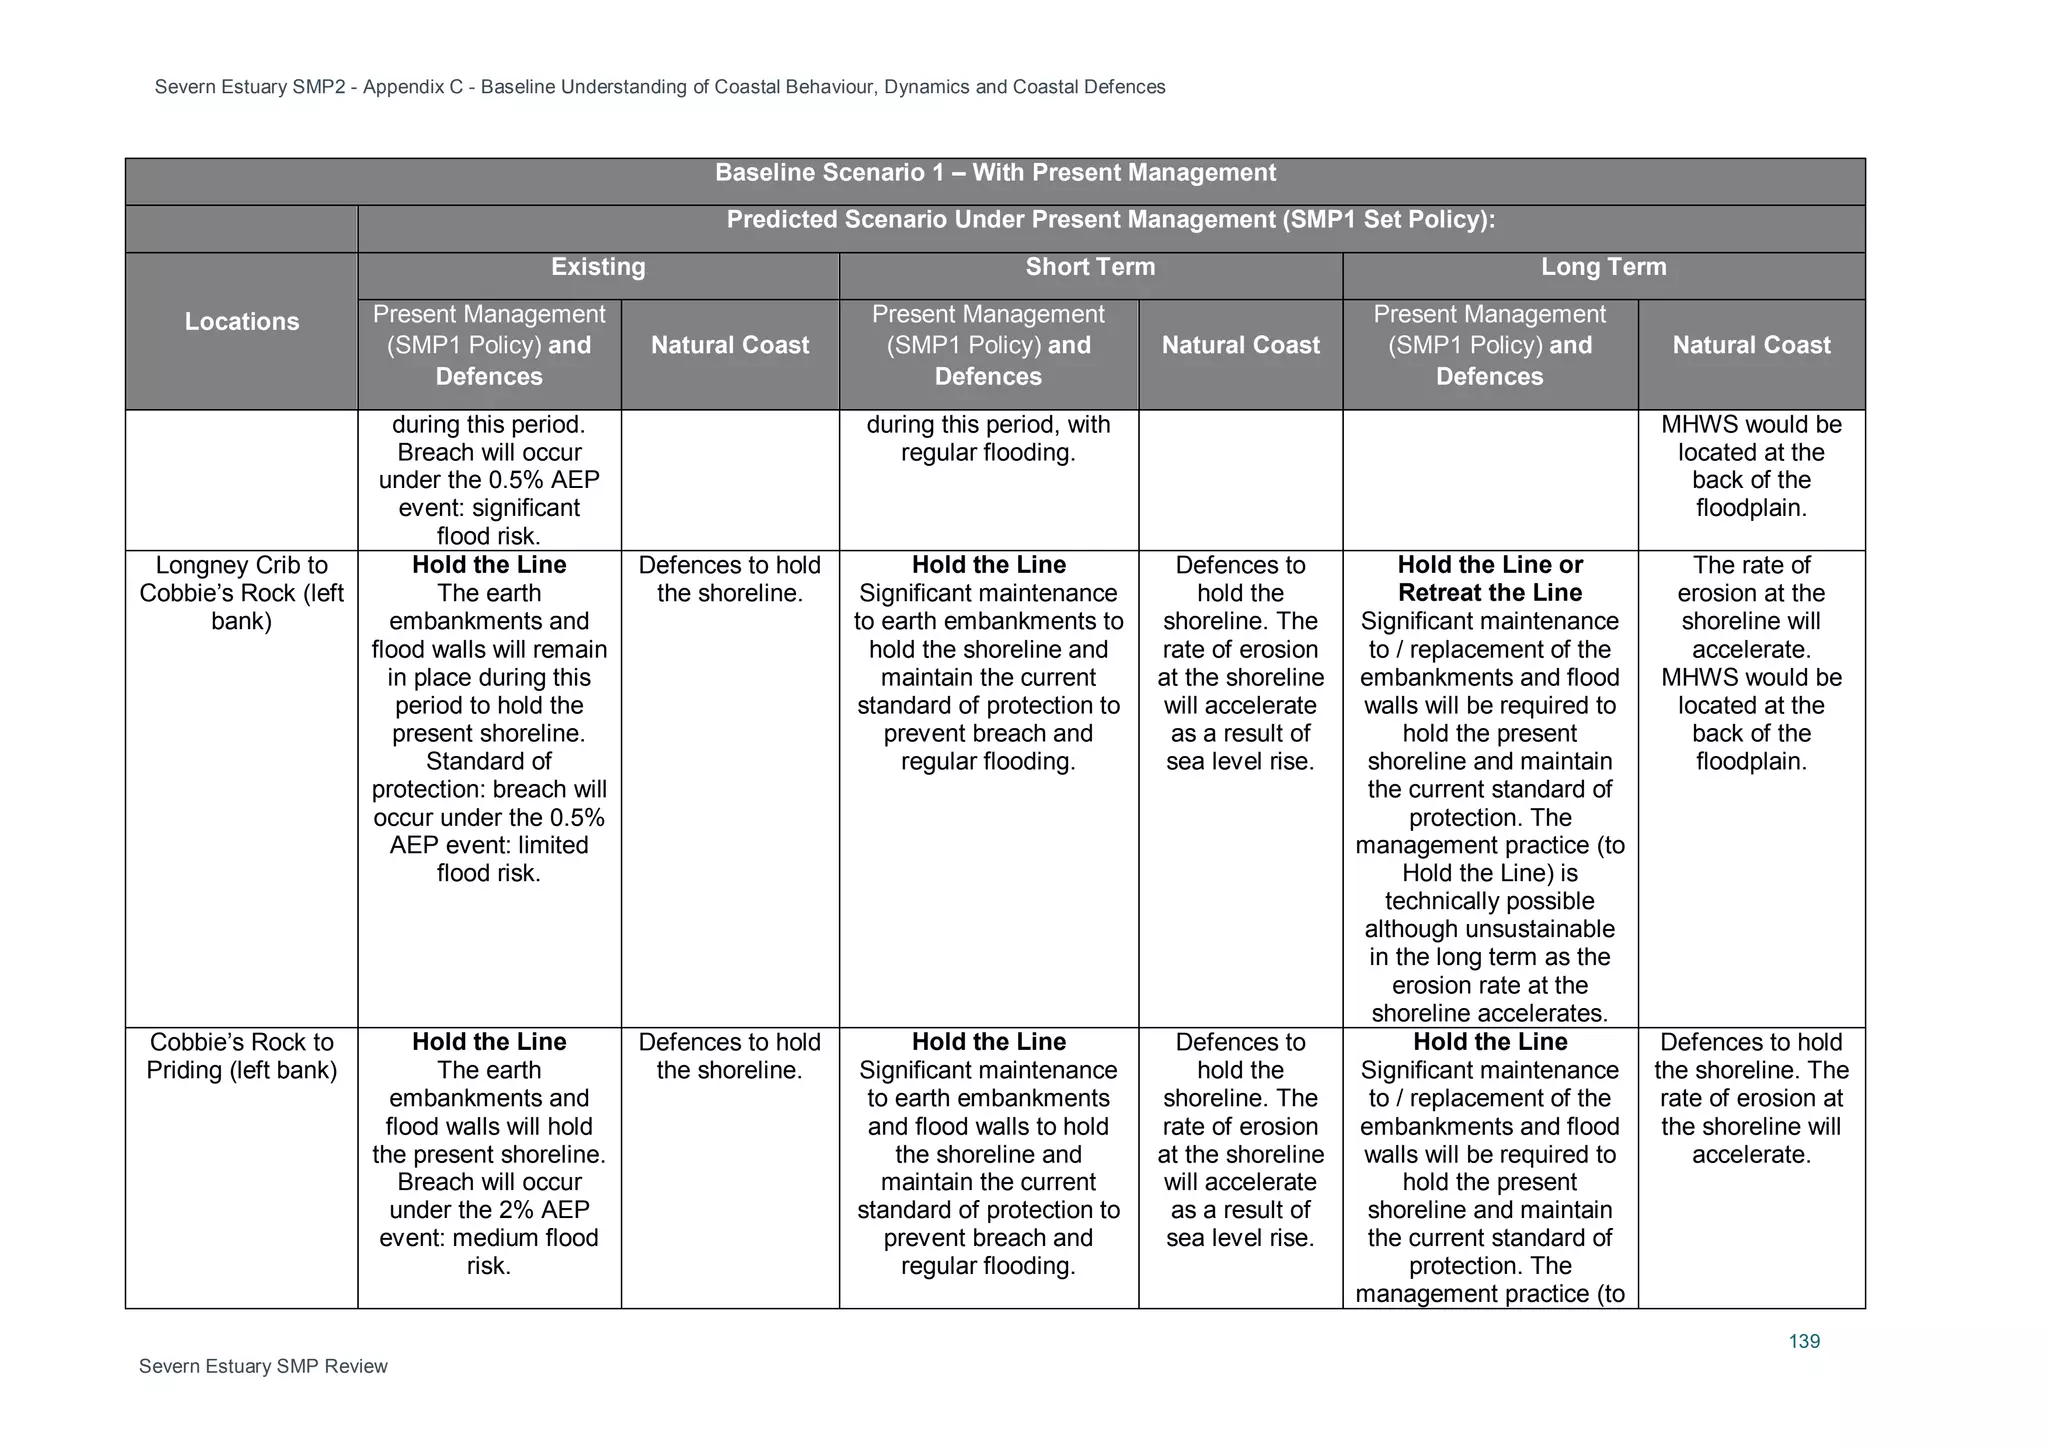
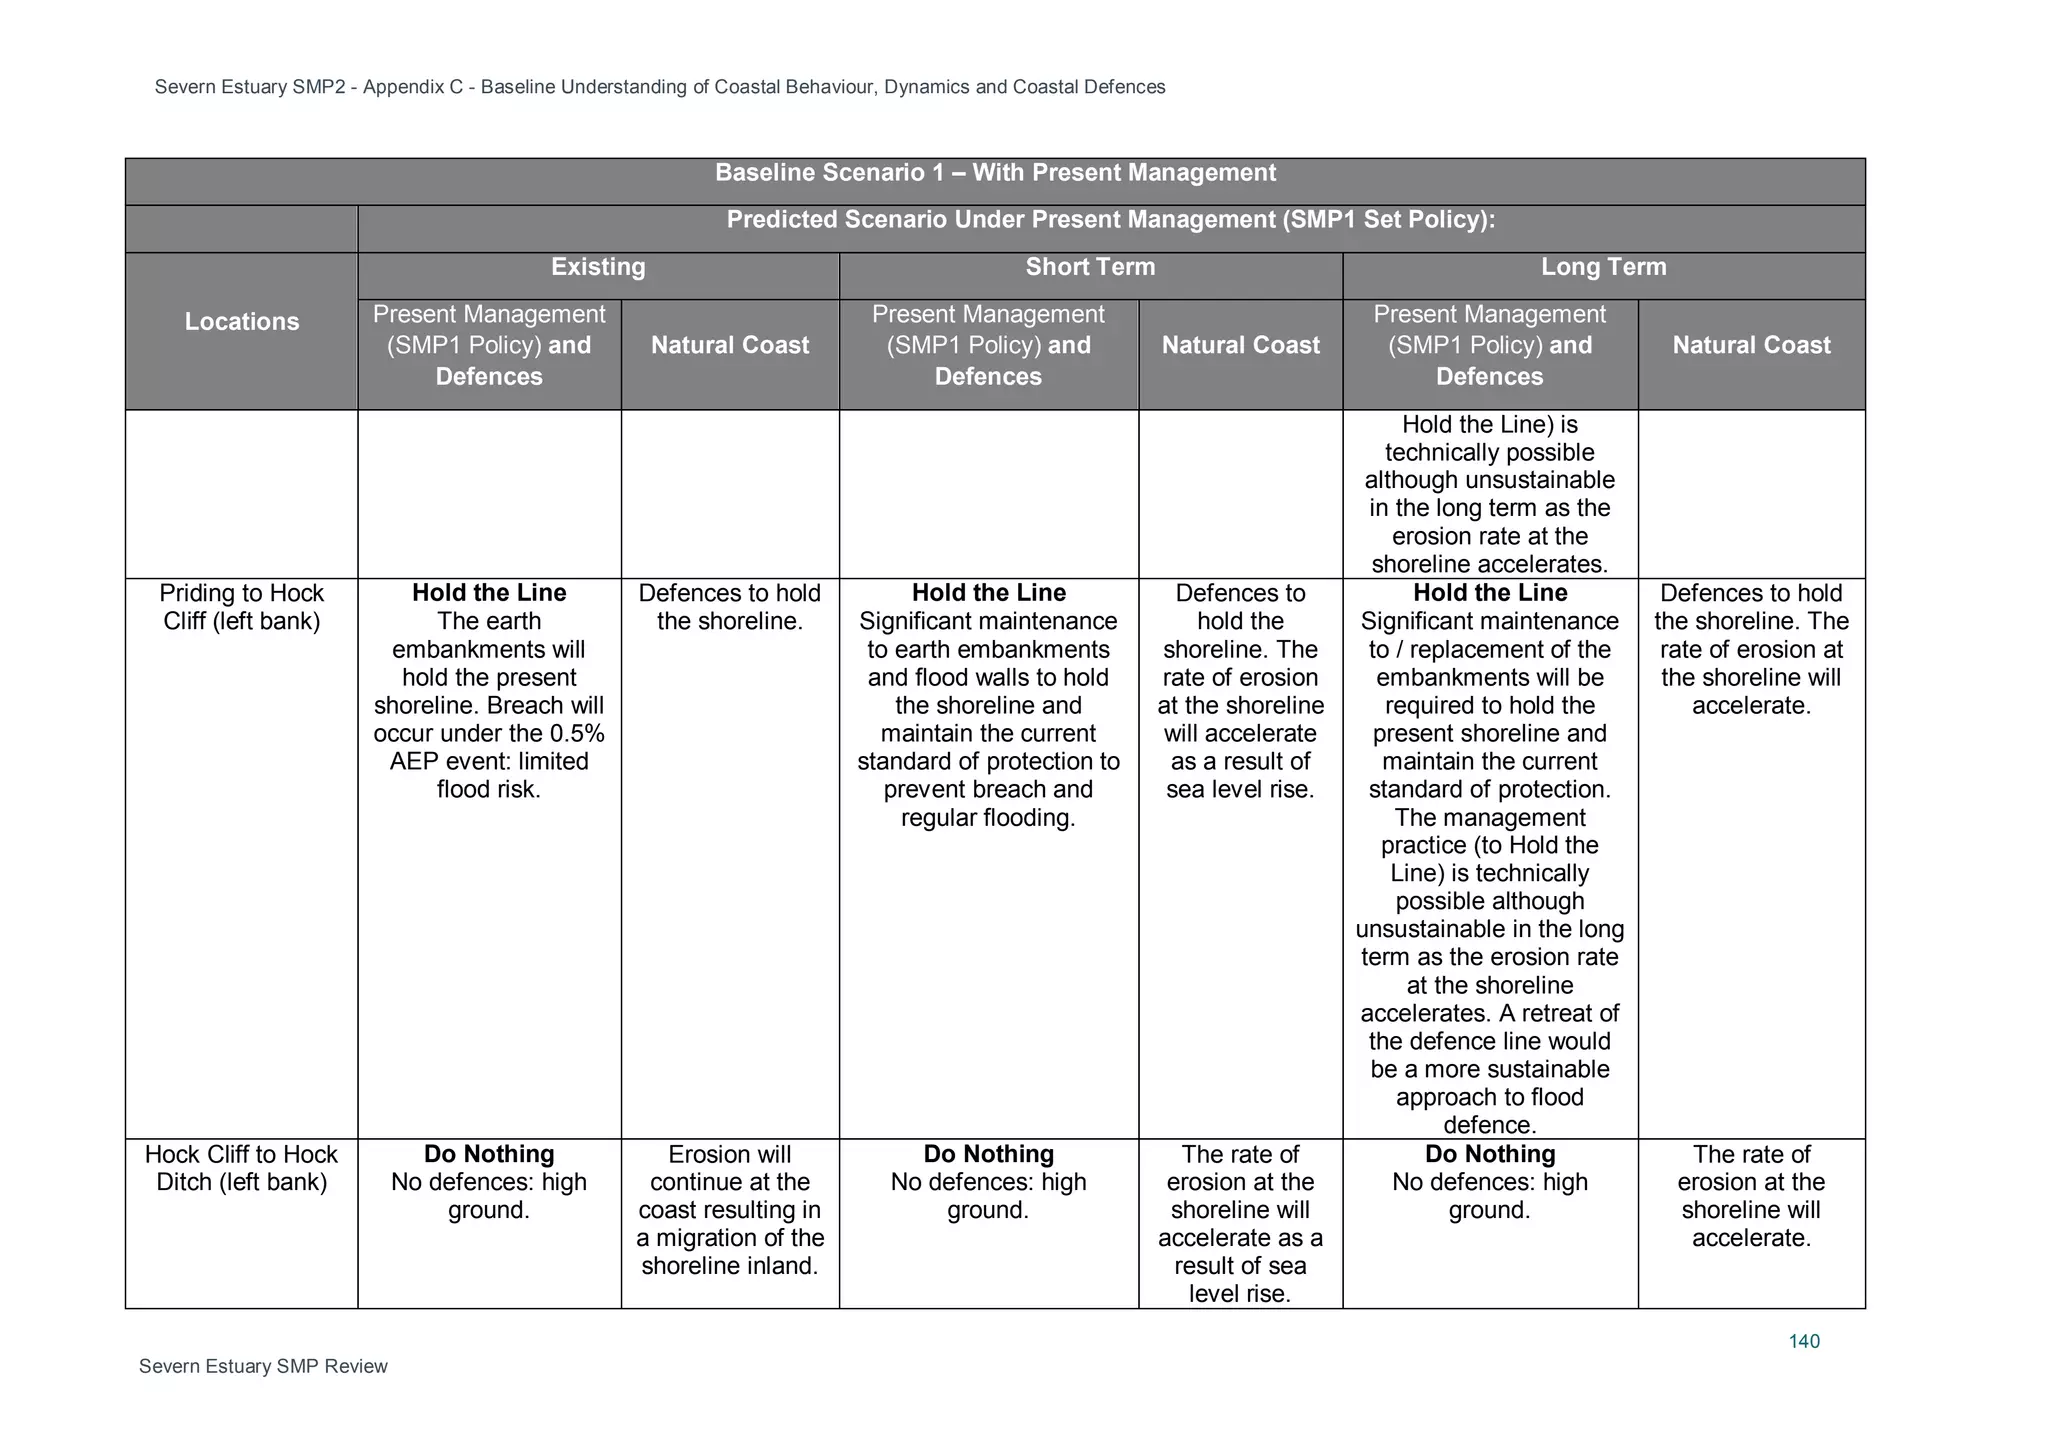
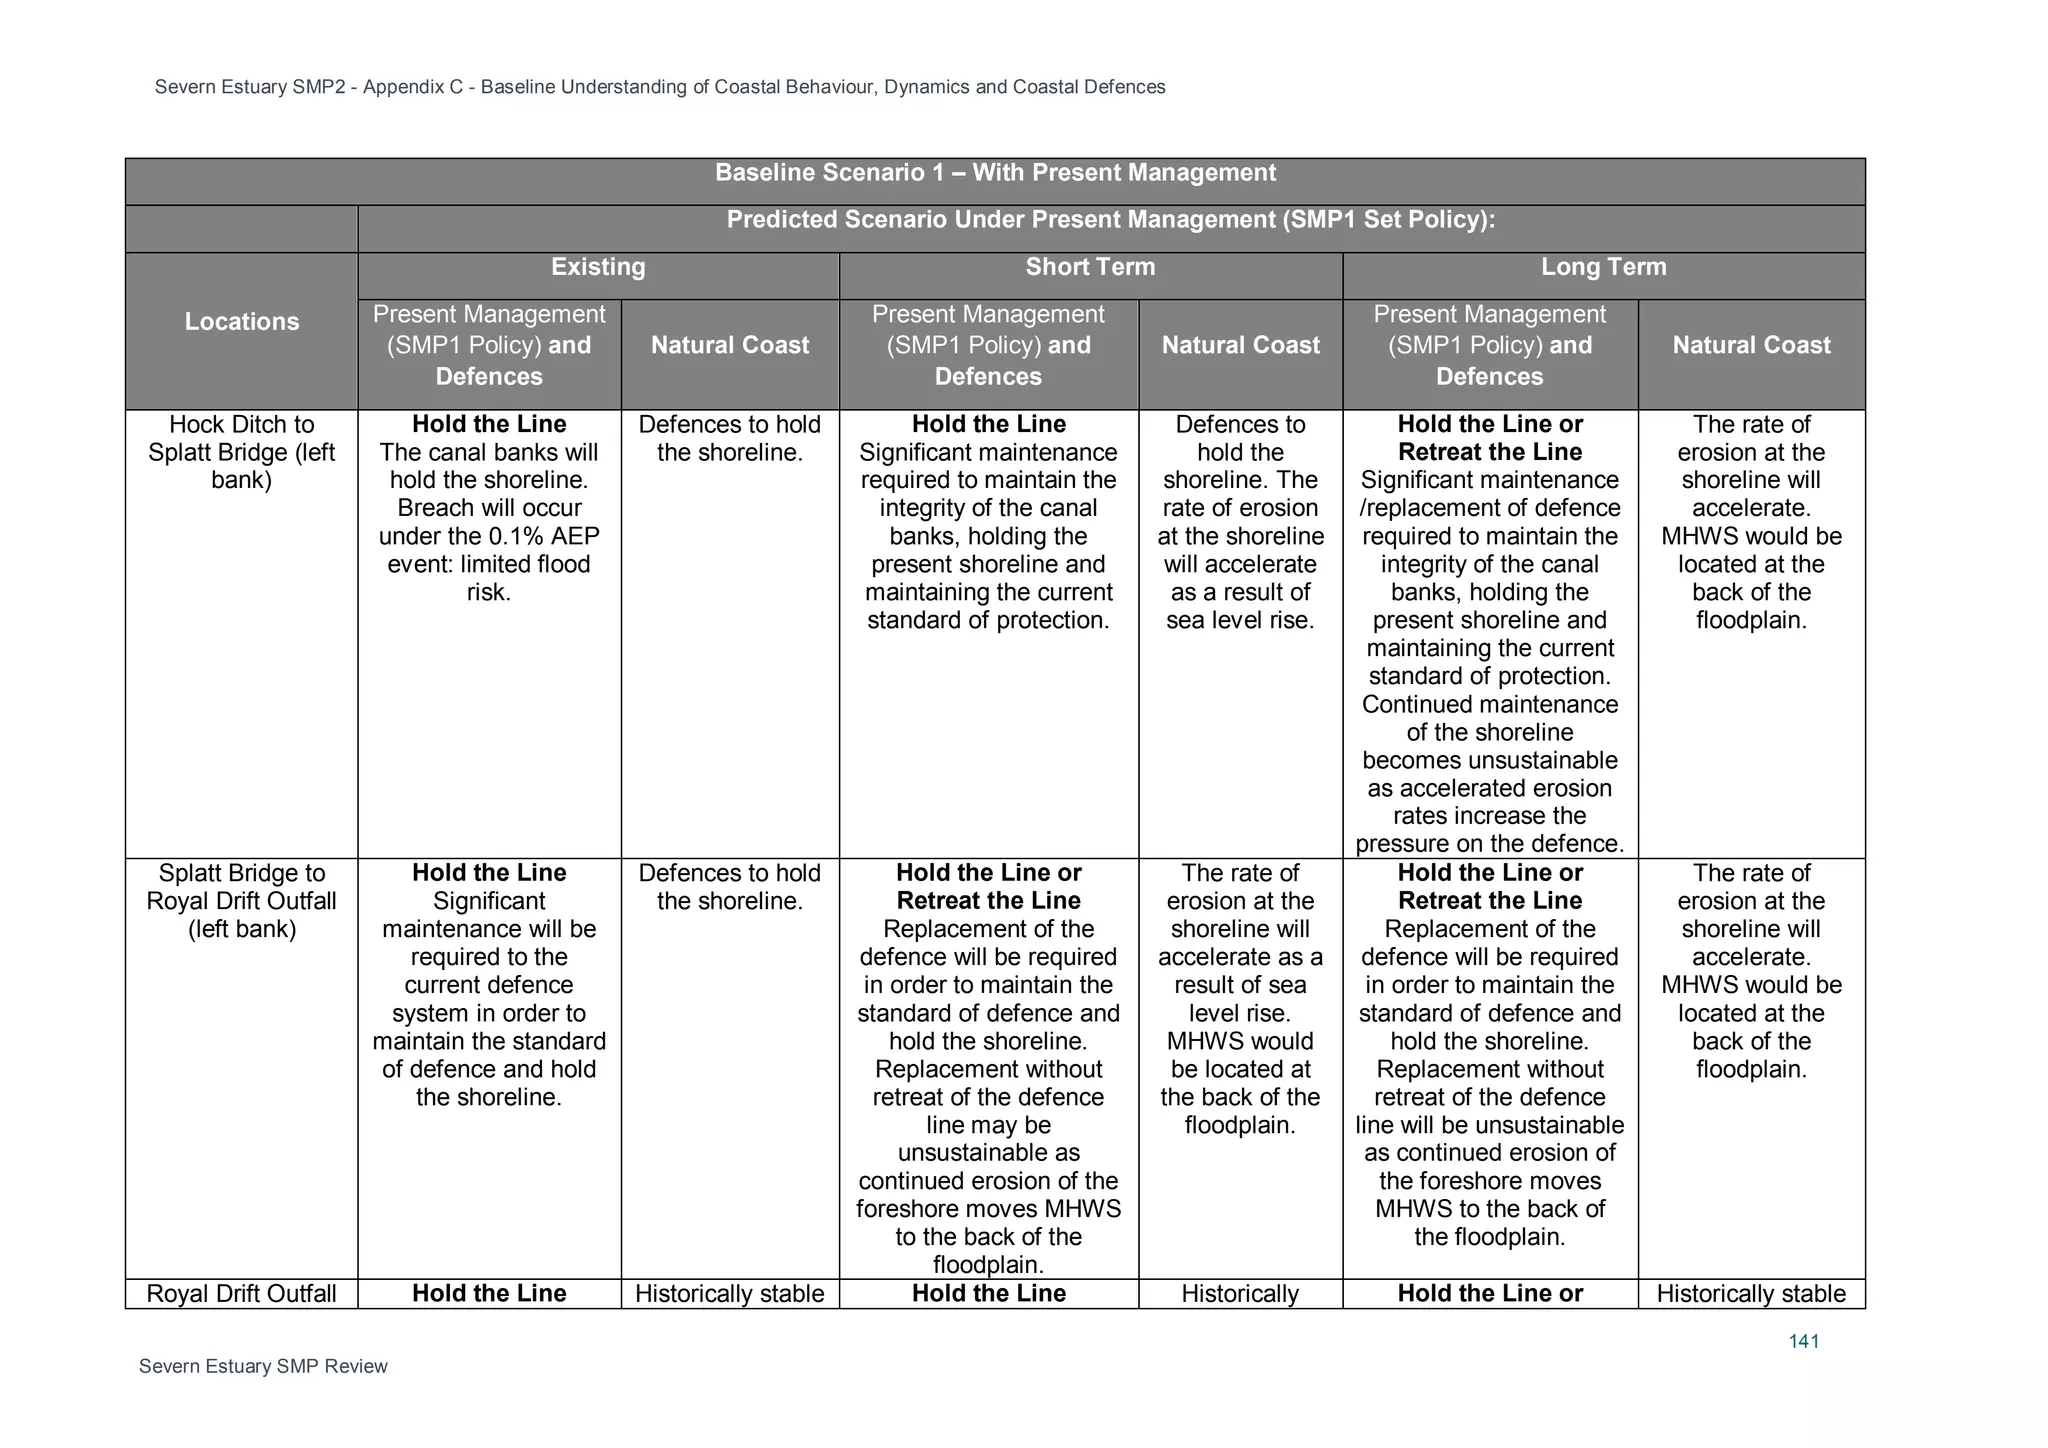
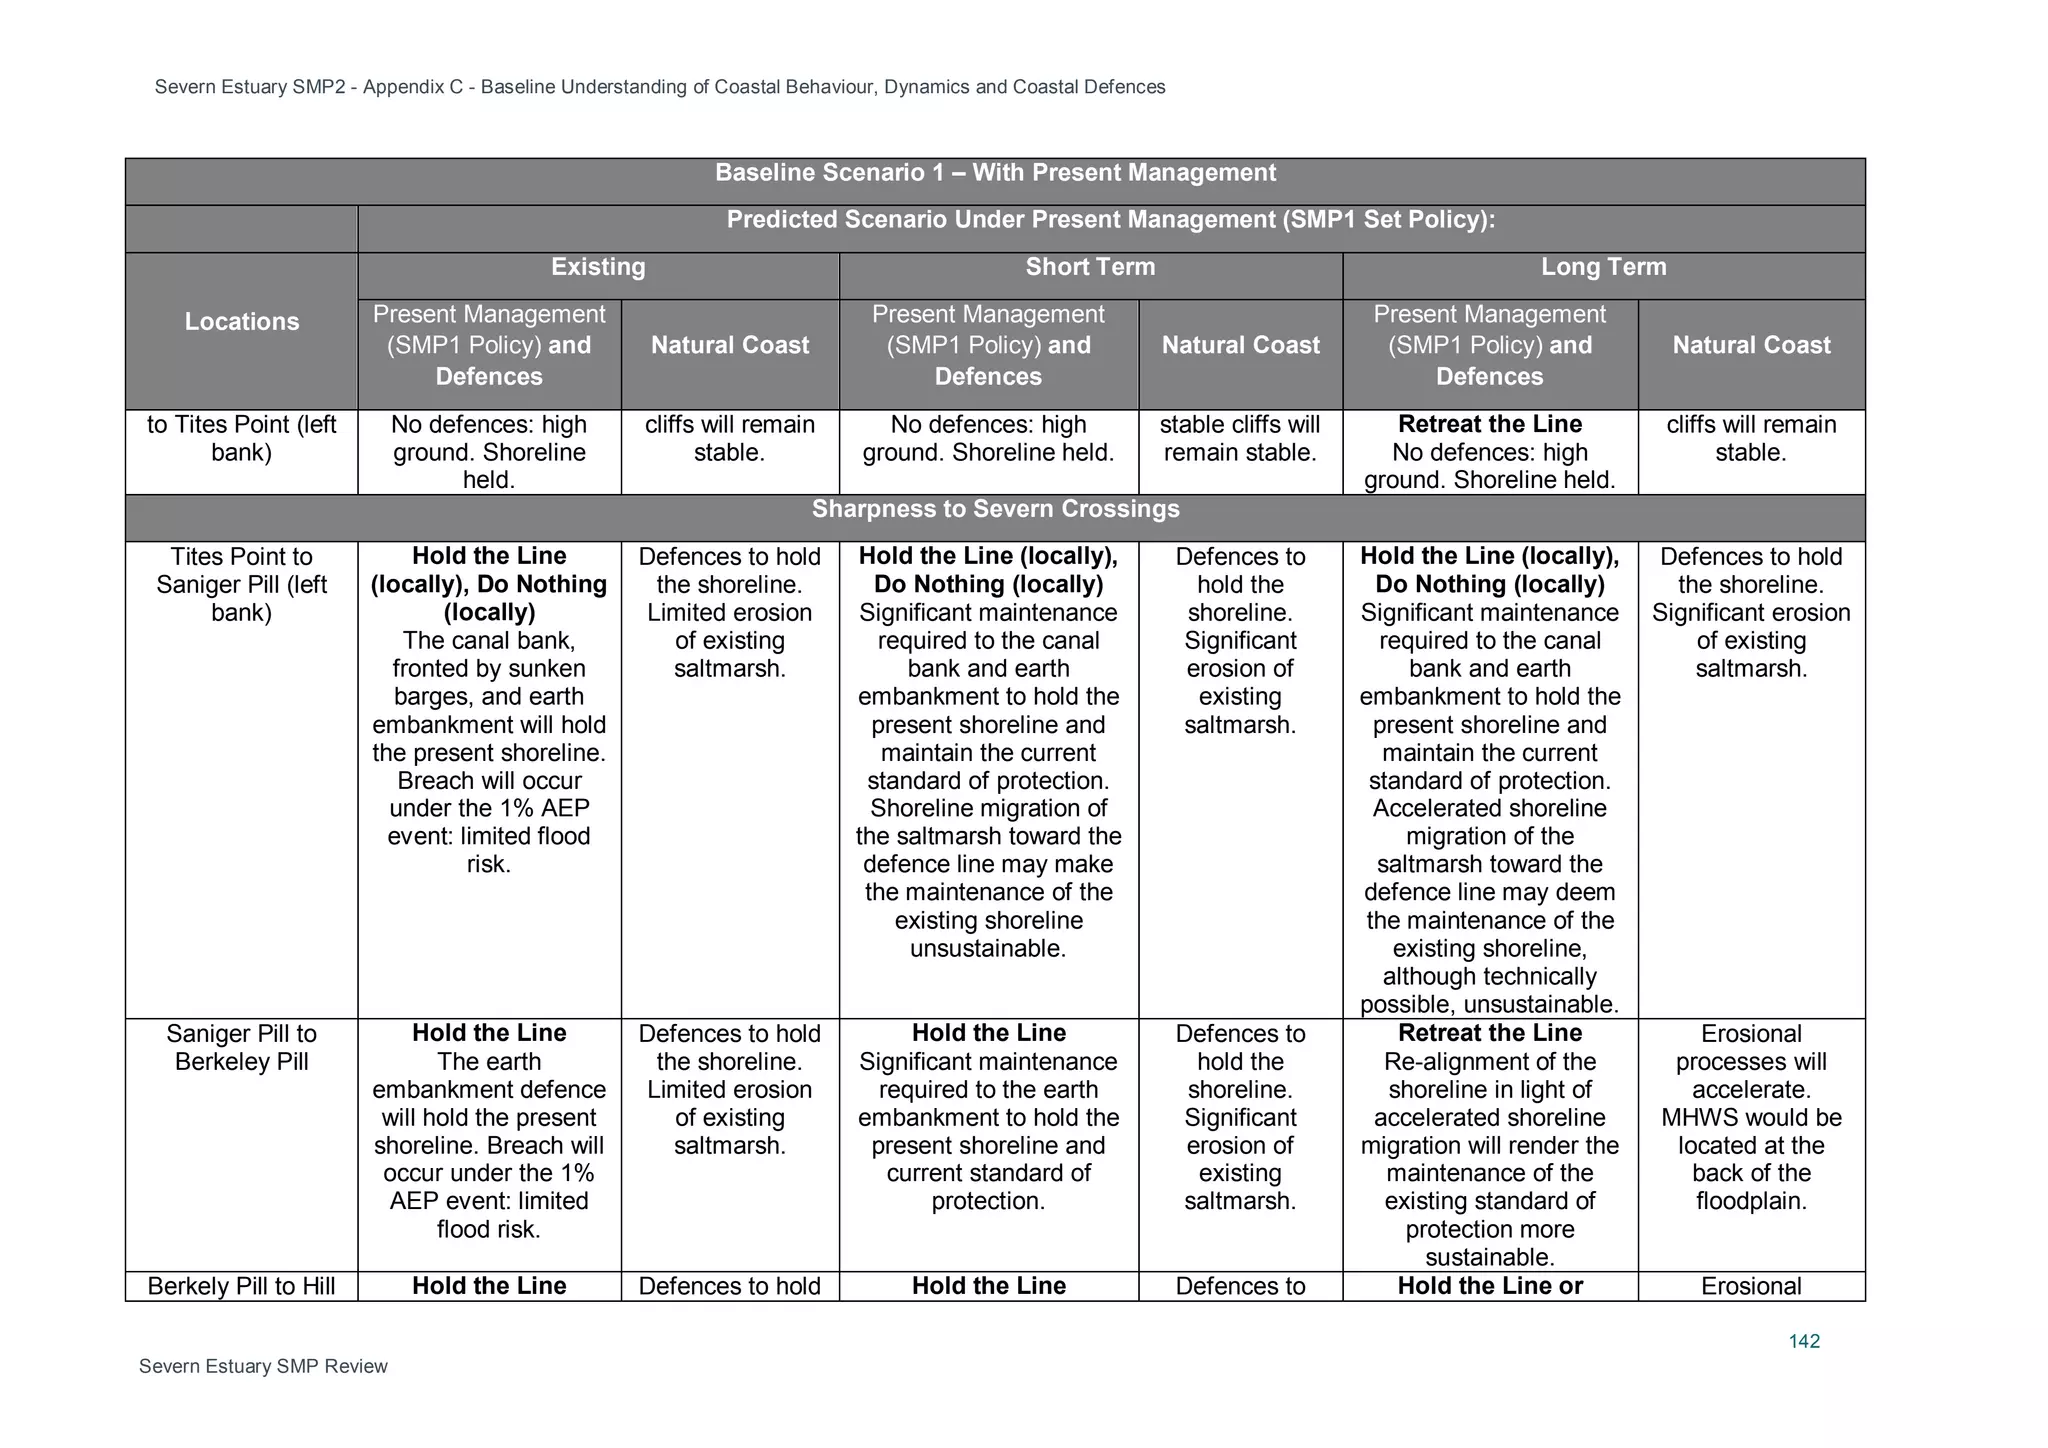
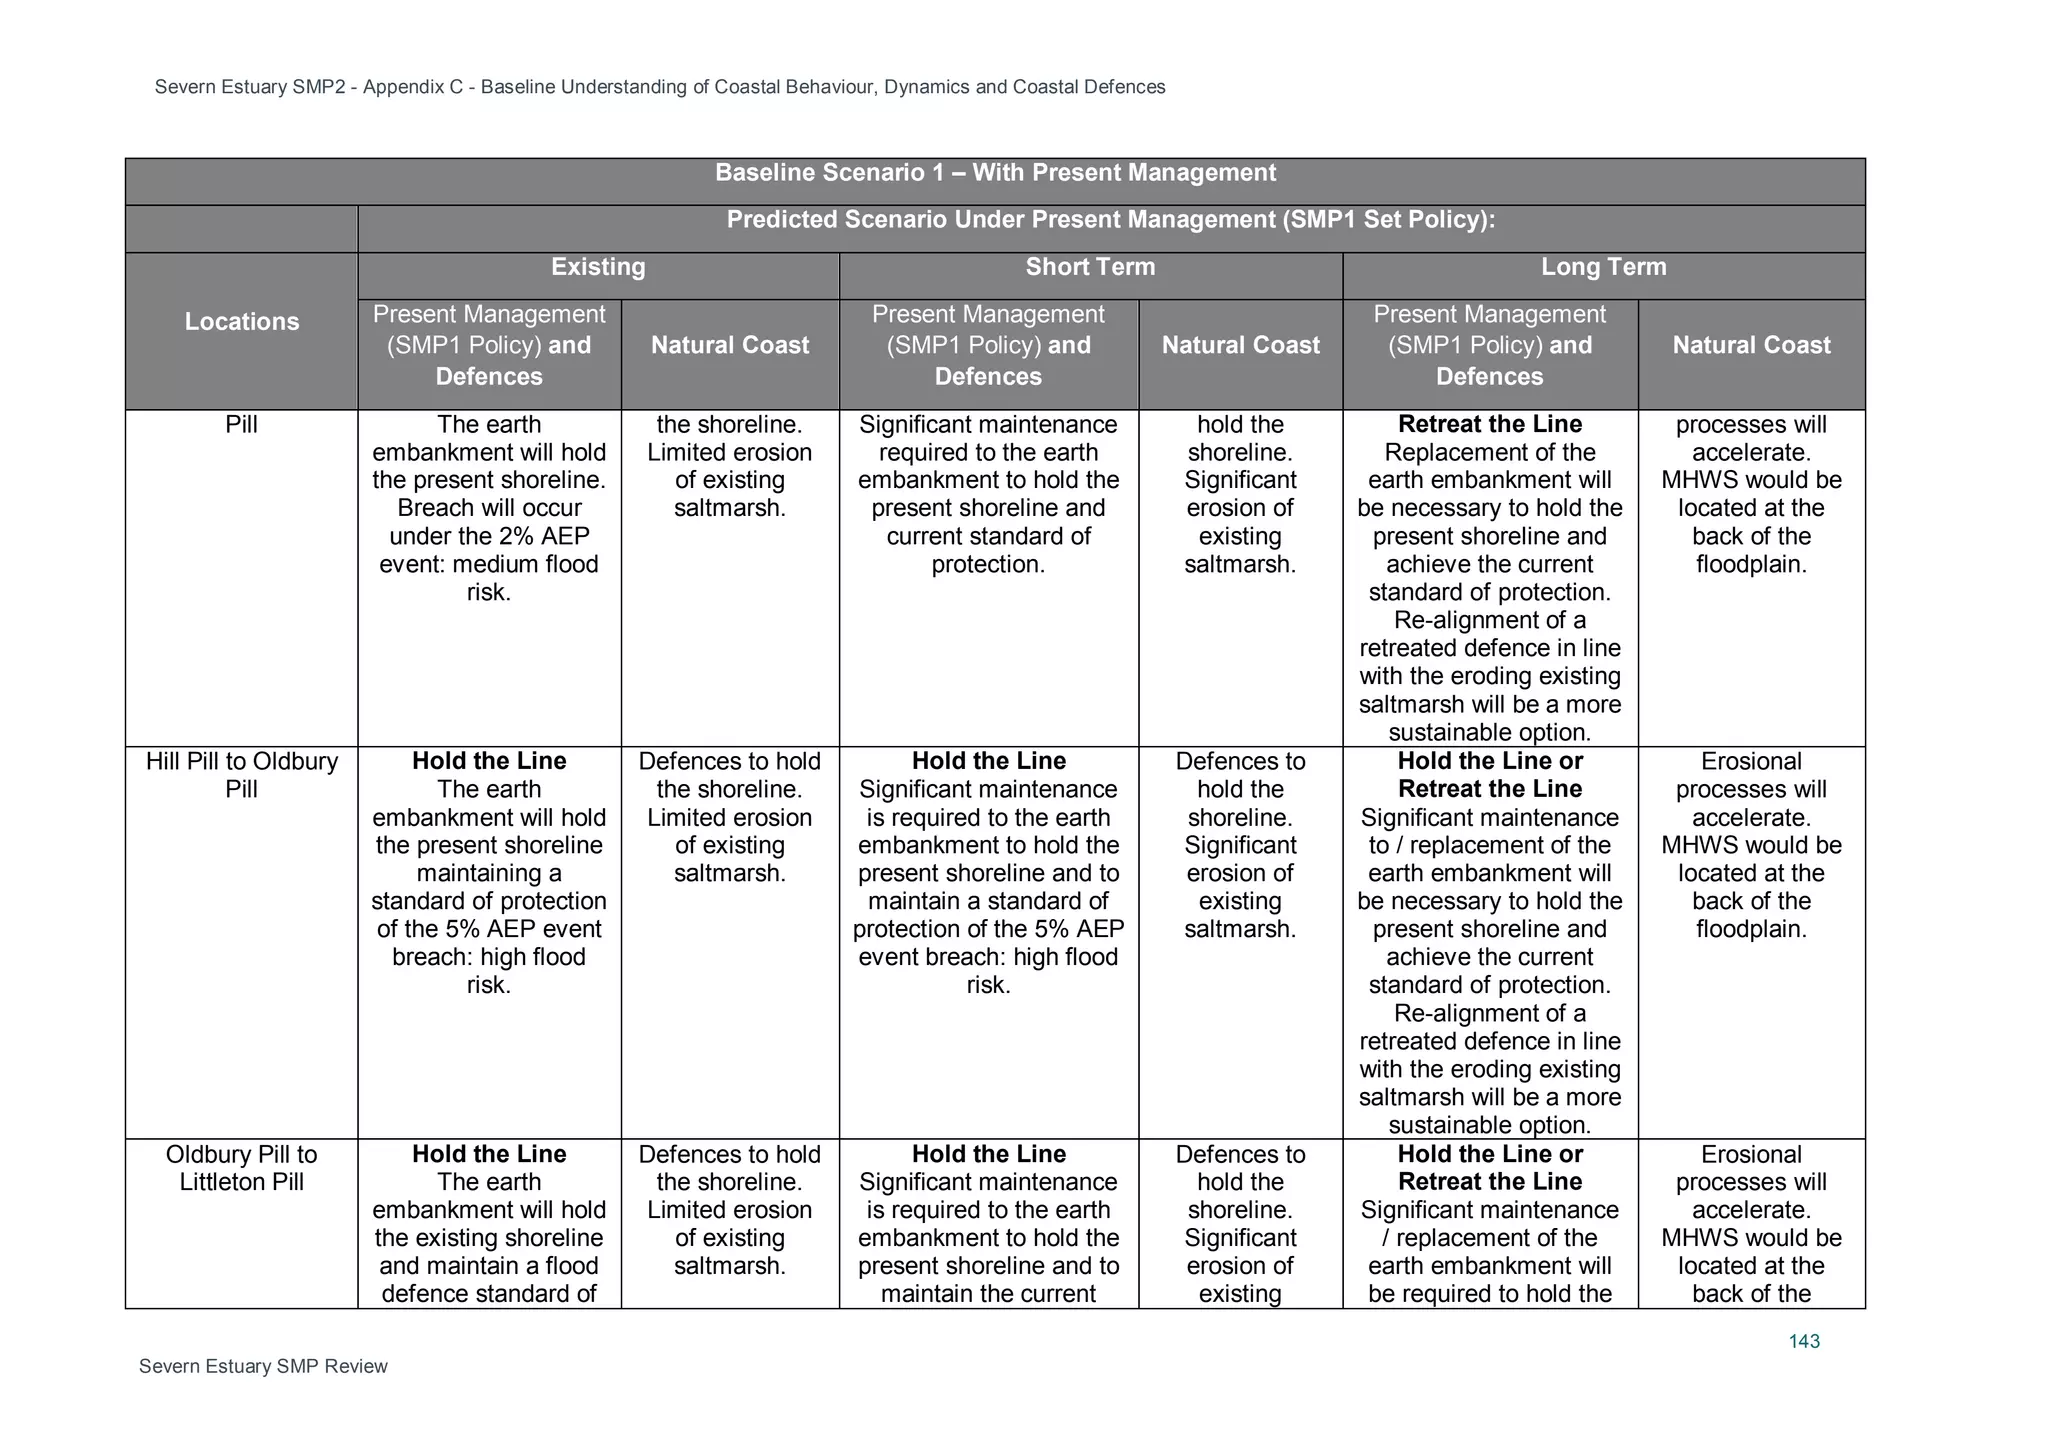
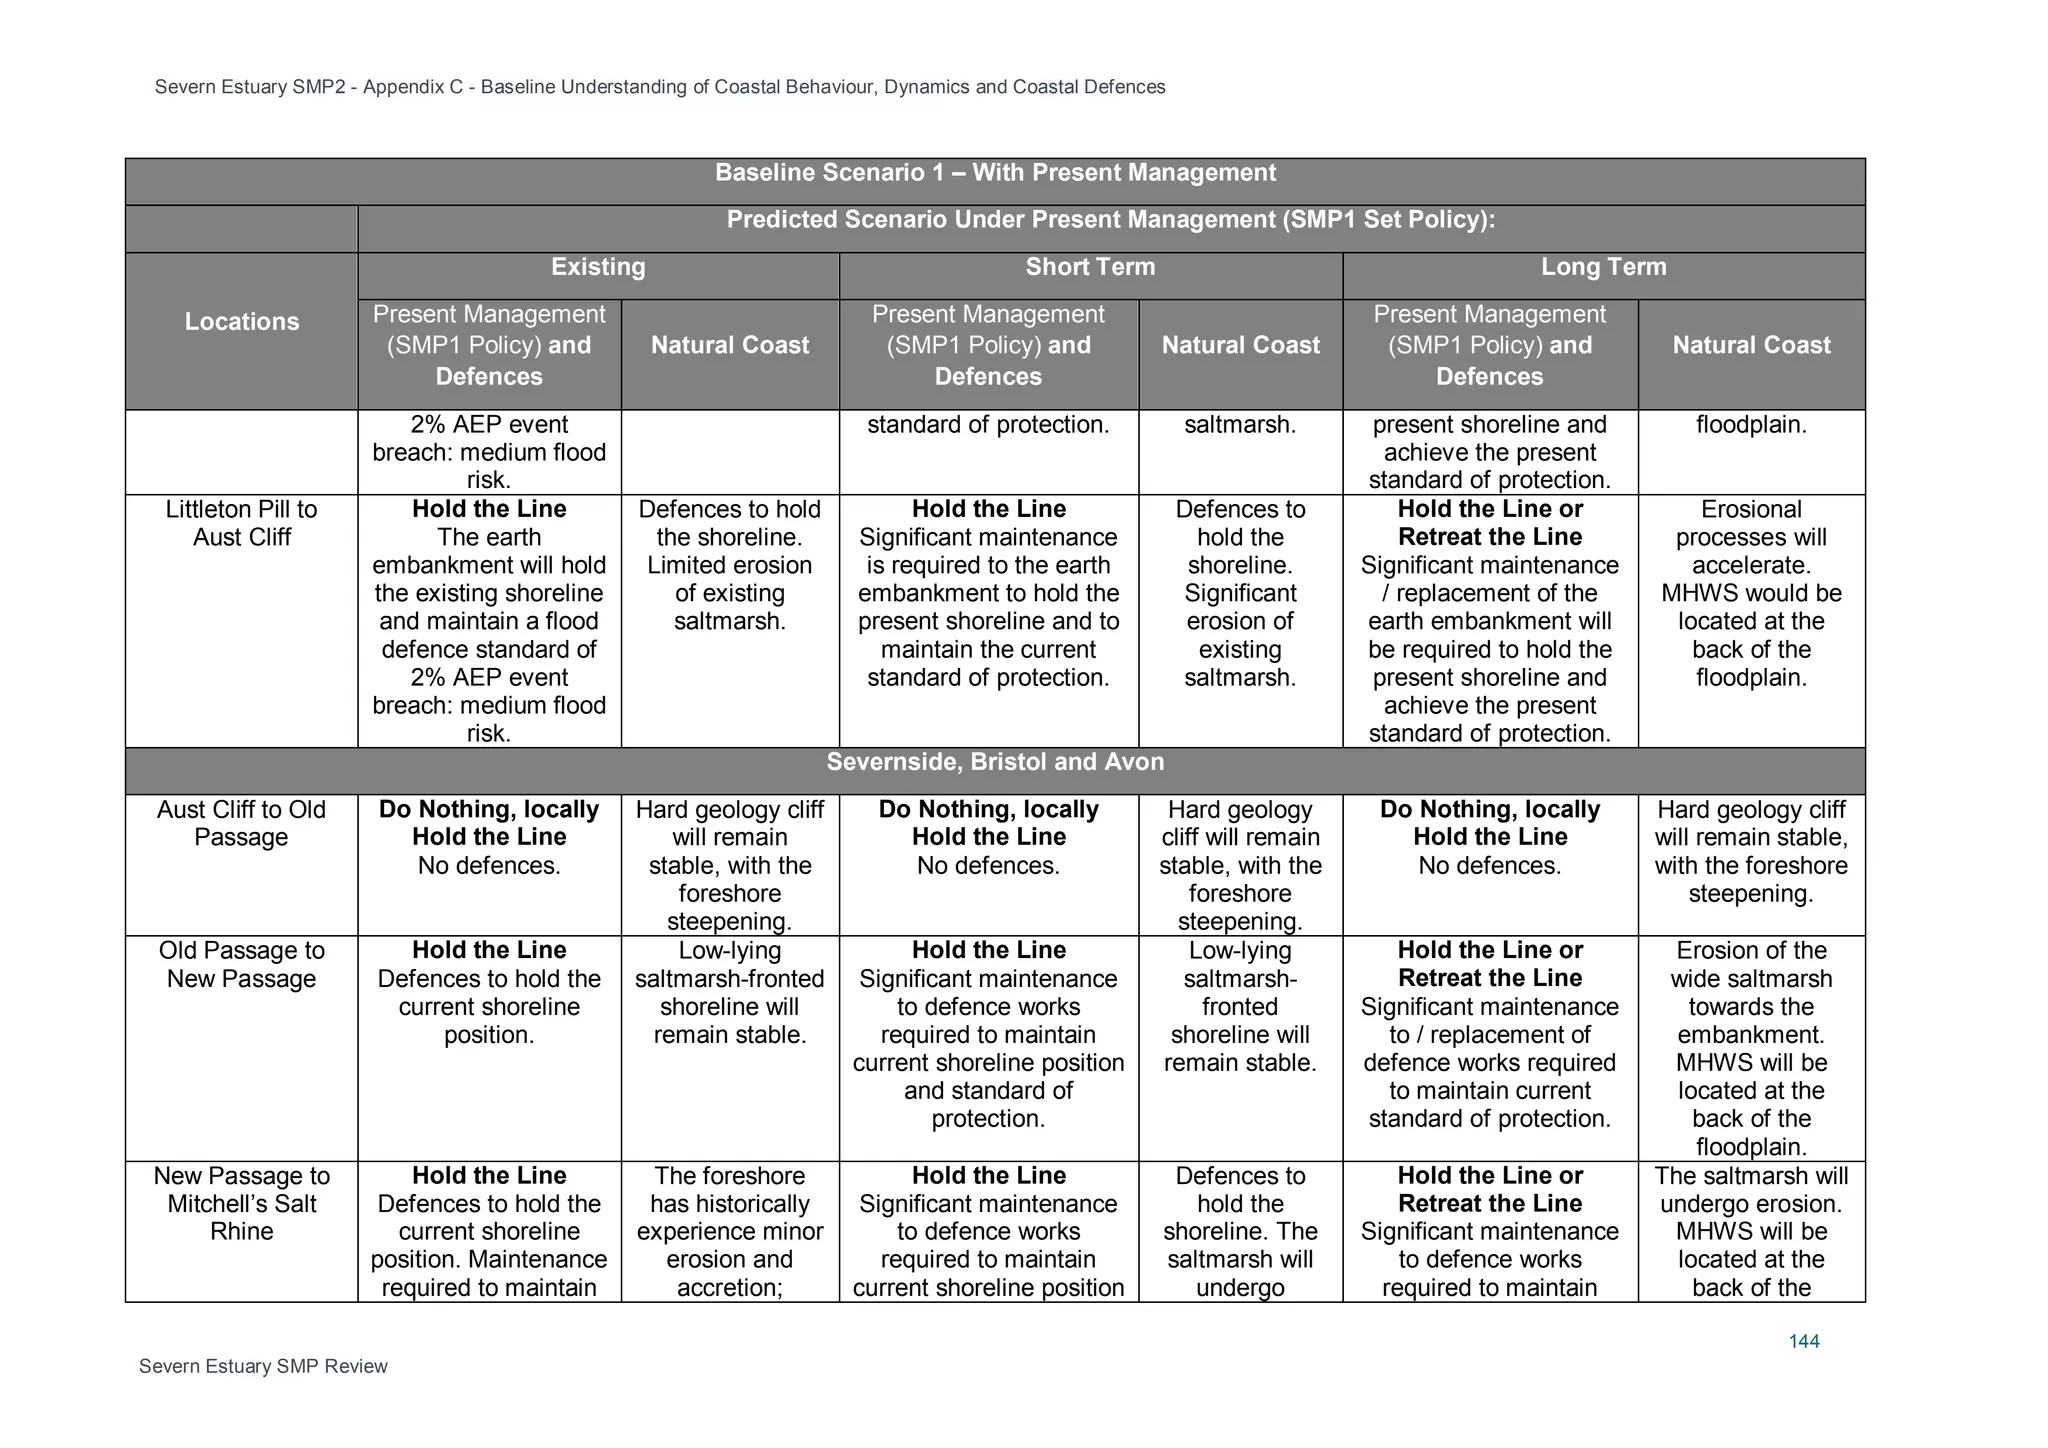
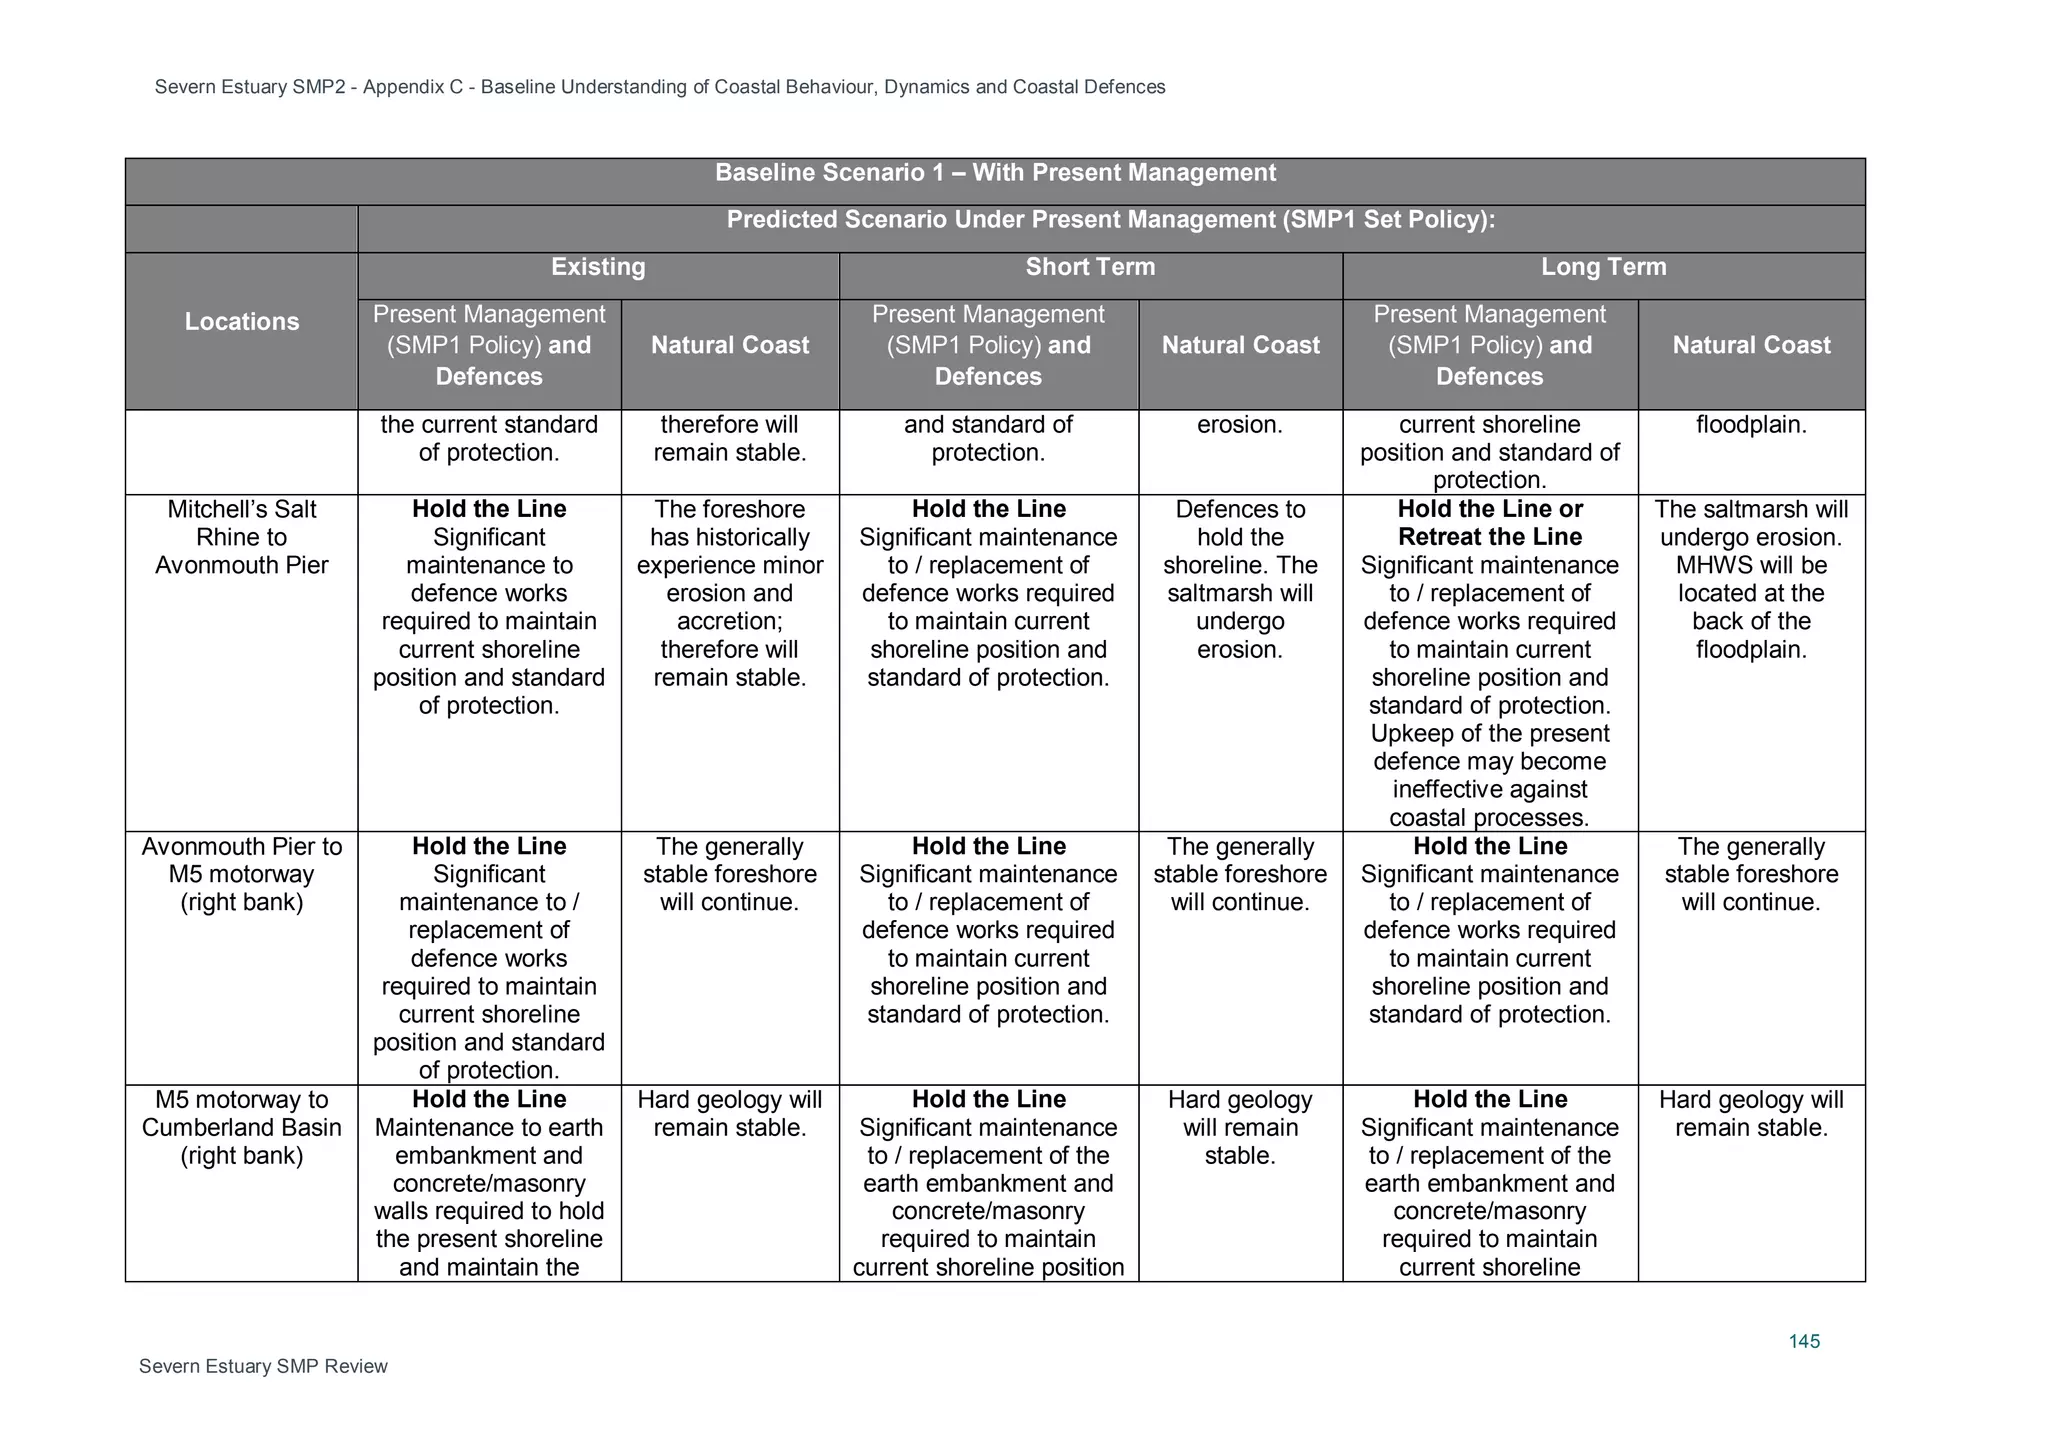
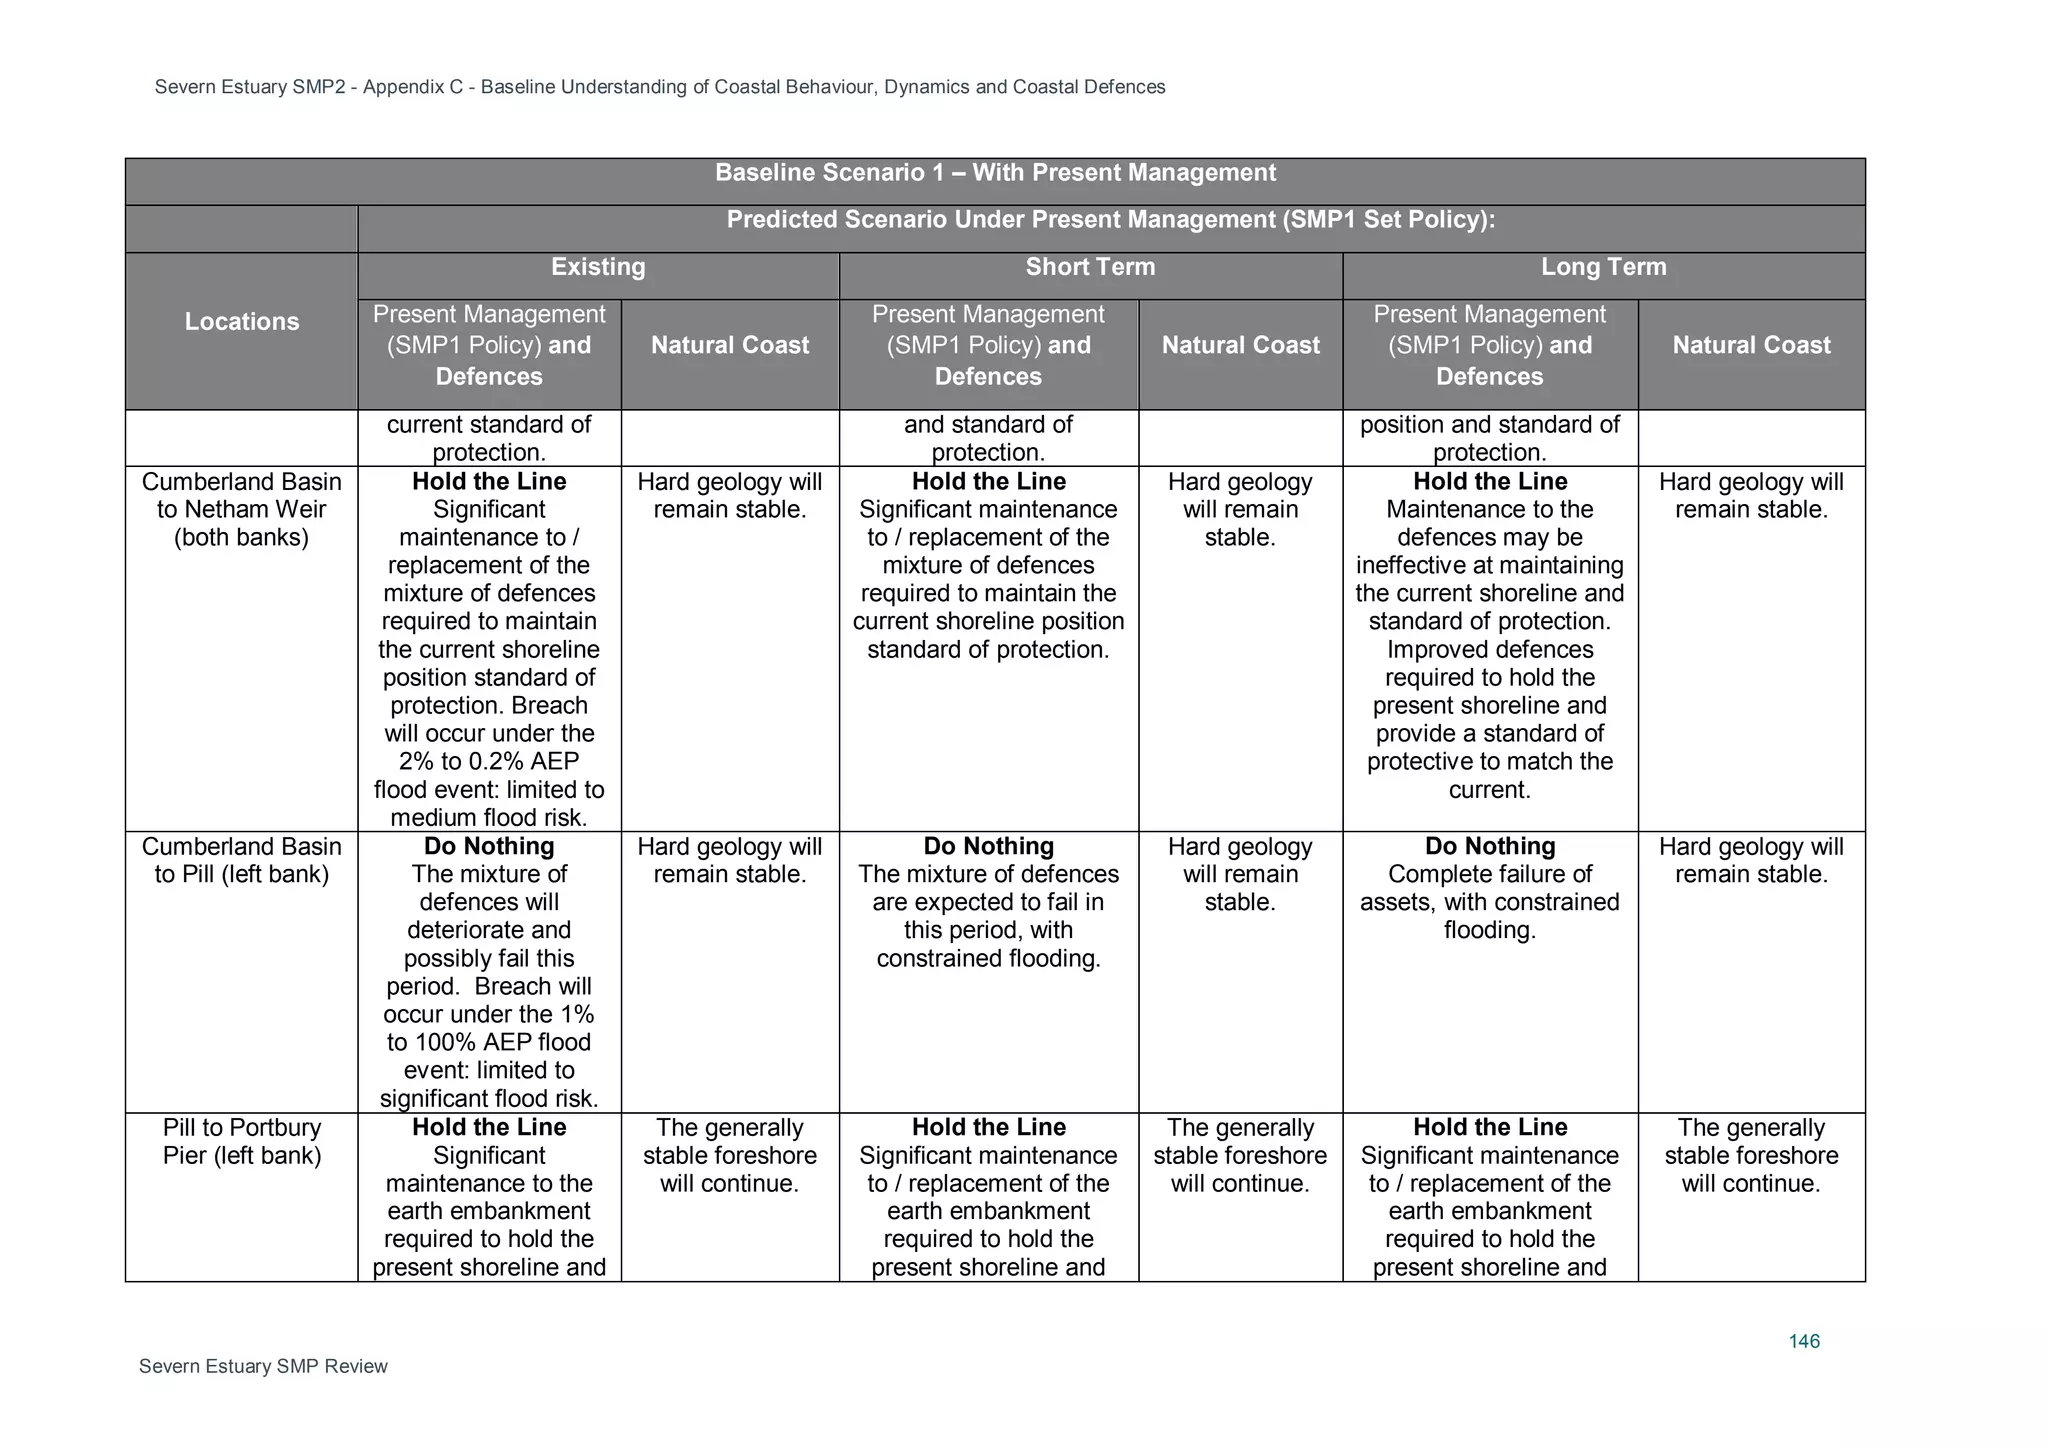
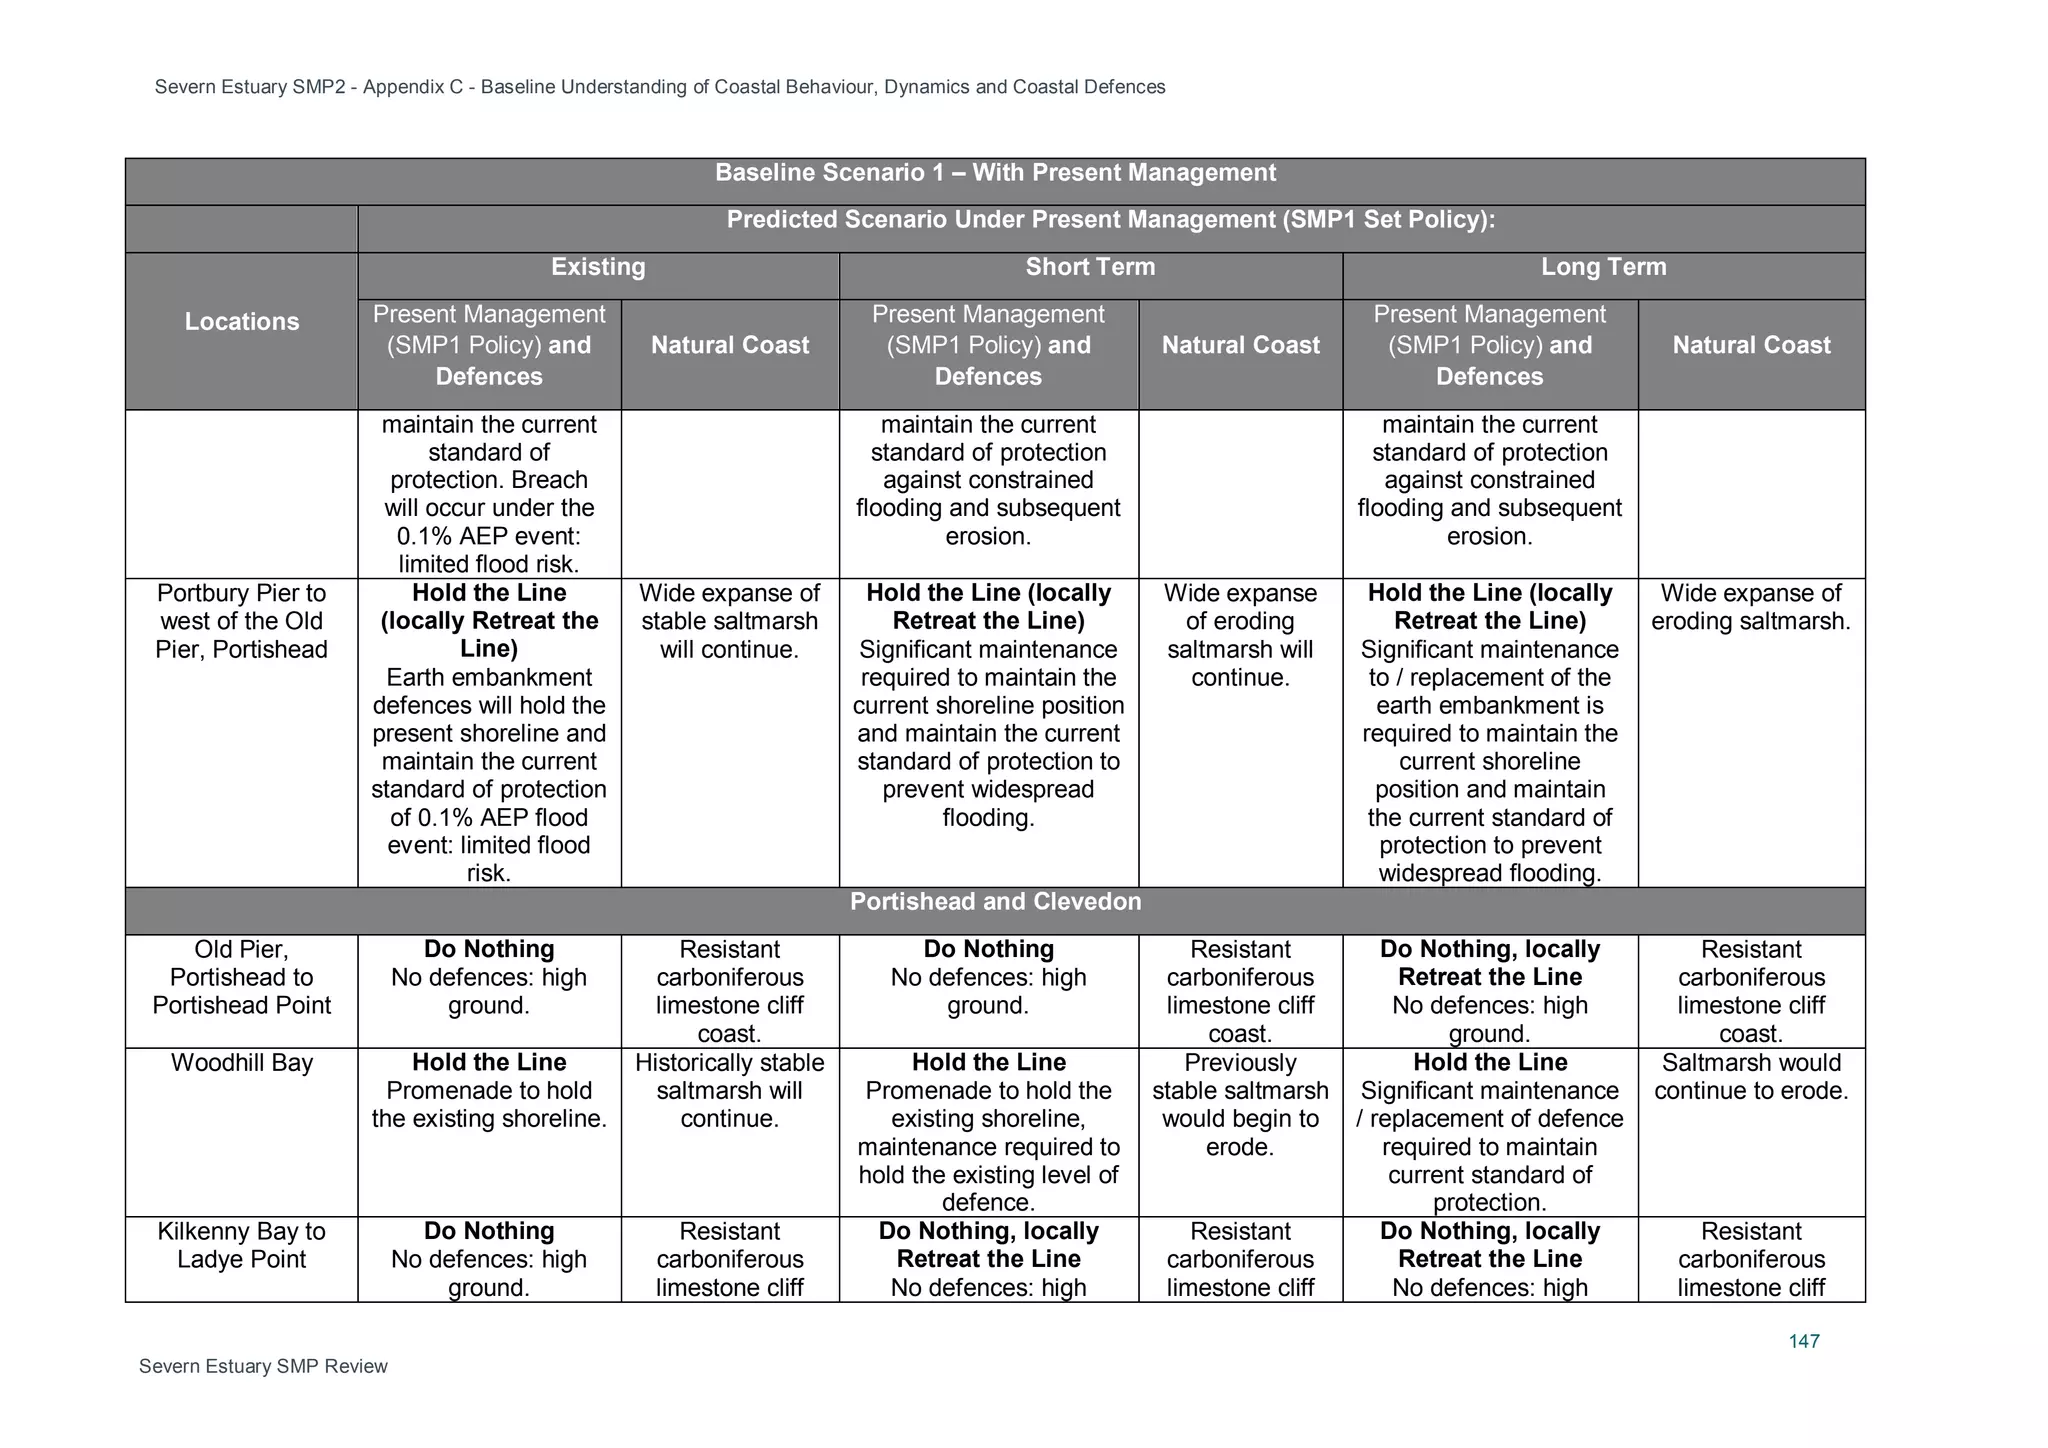
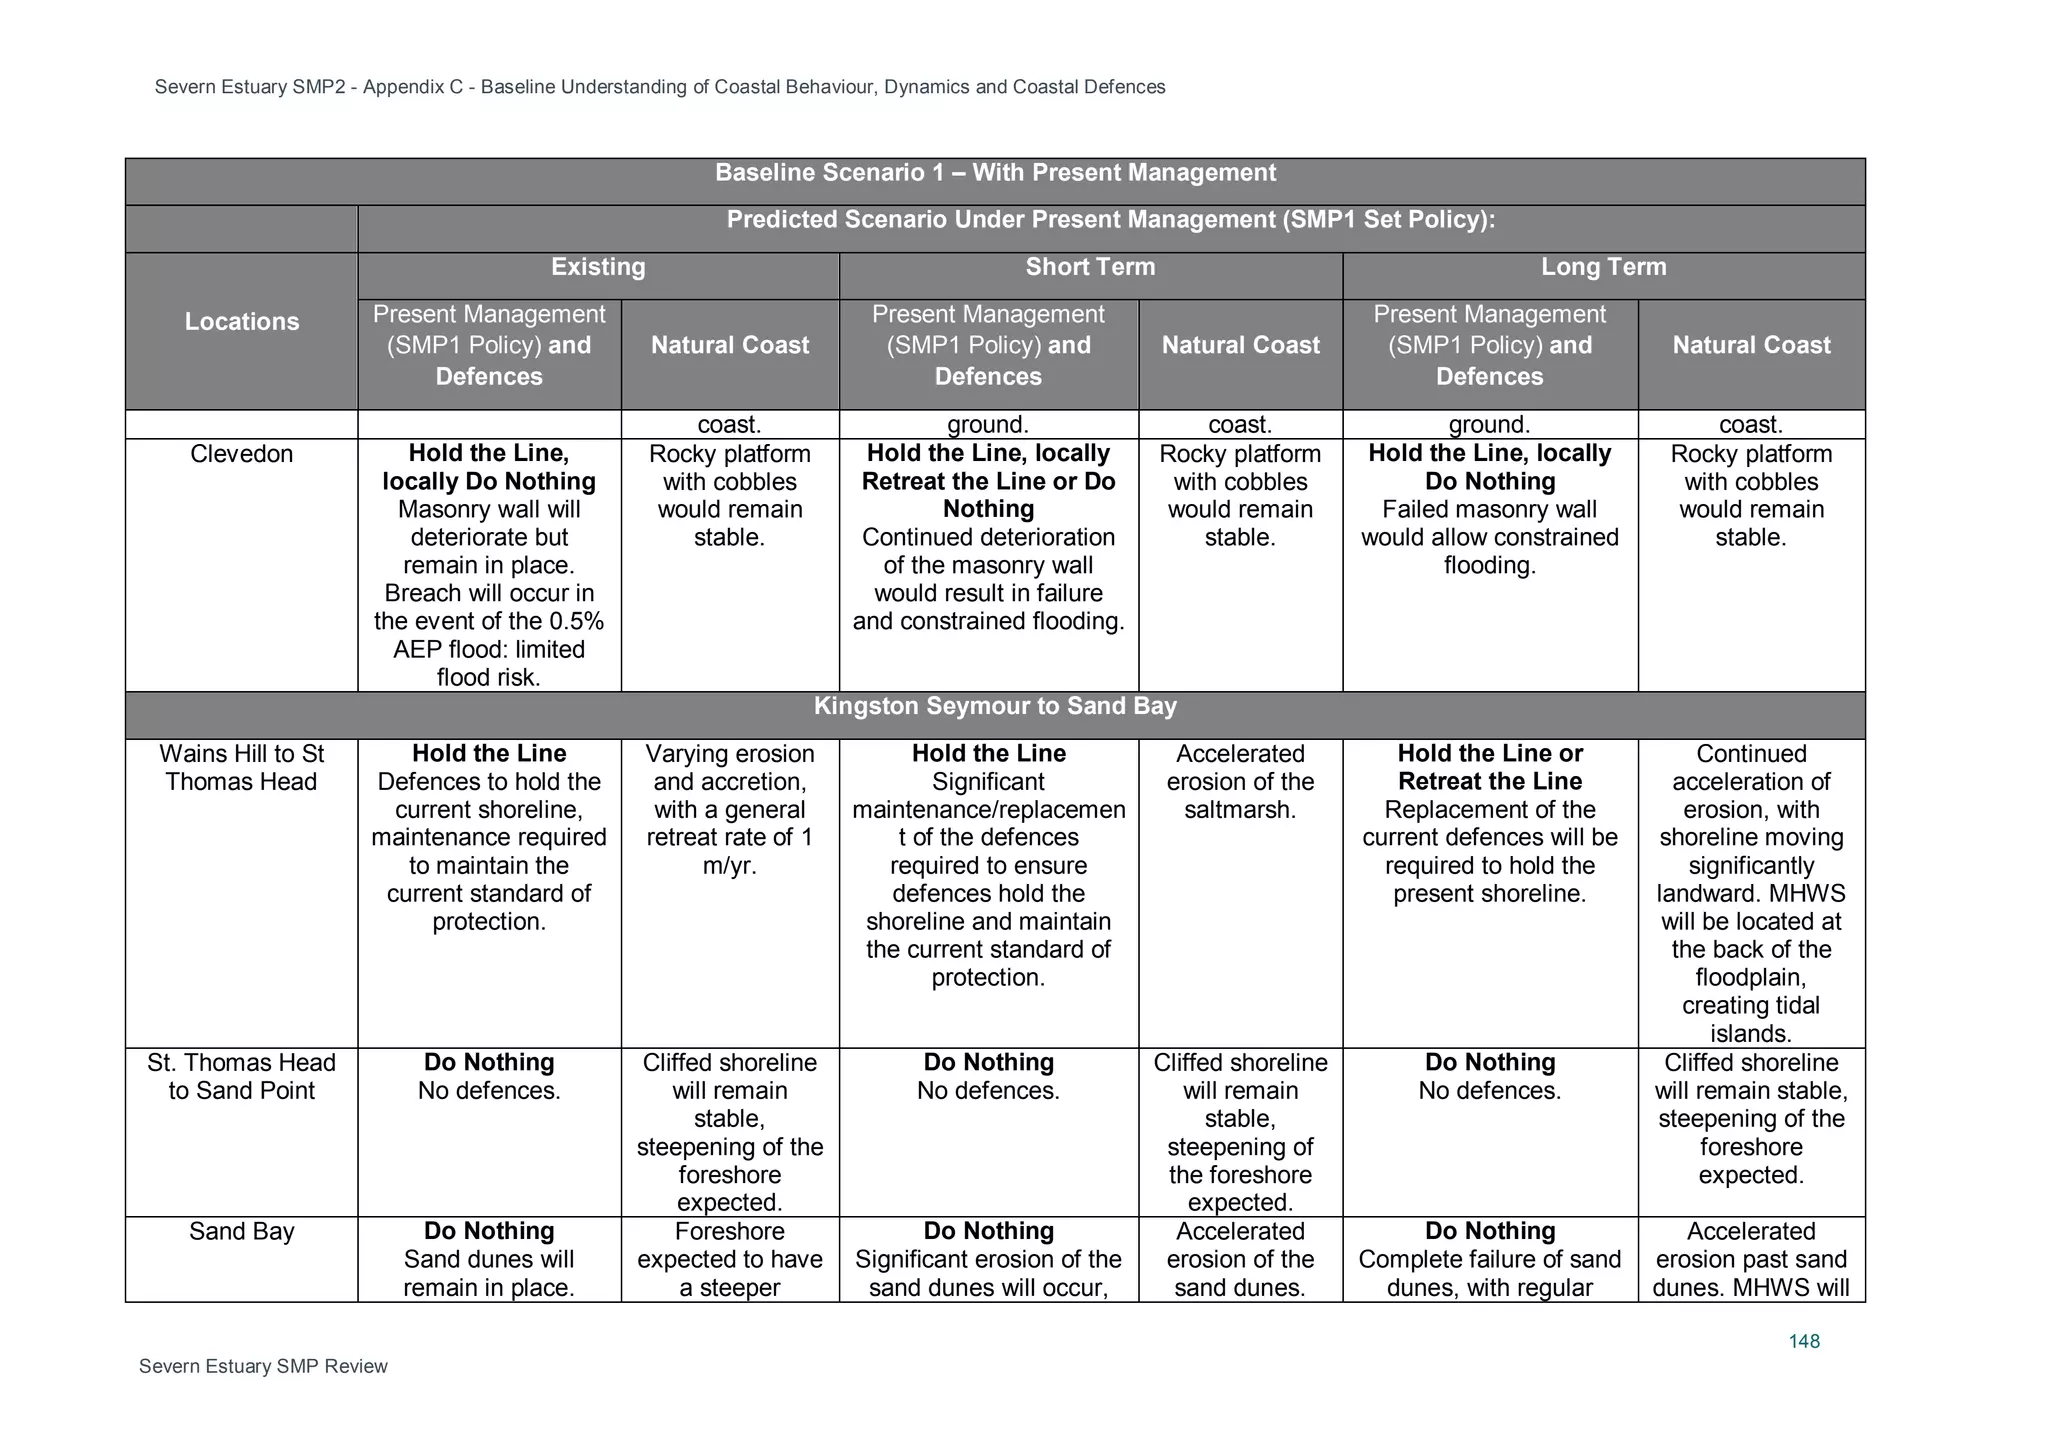
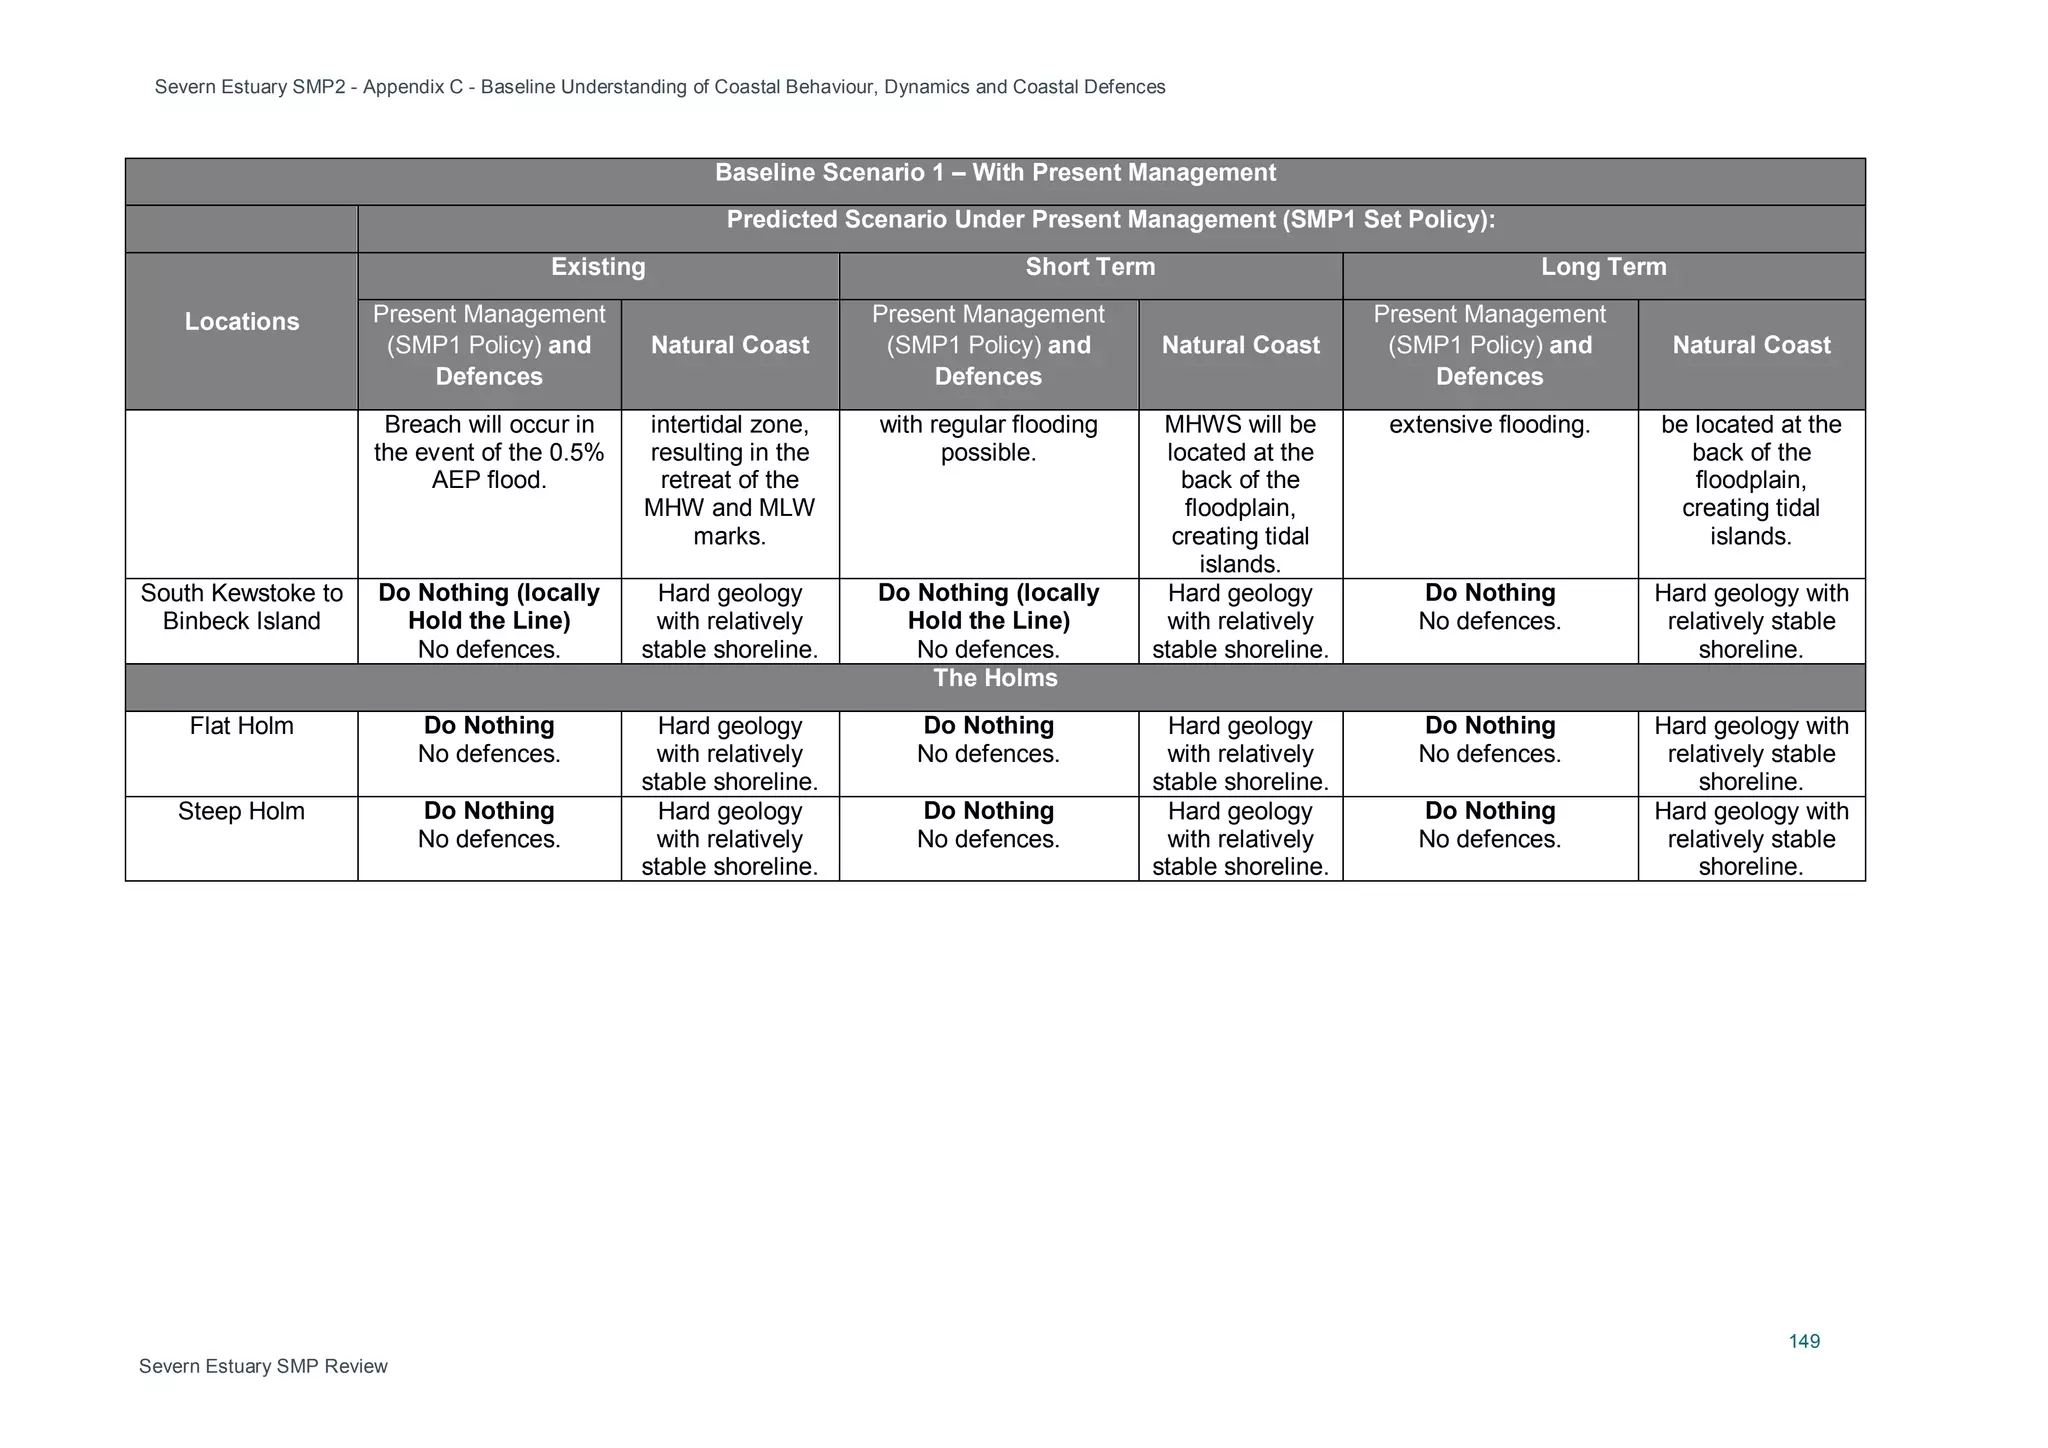
Part C develops baseline scenarios of shoreline change under conditions of No Active Intervention (NAI) and With Present Management (WPM), taking into account climate change and potential defence failure over different time periods. It aims to improve understanding of coastal risks to inform SMP


![Severn Estuary SMP2 - Appendix C - Baseline Understanding of Coastal Behaviour, Dynamics and Coastal Defences
Severn Estuary SMP Review xii
Compliance to the SMP2 Quality
Review Group (QRG) Terms of
Reference
This Appendix of the SMP 2 seeks to meet the following requirements set out by the
Terms of Reference (ToR) of the Quality Review Group:
• Futurecoast has been used as the basis of the coastal process
assessment, updated as appropriate with coastal monitoring data and
any recent Coastal Management Strategies. The coastal processes
in the area are sufficiently understood and uncertainty documented
[including climate change – see Part A of this Report
• National Flood and Coastal Defence Database (NFCDD) and/or up-to-
date monitoring data has been used to assess the existing defence
assets. Residual life is adequately addressed, high risk assets clearly
identified and used in the NAI appraisal.
].
• Baseline scenarios of No Active Intervention (NAI) and With Present
Management practices have been appraised and predicted shoreline
change mapped. Appraisals include consideration of climate change
and discuss shoreline response (both in terms of how the shoreline
will look and where it will be) for the three epochs. Any interactions
and independencies along the coast have been considered.
Assumptions made regarding defences are clear for each location
under each epoch, e.g. timing of defence failure -
See Part B of this Report.
• Where any mathematical models have been used, their purpose,
assumptions made, and outputs are clearly reported.
see Part C of this
Report.
• Key uncertainties, e.g. due to gaps in data, knowledge or modelling,
are clearly set out in the plan and where appropriate sensitivity
analysis has been undertaken to appraise the impact of uncertainties
on policy decisions
(no additional
models used in this study)
. (see SMP2 Action Plan)](https://image.slidesharecdn.com/appendixcbaselineunderstandingfinaldec2010-160323162427/75/Appendix-c-baseline-understanding-final_dec2010-12-2048.jpg)