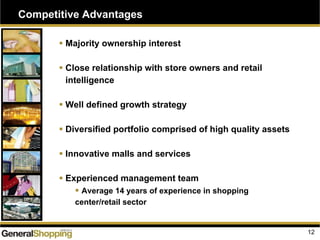
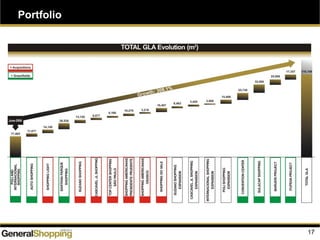
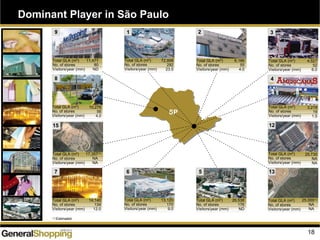
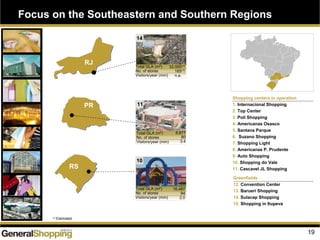
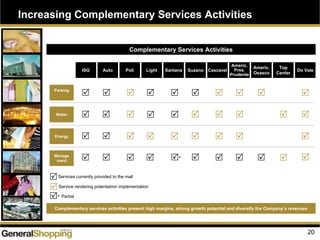
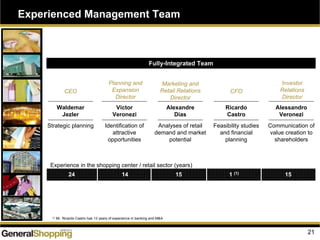
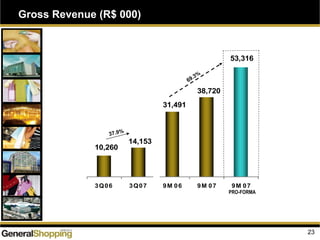
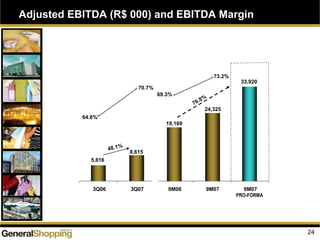
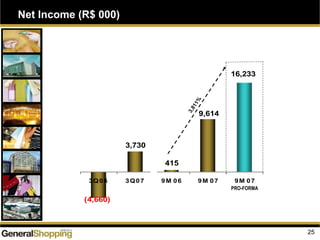
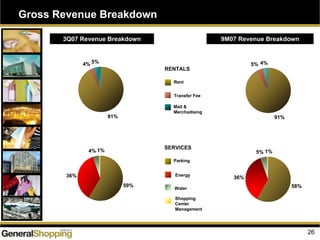
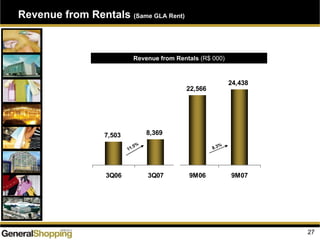
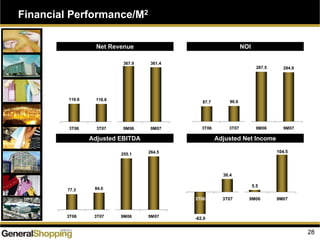
General Shopping Brasil
Analyst and Investor Meeting
December 17, 2007
Disclaimer
1
This presentation contains statements that are forward-looking within the meaning of Section 27A of
the Securities Act of 1933 and Section 21E of the Securities Exchange Act of 1934. Such forward-
looking statements are only predictions and are not guarantees of future performance. Investors are
cautioned that any such forward-looking statements are and will be, as the case may be, subject to
many risks, uncertainties and factors relating to the operations and business environments of
General Shopping and its subsidiaries that may cause the actual results of the companies to be
materially different from any future results expressed or implied in such forward-looking statements.
This material is published solely for informational purposes and is not to be construed as a
solicitation or an offer to buy or sell any securities or related financial instruments and should not be
treated as giving investment advice. It is not targeted to the specific investment objectives, financial
situation or particular needs of any recipient. No representation or warranty, either express or
implied, is provided in relation to the accuracy, completeness or reliability of the information
contained herein. This material should not be regarded by recipients as a substitute for the exercise
of their own judgment.
Any opinions expressed in this material are expressed as of this date and subject to change without
notice and General Shopping is not under the obligation to update or keep current the information
contained herein. General Shopping and the respective affiliates, directors, partners and employees
accept no liability whatsoever for any loss or damage of any kind arising out of the use of all or any
part of this material. You should consult with your own legal, regulatory, tax, business, investment,
financial and accounting advisers to the extent that you deem it necessary, and make your own
investment, hedging and trading decision (including decisions regarding the suitability of this
transaction) based upon your own judgment and advice from such advisers as you deem necessary
and not upon any views expressed in this material.
Agenda
Highlights
Sector Overview
Company Overview
Financial Highlights
2
Highlights
Growth through
Greenfield (GSB expertise track record)
Acquisitions (GSB market intelligence and
complementary services adding)
Gross revenues up 37.9% to R$ 14.2 million in 3Q07
Pro forma (as now) up 69.3% in 9M07
Adjusted EBITDA up 48.1% to R$ 8.6 million in 3Q07
Pro forma (as now) up 76.8% in 9M07
3
Sector Overview
5
Positive Sector Outlook
281 294 303
317 326 335 346
2000 2001 2002 2003 2004 2005 2006
7.5
6.46.2
5.65.55.25.1
6.36.46.25.7
5.24.9
2000 2001 2002 2003 2004 2005 2006
125
203
135
160 175
185 181
2 2 9
2 192 0 318 918 9
19 5
2000 2001 2002 2003 2004 2005 2006
23.0 25.3
27.9
31.6
36.6
40.0
44.0
2000 2001 2002 2003 2004 2005 2006
CAGR = 7.7%
Visitors per
month (million)
Revenue / average visitors per
month (R$)
Revenues (R$ in billion) Operating Shopping Centers
Visitors per Month GLA
CAGR = 11.4%
CAGR = 3.5%
CAGR = 6.6%
Source: ABRASCE
GLA
(million m2)
Revenue / average GLA
(R$ thousand / m2
)
6
Low Sector Penetration
Revenues (% of Local Retail Market (1)) Vacancy Rate (2)
20%
70%
30%-35%
Brazil Europe USA
The Brazilian Shopping Center Sector Presents Ample Room for Growth
5.7%
4.0%
4.4%
2.9%
7.4%
2.4%
1.2%
1.7%
2003 2004 2005 2006
Secto r General Sho pping B rasil
Source: ABRASCE
(1) Excludes car sales
(2) Year end
7
Favorable Macroeconomics
Brazilian Shopping Center Industry Revenue (1)
Disposable Income vs. Interest Rates (2) Retail Sales Real Growth (2)
90%
100%
110%
120%
130%
2000 2001 2002 2003 2004 2005 2006 2007
$400
$450
$500
$550
$600
$650
M ar-00 Jun-01 Aug-02 Nov-03 Jan-05 M ar-06 Jun-07
12%
16%
20%
24%
28%
Sector Revenues Inflation Real
(R$ bn) Growth (IPCA) GDP Growth
2000 23.0 - 6.0% 4.3%
2001 25.3 10.0% 7.7% 1.3%
2002 27.9 10.3% 12.5% 2.7%
2003 31.6 13.3% 9.3% 1.2%
2004 36.6 15.8% 7.6% 5.7%
2005 40.0 9.3% 5.7% 2.9%
2006 44.0 10.0% 3.1% 3.7%
Selic Disposable Income
Disposable Income
(R$ billion)
Selic
(% p.a.)
(1) Source: ABRASCE
(2) Source: IBGE
8
Retail Sector Growth in September/07
Activities Jan-Sept 12 months
Supermarkets and hypermarkets 7.2 7.7
Fabrics, clothing and footwear 10.5 7.2
Pharmaceutical, medical, orthopedic and cosmetics
products
7.9 6.4
Office supplies and equipment, personal computers and
telecom
25.2 23.8
Books, newspapers, magazines and stationery 7.5 5.2
Other personal and domestic products 23.3 22.2
Vehicles, motorcycles and autoparts 23.4 19.5
Accumulated (%)
Furniture and white/durable goods 16.7 15.6
Source: GSB and IDV
9
@ IPO:
207.0
@ IPO:
238.9
@ IPO:
117.1
@ IPO:
119.0
257.9
372.6
207.9
161.3
317.0
BRMalls Multiplan Iguatemi General
Shopping
Brasil
Own GLA (1) (m2 in thousand) Market Share (2) (% of Total GLA)
31.5%
68.5%
The industry is highly
fragmented: the largest groups
operate only 18.3% of the
existing Shopping Centers and
31.5% of the total GLA in the
country
9 Largest Companies
+ Acquisitions
(1) Source: Companies’ website
(2) Source: Valor Análise Setorial – December/06
Fragmented Sector
Company Overview
11
Majority ownership: 85.9% average
11 shopping centers and 4 greenfields
Total GLA: 187,784 m2
Own GLA: 161,343 m2
Complementary services activities
9M07 financial highlights
– Gross revenue: 23.0%
– Adjusted EBITDA: 26.8%
– EBITDA margin: 73.2%
Focus on serving the B and C
consumption classes
These classes represent approximately
66% of the total consumption in Brazil
Shopping Center Own GLA
Internacional Shopping 100.0% 72,958 72,958
Santana Parque Shopping 50.0% 26,538 13,269
Shopping do Vale 84.4% 16,487 13,913
Shopping Light 50.1% 14,140 7,092
Suzano Shopping 100.0% 13,120 13,120
Auto Shopping 100.0% 11,477 11,477
Americanas Prudente 100.0% 10,276 10,276
Cascavel JL Shopping 85.5% 8,877 7,590
Top Center 100.0% 6,166 6,166
Poli Shopping 50.0% 4,527 2,264
Americanas Osasco 100.0% 3,218 3,218
85.9% 187,784 161,343
Itupeva Project 50.0% 17,357 8,679
Barueri Project 96.0% 25,000 24,000
Sulacap 90.0% 32,000 28,800
Convention Center 100.0% 25,730 25,730
Greenfield
Interest
87.1% 100,087 87,209(1) Gross leasable area
(2) Considering additional call of 20.0% stake
General Shopping Brasil at-a-Glance
Own GLAInterest
Total GLA
Total GLA
One of the largest companies in the Brazilian Shopping Center industry in terms of own GLA (1)
Competitive Advantages
12
Majority ownership interest
Close relationship with store owners and retail
intelligence
Well defined growth strategy
Diversified portfolio comprised of high quality assets
Innovative malls and services
Experienced management team
Average 14 years of experience in shopping
center/retail sector
13
Majority Ownership Interest
Shopping Centers / Stake Held
General Shopping Brasil is the key decision-maker of the strategies and policies of its shopping centers
Redevelopment
and remodeling
the shopping
centers
Provide
complementary
services
Flexibility in
establishing
partnerships
Redevelopment
and remodeling
of the tenant
mix
Internacional
Shopping
Guarulhos
Auto
Shopping
100%
Santana
Parque
Shopping (1)
Shopping
Light
Suzano
Shopping
Poli
Shopping
Cascavel JL
Shopping
Shopping
Americanas
Presidente
Prudente
Shopping
Americanas
Osasco
Top Center
Shopping
São Paulo
Shopping do
Vale
50% 50.0% 50.1% 100%
85.5% 100% 100% 100% 84.4%
100%
Expansion of
the existing
shopping
malls
Retail Intelligence and Relationship with Store Owners
14
Understanding of the shopping center business through both the
retail and the real estate approach
Quantitative and qualitative market surveys
Internal surveys
Market surveys
With retailers
Credibility to retain and attract the main retailers
Focus on improving store performance increasing revenues
from rent
Expansion and greenfied projects on demand
Diversified Growth Strategy
15
CONSOLIDATION
Acquisition of shopping centers
GREENFIELDS
Conception and development of new shopping centers
EXPANSION
Increase ownership interest in assets
GLA expansion in the existing portfolio
Implementation of mixed-use projects Synergies +
Profitability
TURN AROUND
Control of the tenant mix
Innovation in complementary services
16
Poli Shopping
80’s
Poli Shopping
90’s
Internacional
Shopping
Guarulhos
Internacional
Shopping Guarulhos
Auto Shopping
2006
After IPO
Auto Shopping
Santana Parque
Shopping
Suzano Shopping
Shopping Light
Cascavel JL Shopping
Internacional
Shopping Guarulhos Shopping Light
Acquisition of several shopping centers:
Suzano Shopping, Cascavel JL Shopping,
Shopping Americanas Presidente Prudente,
Shopping Americanas Osasco, Top Center
Shopping, Shopping do Vale
Sulacap Shopping, Shopping Barueri and
Shopping Center in Itupeva - greenfield
projects
Convention center – mixed use
Opening of Santana Parque Shopping
Planned expansions: Suzano Shopping,
Cascavel JL Shopping, Top Shopping,
Internacional Shopping, Poli Shopping
Several other projects under analysis
IPO
Jul/07
Solid and Proven Historical Growth
17
Portfolio
18
SP
Total GLA (m2
)
No. of stores
Visitors/year (mm)
11,477
80
ND
9
8
10,276
56
4.0
15
17,357
NA
NA
(1)
13,120
170
9.0
6 13
25,000
NA
NA
(1)
2
6,166
55
4.0
72,958
292
23.5
1
14,140
134
12.0
7
12
25,730
NA
NA
4
3,218
19
1.5
5
26,538
176
ND
4,527
52
6.0
3
Dominant Player in São Paulo
(1) Estimated
Total GLA (m2
)
No. of stores
Visitors/year (mm)
Total GLA (m2)
No. of stores
Visitors/year (mm)
Total GLA (m2)
No. of stores
Visitors/year (mm)
Total GLA (m2
)
No. of stores
Visitors/year (mm)
Total GLA (m2)
No. of stores
Visitors/year (mm)
Total GLA (m2
)
No. of stores
Visitors/year (mm)
Total GLA (m2)
No. of stores
Visitors/year (mm)
Total GLA (m2
)
No. of stores
Visitors/year (mm)
Total GLA (m2
)
No. of stores
Visitors/year (mm)
Total GLA (m2)
No. of stores
Visitors/year (mm)
Total GLA (m2
)
No. of stores
Visitors/year (mm)
RS
19
RJ
Shopping centers in operation
1. Internacional Shopping
2. Top Center
3. Poli Shopping
4. Americanas Osasco
5. Santana Parque
6. Suzano Shopping
7. Shopping Light
8. Americanas P. Prudente
9. Auto Shopping
10. Shopping do Vale
11. Cascavel JL Shopping
Greenfields
12. Convention Center
13. Barueri Shopping
14. Sulacap Shopping
15. Shopping in Itupeva
32,000
165
n.a.
(1)
(1)
14
10
16,487
94
2.0
(1) Estimated
Focus on the Southeastern and Southern Regions
PR 11
8,877
80
3.4
Total GLA (m2
)
No. of stores
Visitors/year (mm)
Total GLA (m2
)
No. of stores
Visitors/year (mm)
Total GLA (m2
)
No. of stores
Visitors/year (mm)
20
Services currently provided to the mall
Service rendering potential/on implementation
Parking
Water
Energy
Manage
ment
Increasing Complementary Services Activities
Complementary Services Activities
Complementary services activities present high margins, strong growth potential and diversify the Company’s revenues
ISG Auto Poli Light Santana Suzano Cascavel
Americ.
Pres.
Prudente
Americ.
Osasco
Do Vale
Top
Center
*
* Partial
21
Experienced Management Team
Fully-Integrated Team
Victor
Veronezi
Identification of
attractive
opportunities
Planning and
Expansion
Director
Alexandre
Dias
Analyses of retail
demand and market
potential
Marketing and
Retail Relations
Director
Waldemar
Jezler
Strategic planning
CEO
Ricardo
Castro
Feasibility studies
and financial
planning
CFO
Alessandro
Veronezi
Communication of
value creation to
shareholders
Investor
Relations
Director
Experience in the shopping center / retail sector (years)
(1) Mr. Ricardo Castro has 13 years of experience in banking and M&A
24 14 15 1 (1) 15
Financial Performance
Gross Revenue (R$ 000)
23
53,316
38,720
31,491
10,260
14,153
3Q06 3Q07 9M 06 9M 07 9M 07
PRO-FORMA
37.9%
69.3%
Adjusted EBITDA (R$ 000) and EBITDA Margin
24
5,816
33,920
8,615
19,189
24,325
73.2%
64.6%
3Q06 3Q07 9M06 9M07 9M07
48.1%
76.8%
PRO-FORMA
69.3%
70.7%
Net Income (R$ 000)
25
16,233
9,614
415
(4,660)
3,730
3Q06 3Q07 9M 06 9M 07 9M 07
3,811%
PRO-FORMA
Gross Revenue Breakdown
9M07 Revenue Breakdown
RENTALS
SERVICES
Rent
Energy
Water
3Q07 Revenue Breakdown
Transfer Fee
Mall &
Merchadising
Parking
Shopping
Center
Management
26
91%
4%5%
58%
1%5%
36%
91%
5%4%
59%
36%
4% 1%
7,503 8,369
22,566
24,438
3Q06 3Q07 9M06 9M07
11.5%
8.3%
Revenue from Rentals (R$ 000)
Revenue from Rentals (Same GLA Rent)
27
Financial Performance/M2
119.6 118.8
367.9 361.4
3T06 3T07 9M06 9M07
87.7 90.6
287.5 284.9
3T06 3T07 9M06 9M07
77.3 84.0
255.1 264.5
3T06 3T07 9M06 9M07
Net Revenue NOI
Adjusted EBITDA Adjusted Net Income
-62,0
36.4
5.5
104.5
3T06 3T07 9M06 9M07
28
36.5
18.4
78.7
22.0
10.9
2007 2008 2009 2010 After 2010
Indebtedness
Amortization Schedule (R$ million)Term
R$ 166.5 million
29
28%
72%
Short term Long term
Cash (R$ million)
Total Cash: R$ 193.9 million
30
29.1
164.8
Debt amortization Net cash
Greenfield Case – Santana Parque Shopping
31
Search for property according to internal survey pointing supply
shortage in the region
Quantitative and qualitative market surveys on project
Surveys with main anchor tenants through internal and crossed
data banks
MOU’s with anchors
Acquisition proposal – Higher bid than the competitors’ based
on project’s potential and risk mitigation
Opened in October 25, 2007
Successful occupancy levels (97% leased of total GLA) and
sales (30% higher than retailers’ expectations) at opening
Suzano has 290,000 inhabitants and annual population growth
of 3.45%, above the state of São Paulo’s average growth, and
qualified demand of approximately R$ 370 million/year
Suzano Shopping serves also the neighboring cities, such as
Itaquaquecetuba, Poá and Ferraz de Vasconcelos, and it is the
only shopping center in the region
Located beside the region’s largest supermarket
Tenant mix is currently based on few anchor tenants, but it
has potential for expansion of its GLA by over 50%, increasing
the flow of visitors and turning the mall into a regional
shopping center
Potential for all complementary services adding revenues
Acquisition/Expansion Case – Suzano Shopping
32
Acquisition/Turn Around Case – Shopping Light
The only shopping center located in downtown São Paulo,
above the Anhangabaú subway station, which has 63,000 users
a day.
Demand potential above R$ 540 million a year
Public comprised of B and C consumer segments (82%), GSB’s
target markets
Vacancy rate of approximately 25% at the time of acquisition by
GSB due to market gap
GSB is addressing the large vacant area of this shopping center
by improving the store mix, increasing the retail supply with
greater sales potential, filling the vacant areas or replacing the
existing ones (retail category management) and adding services
to tenant mix
Potential for all complementary services adding revenues
33
Area chosen according to survey pointing supply shortage
60,000 square meter lot of land located in privileged area,
without shopping malls in primary and secondary areas
Over 500 thousand inhabitants, mostly from the B anc C
consumer segments (79% of total)
Demand in the neighboring area is R$ 1.9 billion per year
At the opening, the shopping center will have GLA of
approximately 32,000 m² and a mix comprised of 165 stores
Power center with supermarket Carrefour and Home Center
C&C, both successful operations at the location
Shopping center has area for future expansion and mixed use,
as it is located in area with potential for strong population
growth
Greenfield Case - Sulacap
34
Key Takeaways
Market‐driven company with retail approach
B and C consumption classes as target market
Innovative complementary services
Innovative shopping center operations and themes
35
Contacts
GSB INVESTOR RELATIONS
Alessandro Poli Veronezi
Investor Relations Director
Marcio Snioka
Investor Relations Manager
55 11 3159-5100
dri@generalshopping.com.br
www.generalshopping.com.br

Analyst Meeting Presentation – Dec/07

  • 1.
    General Shopping Brasil Analystand Investor Meeting December 17, 2007
  • 2.
    Disclaimer 1 This presentation containsstatements that are forward-looking within the meaning of Section 27A of the Securities Act of 1933 and Section 21E of the Securities Exchange Act of 1934. Such forward- looking statements are only predictions and are not guarantees of future performance. Investors are cautioned that any such forward-looking statements are and will be, as the case may be, subject to many risks, uncertainties and factors relating to the operations and business environments of General Shopping and its subsidiaries that may cause the actual results of the companies to be materially different from any future results expressed or implied in such forward-looking statements. This material is published solely for informational purposes and is not to be construed as a solicitation or an offer to buy or sell any securities or related financial instruments and should not be treated as giving investment advice. It is not targeted to the specific investment objectives, financial situation or particular needs of any recipient. No representation or warranty, either express or implied, is provided in relation to the accuracy, completeness or reliability of the information contained herein. This material should not be regarded by recipients as a substitute for the exercise of their own judgment. Any opinions expressed in this material are expressed as of this date and subject to change without notice and General Shopping is not under the obligation to update or keep current the information contained herein. General Shopping and the respective affiliates, directors, partners and employees accept no liability whatsoever for any loss or damage of any kind arising out of the use of all or any part of this material. You should consult with your own legal, regulatory, tax, business, investment, financial and accounting advisers to the extent that you deem it necessary, and make your own investment, hedging and trading decision (including decisions regarding the suitability of this transaction) based upon your own judgment and advice from such advisers as you deem necessary and not upon any views expressed in this material.
  • 3.
  • 4.
    Highlights Growth through Greenfield (GSBexpertise track record) Acquisitions (GSB market intelligence and complementary services adding) Gross revenues up 37.9% to R$ 14.2 million in 3Q07 Pro forma (as now) up 69.3% in 9M07 Adjusted EBITDA up 48.1% to R$ 8.6 million in 3Q07 Pro forma (as now) up 76.8% in 9M07 3
  • 5.
  • 6.
    5 Positive Sector Outlook 281294 303 317 326 335 346 2000 2001 2002 2003 2004 2005 2006 7.5 6.46.2 5.65.55.25.1 6.36.46.25.7 5.24.9 2000 2001 2002 2003 2004 2005 2006 125 203 135 160 175 185 181 2 2 9 2 192 0 318 918 9 19 5 2000 2001 2002 2003 2004 2005 2006 23.0 25.3 27.9 31.6 36.6 40.0 44.0 2000 2001 2002 2003 2004 2005 2006 CAGR = 7.7% Visitors per month (million) Revenue / average visitors per month (R$) Revenues (R$ in billion) Operating Shopping Centers Visitors per Month GLA CAGR = 11.4% CAGR = 3.5% CAGR = 6.6% Source: ABRASCE GLA (million m2) Revenue / average GLA (R$ thousand / m2 )
  • 7.
    6 Low Sector Penetration Revenues(% of Local Retail Market (1)) Vacancy Rate (2) 20% 70% 30%-35% Brazil Europe USA The Brazilian Shopping Center Sector Presents Ample Room for Growth 5.7% 4.0% 4.4% 2.9% 7.4% 2.4% 1.2% 1.7% 2003 2004 2005 2006 Secto r General Sho pping B rasil Source: ABRASCE (1) Excludes car sales (2) Year end
  • 8.
    7 Favorable Macroeconomics Brazilian ShoppingCenter Industry Revenue (1) Disposable Income vs. Interest Rates (2) Retail Sales Real Growth (2) 90% 100% 110% 120% 130% 2000 2001 2002 2003 2004 2005 2006 2007 $400 $450 $500 $550 $600 $650 M ar-00 Jun-01 Aug-02 Nov-03 Jan-05 M ar-06 Jun-07 12% 16% 20% 24% 28% Sector Revenues Inflation Real (R$ bn) Growth (IPCA) GDP Growth 2000 23.0 - 6.0% 4.3% 2001 25.3 10.0% 7.7% 1.3% 2002 27.9 10.3% 12.5% 2.7% 2003 31.6 13.3% 9.3% 1.2% 2004 36.6 15.8% 7.6% 5.7% 2005 40.0 9.3% 5.7% 2.9% 2006 44.0 10.0% 3.1% 3.7% Selic Disposable Income Disposable Income (R$ billion) Selic (% p.a.) (1) Source: ABRASCE (2) Source: IBGE
  • 9.
    8 Retail Sector Growthin September/07 Activities Jan-Sept 12 months Supermarkets and hypermarkets 7.2 7.7 Fabrics, clothing and footwear 10.5 7.2 Pharmaceutical, medical, orthopedic and cosmetics products 7.9 6.4 Office supplies and equipment, personal computers and telecom 25.2 23.8 Books, newspapers, magazines and stationery 7.5 5.2 Other personal and domestic products 23.3 22.2 Vehicles, motorcycles and autoparts 23.4 19.5 Accumulated (%) Furniture and white/durable goods 16.7 15.6 Source: GSB and IDV
  • 10.
    9 @ IPO: 207.0 @ IPO: 238.9 @IPO: 117.1 @ IPO: 119.0 257.9 372.6 207.9 161.3 317.0 BRMalls Multiplan Iguatemi General Shopping Brasil Own GLA (1) (m2 in thousand) Market Share (2) (% of Total GLA) 31.5% 68.5% The industry is highly fragmented: the largest groups operate only 18.3% of the existing Shopping Centers and 31.5% of the total GLA in the country 9 Largest Companies + Acquisitions (1) Source: Companies’ website (2) Source: Valor Análise Setorial – December/06 Fragmented Sector
  • 11.
  • 12.
    11 Majority ownership: 85.9%average 11 shopping centers and 4 greenfields Total GLA: 187,784 m2 Own GLA: 161,343 m2 Complementary services activities 9M07 financial highlights – Gross revenue: 23.0% – Adjusted EBITDA: 26.8% – EBITDA margin: 73.2% Focus on serving the B and C consumption classes These classes represent approximately 66% of the total consumption in Brazil Shopping Center Own GLA Internacional Shopping 100.0% 72,958 72,958 Santana Parque Shopping 50.0% 26,538 13,269 Shopping do Vale 84.4% 16,487 13,913 Shopping Light 50.1% 14,140 7,092 Suzano Shopping 100.0% 13,120 13,120 Auto Shopping 100.0% 11,477 11,477 Americanas Prudente 100.0% 10,276 10,276 Cascavel JL Shopping 85.5% 8,877 7,590 Top Center 100.0% 6,166 6,166 Poli Shopping 50.0% 4,527 2,264 Americanas Osasco 100.0% 3,218 3,218 85.9% 187,784 161,343 Itupeva Project 50.0% 17,357 8,679 Barueri Project 96.0% 25,000 24,000 Sulacap 90.0% 32,000 28,800 Convention Center 100.0% 25,730 25,730 Greenfield Interest 87.1% 100,087 87,209(1) Gross leasable area (2) Considering additional call of 20.0% stake General Shopping Brasil at-a-Glance Own GLAInterest Total GLA Total GLA One of the largest companies in the Brazilian Shopping Center industry in terms of own GLA (1)
  • 13.
    Competitive Advantages 12 Majority ownershipinterest Close relationship with store owners and retail intelligence Well defined growth strategy Diversified portfolio comprised of high quality assets Innovative malls and services Experienced management team Average 14 years of experience in shopping center/retail sector
  • 14.
    13 Majority Ownership Interest ShoppingCenters / Stake Held General Shopping Brasil is the key decision-maker of the strategies and policies of its shopping centers Redevelopment and remodeling the shopping centers Provide complementary services Flexibility in establishing partnerships Redevelopment and remodeling of the tenant mix Internacional Shopping Guarulhos Auto Shopping 100% Santana Parque Shopping (1) Shopping Light Suzano Shopping Poli Shopping Cascavel JL Shopping Shopping Americanas Presidente Prudente Shopping Americanas Osasco Top Center Shopping São Paulo Shopping do Vale 50% 50.0% 50.1% 100% 85.5% 100% 100% 100% 84.4% 100% Expansion of the existing shopping malls
  • 15.
    Retail Intelligence andRelationship with Store Owners 14 Understanding of the shopping center business through both the retail and the real estate approach Quantitative and qualitative market surveys Internal surveys Market surveys With retailers Credibility to retain and attract the main retailers Focus on improving store performance increasing revenues from rent Expansion and greenfied projects on demand
  • 16.
    Diversified Growth Strategy 15 CONSOLIDATION Acquisitionof shopping centers GREENFIELDS Conception and development of new shopping centers EXPANSION Increase ownership interest in assets GLA expansion in the existing portfolio Implementation of mixed-use projects Synergies + Profitability TURN AROUND Control of the tenant mix Innovation in complementary services
  • 17.
    16 Poli Shopping 80’s Poli Shopping 90’s Internacional Shopping Guarulhos Internacional ShoppingGuarulhos Auto Shopping 2006 After IPO Auto Shopping Santana Parque Shopping Suzano Shopping Shopping Light Cascavel JL Shopping Internacional Shopping Guarulhos Shopping Light Acquisition of several shopping centers: Suzano Shopping, Cascavel JL Shopping, Shopping Americanas Presidente Prudente, Shopping Americanas Osasco, Top Center Shopping, Shopping do Vale Sulacap Shopping, Shopping Barueri and Shopping Center in Itupeva - greenfield projects Convention center – mixed use Opening of Santana Parque Shopping Planned expansions: Suzano Shopping, Cascavel JL Shopping, Top Shopping, Internacional Shopping, Poli Shopping Several other projects under analysis IPO Jul/07 Solid and Proven Historical Growth
  • 18.
  • 19.
    18 SP Total GLA (m2 ) No.of stores Visitors/year (mm) 11,477 80 ND 9 8 10,276 56 4.0 15 17,357 NA NA (1) 13,120 170 9.0 6 13 25,000 NA NA (1) 2 6,166 55 4.0 72,958 292 23.5 1 14,140 134 12.0 7 12 25,730 NA NA 4 3,218 19 1.5 5 26,538 176 ND 4,527 52 6.0 3 Dominant Player in São Paulo (1) Estimated Total GLA (m2 ) No. of stores Visitors/year (mm) Total GLA (m2) No. of stores Visitors/year (mm) Total GLA (m2) No. of stores Visitors/year (mm) Total GLA (m2 ) No. of stores Visitors/year (mm) Total GLA (m2) No. of stores Visitors/year (mm) Total GLA (m2 ) No. of stores Visitors/year (mm) Total GLA (m2) No. of stores Visitors/year (mm) Total GLA (m2 ) No. of stores Visitors/year (mm) Total GLA (m2 ) No. of stores Visitors/year (mm) Total GLA (m2) No. of stores Visitors/year (mm) Total GLA (m2 ) No. of stores Visitors/year (mm)
  • 20.
    RS 19 RJ Shopping centers inoperation 1. Internacional Shopping 2. Top Center 3. Poli Shopping 4. Americanas Osasco 5. Santana Parque 6. Suzano Shopping 7. Shopping Light 8. Americanas P. Prudente 9. Auto Shopping 10. Shopping do Vale 11. Cascavel JL Shopping Greenfields 12. Convention Center 13. Barueri Shopping 14. Sulacap Shopping 15. Shopping in Itupeva 32,000 165 n.a. (1) (1) 14 10 16,487 94 2.0 (1) Estimated Focus on the Southeastern and Southern Regions PR 11 8,877 80 3.4 Total GLA (m2 ) No. of stores Visitors/year (mm) Total GLA (m2 ) No. of stores Visitors/year (mm) Total GLA (m2 ) No. of stores Visitors/year (mm)
  • 21.
    20 Services currently providedto the mall Service rendering potential/on implementation Parking Water Energy Manage ment Increasing Complementary Services Activities Complementary Services Activities Complementary services activities present high margins, strong growth potential and diversify the Company’s revenues ISG Auto Poli Light Santana Suzano Cascavel Americ. Pres. Prudente Americ. Osasco Do Vale Top Center * * Partial
  • 22.
    21 Experienced Management Team Fully-IntegratedTeam Victor Veronezi Identification of attractive opportunities Planning and Expansion Director Alexandre Dias Analyses of retail demand and market potential Marketing and Retail Relations Director Waldemar Jezler Strategic planning CEO Ricardo Castro Feasibility studies and financial planning CFO Alessandro Veronezi Communication of value creation to shareholders Investor Relations Director Experience in the shopping center / retail sector (years) (1) Mr. Ricardo Castro has 13 years of experience in banking and M&A 24 14 15 1 (1) 15
  • 23.
  • 24.
    Gross Revenue (R$000) 23 53,316 38,720 31,491 10,260 14,153 3Q06 3Q07 9M 06 9M 07 9M 07 PRO-FORMA 37.9% 69.3%
  • 25.
    Adjusted EBITDA (R$000) and EBITDA Margin 24 5,816 33,920 8,615 19,189 24,325 73.2% 64.6% 3Q06 3Q07 9M06 9M07 9M07 48.1% 76.8% PRO-FORMA 69.3% 70.7%
  • 26.
    Net Income (R$000) 25 16,233 9,614 415 (4,660) 3,730 3Q06 3Q07 9M 06 9M 07 9M 07 3,811% PRO-FORMA
  • 27.
    Gross Revenue Breakdown 9M07Revenue Breakdown RENTALS SERVICES Rent Energy Water 3Q07 Revenue Breakdown Transfer Fee Mall & Merchadising Parking Shopping Center Management 26 91% 4%5% 58% 1%5% 36% 91% 5%4% 59% 36% 4% 1%
  • 28.
    7,503 8,369 22,566 24,438 3Q06 3Q079M06 9M07 11.5% 8.3% Revenue from Rentals (R$ 000) Revenue from Rentals (Same GLA Rent) 27
  • 29.
    Financial Performance/M2 119.6 118.8 367.9361.4 3T06 3T07 9M06 9M07 87.7 90.6 287.5 284.9 3T06 3T07 9M06 9M07 77.3 84.0 255.1 264.5 3T06 3T07 9M06 9M07 Net Revenue NOI Adjusted EBITDA Adjusted Net Income -62,0 36.4 5.5 104.5 3T06 3T07 9M06 9M07 28
  • 30.
    36.5 18.4 78.7 22.0 10.9 2007 2008 20092010 After 2010 Indebtedness Amortization Schedule (R$ million)Term R$ 166.5 million 29 28% 72% Short term Long term
  • 31.
    Cash (R$ million) TotalCash: R$ 193.9 million 30 29.1 164.8 Debt amortization Net cash
  • 32.
    Greenfield Case –Santana Parque Shopping 31 Search for property according to internal survey pointing supply shortage in the region Quantitative and qualitative market surveys on project Surveys with main anchor tenants through internal and crossed data banks MOU’s with anchors Acquisition proposal – Higher bid than the competitors’ based on project’s potential and risk mitigation Opened in October 25, 2007 Successful occupancy levels (97% leased of total GLA) and sales (30% higher than retailers’ expectations) at opening
  • 33.
    Suzano has 290,000inhabitants and annual population growth of 3.45%, above the state of São Paulo’s average growth, and qualified demand of approximately R$ 370 million/year Suzano Shopping serves also the neighboring cities, such as Itaquaquecetuba, Poá and Ferraz de Vasconcelos, and it is the only shopping center in the region Located beside the region’s largest supermarket Tenant mix is currently based on few anchor tenants, but it has potential for expansion of its GLA by over 50%, increasing the flow of visitors and turning the mall into a regional shopping center Potential for all complementary services adding revenues Acquisition/Expansion Case – Suzano Shopping 32
  • 34.
    Acquisition/Turn Around Case– Shopping Light The only shopping center located in downtown São Paulo, above the Anhangabaú subway station, which has 63,000 users a day. Demand potential above R$ 540 million a year Public comprised of B and C consumer segments (82%), GSB’s target markets Vacancy rate of approximately 25% at the time of acquisition by GSB due to market gap GSB is addressing the large vacant area of this shopping center by improving the store mix, increasing the retail supply with greater sales potential, filling the vacant areas or replacing the existing ones (retail category management) and adding services to tenant mix Potential for all complementary services adding revenues 33
  • 35.
    Area chosen accordingto survey pointing supply shortage 60,000 square meter lot of land located in privileged area, without shopping malls in primary and secondary areas Over 500 thousand inhabitants, mostly from the B anc C consumer segments (79% of total) Demand in the neighboring area is R$ 1.9 billion per year At the opening, the shopping center will have GLA of approximately 32,000 m² and a mix comprised of 165 stores Power center with supermarket Carrefour and Home Center C&C, both successful operations at the location Shopping center has area for future expansion and mixed use, as it is located in area with potential for strong population growth Greenfield Case - Sulacap 34
  • 36.
    Key Takeaways Market‐driven companywith retail approach B and C consumption classes as target market Innovative complementary services Innovative shopping center operations and themes 35
  • 37.
    Contacts GSB INVESTOR RELATIONS AlessandroPoli Veronezi Investor Relations Director Marcio Snioka Investor Relations Manager 55 11 3159-5100 dri@generalshopping.com.br www.generalshopping.com.br