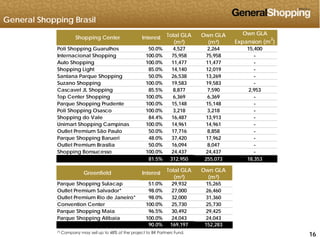
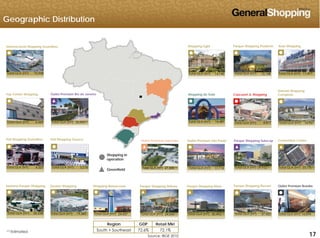
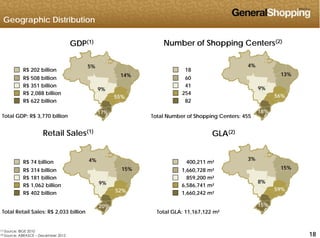
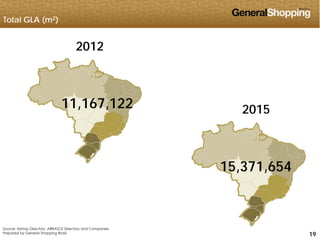
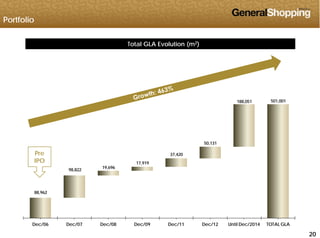
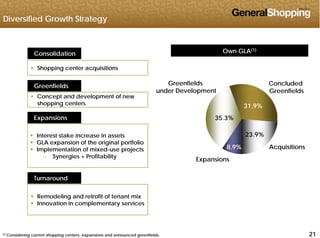
SlideShare a Scribd company logo
UBS Consumer & Retail
11
UBS Consumer & Retail
São Paulo –April 2013
Disclaimer
This presentation contains statements that are forward-looking within the meaning of Section 27A of the
Securities Act of 1933 and Section 21E of the Securities Exchange Act of 1934. Such forward-lookingg g
statements are only predictions and are not guarantees of future performance. Investors are cautioned
that any such forward-looking statements are and will be, as the case may be, subject to many risks,
uncertainties and factors relating to the operations and business environments of General Shopping
and its subsidiaries that may cause the actual results of the companies to be materially different from
any future results expressed or implied in such forward-looking statements.
This material is published solely for informational purposes and is not to be construed as a solicitation or
an offer to buy or sell any securities or related financial instruments and should not be treated as giving
investment advice It is not targeted to the specific investment objectives financial situation orinvestment advice. It is not targeted to the specific investment objectives, financial situation or
particular needs of any recipient. No representation or warranty, either express or implied, is provided in
relation to the accuracy, completeness or reliability of the information contained herein. This material
should not be regarded by recipients as a substitute for the exercise of their own judgment.
Any opinions expressed in this material are expressed as of this date and subject to change without
notice and General Shopping is not under the obligation to update or keep current the information
contained herein. General Shopping and the respective affiliates, directors, partners and employees
accept no liability whatsoever for any loss or damage of any kind arising out of the use of all or any partp y y g y g y p
of this material. You should consult with your own legal, regulatory, tax, business, investment, financial
and accounting advisers to the extent that you deem it necessary, and make your own investment,
hedging and trading decision (including decisions regarding the suitability of this transaction) based
upon your own judgment and advice from such advisers as you deem necessary and not upon any
222
views expressed in this material.
Agenda
Sector Overview
Company OverviewCompany Overview
Financial Performance
333
Sector Overview
44
Economic Indicators
Unemployment Rate in January
11 7%
Unemployment Rate in January
11.7%
10.2%
9.3% 9.3%
8.0% 8.2%
7.2%
6.1%
5 5% 5 4%5.5% 5.4%
555
Jan/04 Jan/05 Jan/06 Jan/07 Jan/08 Jan/09 Jan/10 Jan/11 Jan/12 Jan/13
Source: PME-IBGE
Table prepared by General Shopping Brasil
Economic Indicators
Real Income of the Employed Population¹
36 7
38.8
R$ billion
30.4
31.9
32.6
35.2
36.7
23.7
24.9
26.1
28.0
Jan/04 Jan/05 Jan/06 Jan/07 Jan/08 Jan/09 Jan/10 Jan/11 Jan/12 Jan/13
666
Jan/04 Jan/05 Jan/06 Jan/07 Jan/08 Jan/09 Jan/10 Jan/11 Jan/12 Jan/13
Source: PME-IBGE; Table prepared by General Shopping Brasil
(1)Based on the employed population and their average income
Credit Performance
Credit Volume – Individuals
Volume and Monthly Change
660
690
720
750
24%
26%
(t-12) R$ billion
540
570
600
630
660
20%
22%
420
450
480
510
14%
16%
18%
300
330
360
390
10%
12%
777
Source: Central Bank
Table prepared by General Shopping Brasil
Credit Performance
Default Rate
Individuals and General
8.0
7.7
7.4
7.9
General Individuals
5.7
888
Source: Central Bank
Table prepared by General Shopping Brasil
Economic Indicators
Consumer Confidence Index
Index - Quarterly Moving Average
125
130
110
115
120
95
100
105
80
85
90
999
Source: Fundação Getulio Vargas - FGV
Table prepared by General Shopping Brasil
Retail Performance
Sales Volume - Monthly change (%)
As compared with same year-ago period
10.4
8.3
7.8
6.0 5.9
101010
Source: PMC-IBGE
Table prepared by General Shopping Brasil
Retail Growth
15
25
35
45
Retail Industry: Monthly Change (VS Same Year-Ago Period) of Sales Volume (Jan/11-Jan/13)
Total ‐ Retail
Books, newspapers, magazines and 
stationery
Office supplies and equipment,  personal 
computer and telecom
Other personal and domestic products
‐25
‐15
‐5
5
15
y p
Jan‐11 8.3 12.5 7.4 4.9
Feb‐11 8.5 14.9 14.8 12.5
Mar‐11 4.0 ‐1.2 4.2 4.6
Apr‐11 10.2 5.8 ‐0.8 12.1
May‐11 6.3 8.3 23.2 3.3
Jun‐11 7.1 9.0 34.7 3.2
Jul‐11 7.1 6.8 16.2 2.9
Aug‐11 6.3 5.2 26.3 1.7
Sep‐11 5.2 2.7 7.6 ‐0.1
Oct‐11 4.2 4.4 28.8 0.5
Nov‐11 6.7 5.5 24.7 2.6Nov 11 6.7 5.5 24.7 2.6
Dec‐11 6.7 ‐2.3 34.8 3.4
Jan‐12 7.8 9.8 32.9 13.1
Feb‐12 10.6 ‐0.2 33.5 5.0
Mar‐12 12.5 4.9 27.3 9.5
Apr‐12 6.0 ‐4.0 33.2 2.6
May‐12 8.3 2.0 17.2 8.2
Jun‐12 9.4 9.5 ‐18.5 6.6
Jul‐12 7.2 6.3 11.3 6.4
Aug‐12 10.0 4.8 11.1 10.6
Sep‐12 8.5 4.1 ‐0.4 7.5
Oct 12 9 2 11 1 16 1 13 6
111111
Oct‐12 9.2 11.1 16.1 13.6
Nov‐12 8.5 11.2 ‐0.8 18.5
Dec‐12 5.1 4.9 ‐23.3 10.0
Jan‐13 5.9 5.4 8.8 13.9
Source: Brazilian Institute of Geography and Statistics (IBGE)
Table prepared by General Shopping Brasil
Retail Growth
Retail Industry: Monthly Change (VS Same Year-Ago Period) of Sales Volume (Jan/11-Jan/13)
15
20
25
Total ‐ Retail Supermarkets and hypermarkets Fabrics, clothing and footwear
Furniture and white/durable 
goods
Pharmaceutical, medical, 
orthopedic and cosmetics
‐5
0
5
10
goods orthopedic and cosmetics
Jan‐11 8.3 4.2 9.8 19.1 12.7
Feb‐11 8.5 2.7 14.2 20.3 10.6
Mar‐11 4.0 1.4 5.7 11.2 5.3
Apr‐11 10.2 10.6 1.5 19.3 10.5
May‐11 6.3 1.9 5.6 20.4 12.0
Jun‐11 7.1 2.7 11.3 16.4 12.8
Jul‐11 7.1 4.6 1.4 21.1 10.4
Aug‐11 6.3 3.9 0.8 16.9 9.5
Sep‐11 5.2 3.5 0.7 16.0 10.9
Oct‐11 4.2 2.3 ‐2.2 13.1 7.5
Nov‐11 6 7 6 2 0 4 12 3 8 4Nov 11 6.7 6.2 0.4 12.3 8.4
Dec‐11 6.7 4.6 0.8 15.3 7.0
Jan‐12 7.8 8.5 1.5 13.2 8.6
Feb‐12 10.6 13.3 ‐3.2 13.5 9.5
Mar‐12 12.5 12.4 4.3 20.9 14.2
Apr‐12 6.0 3.6 ‐1.4 12.5 9.3
May‐12 8.3 8.8 4.0 9.3 12.3
Jun‐12 9.4 11.1 0.6 15.6 11.3
Jul‐12 7.2 5.0 5.7 12.6 11.4
Aug‐12 10.0 8.5 8.4 15.3 12.8
Sep‐12 8.5 9.9 5.4 6.2 8.2
Oct 12 9 2 6 6 4 5 13 8 13 0
121212
Source: Brazilian Institute of Geography and Statistics (IBGE)
Table prepared by General Shopping Brasil
Oct‐12 9.2 6.6 4.5 13.8 13.0
Nov‐12 8.5 8.3 6.5 8.5 9.6
Dec‐12 5.1 6.6 3.2 9.0 3.6
Jan‐13 5.9 3.4 5.0 5.8 10.4
Company Overview
1313
Differentials
 Market-driven company with retail approach
 B and C consumption classes as target market
 Innovative complementary services
 Majority ownership: 81.5% average interestj g
141414
Shopping Center´s definitions
 ICSC - “Is a group of retail stores, planned,
developed and managed like an only one
operation.”
 ABRASCE – “ A planed group of retail stores with an
integrated operation and centralized
management and at least part of its rentalmanagement,…, and at least part of its rental
revenues must be part of retail´s sales revenues.”
151515
General Shopping Brasil
Poli Shopping Guarulhos 50.0% 4,527 2,264 15,400
Internacional Shopping 100.0% 75,958 75,958 -
Own GLA
Expansion (m
2
)
Shopping Center Interest Total GLA
(m²)
Own GLA
(m²)
Auto Shopping 100.0% 11,477 11,477 -
Shopping Light 85.0% 14,140 12,019 -
Santana Parque Shopping 50.0% 26,538 13,269 -
Suzano Shopping 100.0% 19,583 19,583 -
Cascavel JL Shopping 85 5% 8 877 7 590 2 953Cascavel JL Shopping 85.5% 8,877 7,590 2,953
Top Center Shopping 100.0% 6,369 6,369 -
Parque Shopping Prudente 100.0% 15,148 15,148 -
Poli Shopping Osasco 100.0% 3,218 3,218 -
Shopping do Vale 84.4% 16,487 13,913 -Shopping do Vale 84.4% 16,487 13,913
Unimart Shopping Campinas 100.0% 14,961 14,961 -
Outlet Premium São Paulo 50.0% 17,716 8,858 -
Parque Shopping Barueri 48.0% 37,420 17,962 -
Outlet Premium Brasília 50.0% 16,094 8,047 -
Shopping Bonsucesso 100.0% 24,437 24,437 -
81.5% 312,950 255,073 18,353
Greenfield Interest
Total GLA
(m²)
Own GLA
(m²)
Parque Shopping Sulacap 51.0% 29,932 15,265
Outlet Premium Salvador* 98.0% 27,000 26,460
Outlet Premium Rio de Janeiro* 98.0% 32,000 31,360
Convention Center 100.0% 25,730 25,730
Sh i i 96 % 30 492 29 42
( ) ( )
161616
Parque Shopping Maia 96.5% 30,492 29,425
Parque Shopping Atibaia 100.0% 24,043 24,043
90.0% 169,197 152,283
(*) Company may sell up to 48% of the project to BR Partners Fund.
Geographic Distribution
Internacional Shopping Guarulhos Shopping Light Parque Shopping Prudente Auto Shopping
8
15,148Total GLA (m2) Total GLA (m2) 11,47775,958Total GLA (m2) 14,140Total GLA (m2)
Top Center Shopping Shopping do Vale Cascavel JL Shopping
Unimart Shopping
CampinasOutlet Premium Rio de Janeiro
Poli Shopping Guarulhos Poli Shopping Osasco Outlet Premium São Paulo Convention Center
16,487Total GLA (m2) 8,877Total GLA (m2)6,369Total GLA (m2)
Outlet Premium Salvador
32,000(1)Total GLA (m2) 14,961Total GLA (m2)
Parque Shopping Sulacap
Greenfield
Shopping in
operation
25,730Total GLA (m2)4,527Total GLA (m2) 3,218Total GLA (m2) (1)
27,000 (1)Total GLA (m2) 29,932 (1)Total GLA (m2)17,716Total GLA (m2)
Santana Parque Shopping Suzano Shopping Outlet Premium BrasíliaParque Shopping Maia Parque Shopping BarueriParque Shopping AtibaiaShopping Bonsucesso
171717
26,538Total GLA (m2) 19,583Total GLA (m2) 16,094Total GLA (m2)
(1) Estimated
Source: IBGE 2010
30,492 (1)Total GLA (m2)
Region GDP Retail Mkt
South + Southeast 72.6% 72.1%
24,437Total GLA (m2) (1)
24,043Total GLA (m2) 37,420Total GLA (m2)
Geographic Distribution
GDP(1) Number of Shopping Centers(2)
4%
13%
9%
5%
14%
9%
R$ 202 billion
R$ 508 billion
R$ 351 billion
18
60
41
9%
56%
18%
9%
55%
17%
R$ 2,088 billion
R$ 622 billion
Total GDP: R$ 3,770 billion Total Number of Shopping Centers: 455
254
82
Retail Sales(1)
GLA(2)
g
R$ 74 billion
R$ 314 billion
R$ 181 billion
4%
15%
3%
15%
400,211 m²
1,660,728 m²
859,200 m²R$ 181 billion
R$ 1,062 billion
R$ 402 billion
9%
52%
20%
8%
59%
15%
859,200 m
6,586,741 m²
1,660,242 m²
181818
(1) Source: IBGE 2010
(2) Source: ABRASCE – December 2012
Total Retail Sales: R$ 2,033 billion Total GLA: 11,167,122 m²
Total GLA (m2)
2012
201511,167,122
15,371,654
191919
Source: Alshop Directory, ABRASCE Directory and Companies
Prepared by General Shopping Brasil
Portfolio
Total GLA Evolution (m2)
188,051 501,001
50,131
98,822
19,696
17,919
37,420Pre
IPO
88,962
202020
Dec/06 Dec/07 Dec/08 Dec/09 Dec/11 Dec/12 Until Dec/2014 TOTAL GLA
Diversified Growth Strategy
Consolidation
Own GLA(1)
Own GLA(1)
 Shopping center acquisitions
Greenfields Concluded
G fi ld
Greenfields
d D l t
31.9%
35 3%
 Concept and development of new
shopping centers
Expansions
Greenfieldsunder Development
23.9%
8.9%
35.3%Expansions
 Interest stake increase in assets
 GLA expansion of the original portfolio
 Implementation of mixed use projects Acquisitions8.9% Implementation of mixed-use projects
 Synergies + Profitability
Turnaround
Acquisitions
Expansions
Turnaround
 Remodeling and retrofit of tenant mix
 Innovation in complementary services
212121(1) Considering current shopping centers, expansions and announced greenfields.
Case - Outlet
Outlet Premium São Paulo
Type: Greenfield
Stake: 50%
Influence area (inhabitants): super-regional
O R t 98 0% ( t i ) 100 0% t dOccupancy Rate: 98.0% (at opening) - 100.0% today
Description: First outlet of the country. Entrance for main brands with
outlet operations Located on the highway which connects São Paulooutlet operations. Located on the highway which connects São Paulo
capital to the Campinas metropolitan region. Power center
comprising hotel and 2 theme parks.
Initiative: Sales channel for remainder merchandise with occupancy
costs suitable to the off-price operation
222222
Outlet Premium São Paulo- Greenfield
232323
Case - Outlet
Outlet Premium Brasília
Type: Greenfield
Stake: 50%
Influence area (inhabitants): super-regional
Occupancy Rate: pre-tenanted 90.0% - today 97.0%
Description: Second Outlet developed in the country. Located on the
highway which connects Brasília (country capital) to Goiânia (Goiáshighway which connects Brasília (country capital) to Goiânia (Goiás
state capital), the two biggest cities in midwestern states.
242424
Outlet Premium Brasília - Greenfield
252525
Case - Outlet
Outlet Premium Salvador
Type: Greenfield
Stake: 98%
Influence area (inhabitants): super-regional
Description: Third Outlet in the country with forecast to open in 2013.
Located next to Salvador, the biggest city in northeastern states, on
the road to the tourism resortsthe road to the tourism resorts.
262626
Outlet Premium Salvador - Greenfield
272727
Unimart Shopping Campinas
Unimart Shopping Campinaspp g p
Type: Open Lifestyle Center
Interest: 100%
% of B and C consumption classes: 88%
Public comprised (inhabitants): 277 thousand
Description: Large potential for lifestyle center. Office and home
b ildi d F i f d t fit l b dbuildings around. Focus on services, food courts, fitness club and
leisure. Lower occupancy costs with higher rentals/m2.
282828
Unimart Shopping Campinas – Lifestyle Case
Before
CompletedCompleted
292929
Parque Shopping Prudente - Expansion
Parque Shopping Prudente
Type: NeighborhoodType: Neighborhood
Interest: 100.0%
% of B and C consumption classes: 84.0%% of B and C consumption classes: 84.0%
Public comprised (inhabitants): 800 thousand
303030
Parque Shopping Prudente - Expansion
313131
Shopping Bonsucesso - Acquisition
Shopping Bonsucesso
Type: NeighborhoodType: Neighborhood
Interest: 100.0%
Total GLA: 24,437 m2Total GLA: 24,437 m
Opening: 2006
Acquisition: 2012
Public comprised (inhabitants): 753 thousand
323232
Shopping Bonsucesso - Acquisition
333333
Increasing Complementary Services Activities
Management Parking Water Energy
ISG    
Auto    
Atlas
Auto    
Poli    
Light    Stake Held
R ibl f l i th
Santana *   
Cascavel    
Suzano    
Energy100%
► Responsible for planning the
energy supply and leasing of
the equipment for its
transmission and distribution
► Engaged in water supply Cascavel    
Prudente
Parque    
Poli Shopping
Osasco  
Wass
I Park
100%
100%
► Engaged in water supply
planning and its treatment
and distribution
► Controls and manages
Top Center  
Do Vale    
Unimart
C i    
I Park
GSB Adm
100%
100%
parking lots
► Manages operations of
shopping centers
Campinas    
Outlet Premium
São Paulo    
Parque Shopping
Barueri    ASG Adm100%
pp g
► Manages the operations of
Auto Shopping
343434
Outlet Premium
Brasília    
Services currently provided to the mall
 Potential services / currently being implemented
 * Partial
Shopping
Bonsucesso    
Stock Performance
Stock Performance
(Basis 100 – DEC 31, 2008)
R$ 12.40*
446.3%*
500
550
600
650
700
56,034*
49.2%*200
250
300
350
400
450
500
0
50
100
150
200
ec‐08
an‐09
eb‐09
ar‐09
pr‐09
ay‐09
un‐09
ul‐09
ug‐09
ep‐09
ct‐09
ov‐09
ec‐09
an‐10
eb‐10
ar‐10
pr‐10
ay‐10
un‐10
ul‐10
ug‐10
ep‐10
ct‐10
ov‐10
ec‐10
an‐11
eb‐11
ar‐11
pr‐11
ay‐11
un‐11
ul‐11
ug‐11
ep‐11
ct‐11
ov‐11
ec‐11
an‐12
eb‐12
ar‐12
pr‐12
ay‐12
un‐12
ul‐12
ug‐12
ep‐12
ct‐12
ov‐12
ec‐12
an‐13
eb‐13
ar‐13
De
Ja
Fe
Ma
Ap
Ma
Ju
Ju
Au
Se
Oc
No
De
Ja
Fe
Ma
Ap
Ma
Ju
Ju
Au
Se
Oc
No
De
Ja
Fe
Ma
Ap
Ma
Ju
Ju
Au
Se
Oc
No
De
Ja
Fe
Ma
Ap
Ma
Ju
Ju
Au
Se
Oc
No
De
Ja
Fe
Ma
GSHP3 Ibovespa
353535
(*) In MAR 27, 2013
Until DEC 28, 2012: GSHP3 = 370.0%
Ibovespa = 62.3%
Liquidity
GSHP3
12,625 
13,164 
13,391 
13,561 Volume (R$ thousand)
1 105
1,886 
6,263 
5,254 
3,911 
3,236  3,077 
5,945 
8,196 
6,569 
5,864 
278,611 
574  712  568  809  1,105  4,545 
Hiring of new
Market Maker
XP I ti t
64,685 
91,672 
65,527  66,365  59,840
102,614 
64,746 
150,268 
92,470 
156,813 
122,759 
58,566
XP Investimentos
22,902  13,294  4,231  6,394 
17,971 
42,790 
59,840  58,566 
45,608 
1Q08 2Q08 3Q08 4Q08 1Q09 2Q09 3Q09 4Q09 1Q10 2Q10 3Q10 4Q10 1Q11 2Q11 3Q11 4Q11 1Q12 2Q12 3Q12 4Q12
363636
Trading Volume Number of Trades
Shareholders
Nr. Shares Type of investor
(*)
40.6%
Nr. Shares Type of investor
Controlling
shareholder
30,000,000 -
58.9% - Brazilian
59.4%
58.9% Brazilian
37.9 - Foreign
3.2% - Individual
Free float 20,480,600
Free float Controlling shareholder
Total 50,480,600 -
Market-making activities (through broker XP Investimentos) since October/10
Listed since July 2007
Market-making activities (through broker XP Investimentos) since October/10
373737(*) Position as of 3/21/2013
Financial Performance
3838
Gross Revenue – R$ million
RENTAL REVENUE BREAKDOWN - 4Q12
TOTAL GROSS REVENUE
61.5
15.7%
3.7%
8.8%
9.4
15.0
43.3 59.6%
42.1%
71.8%
Minimum Rent Percentage on Sales
33.9
46.5
37.2%
SERVICES REVENUE BREAKDOWN 4Q12
g
Key Money Advertising
4Q11 4Q12
Rent Services
SERVICES REVENUE BREAKDOWN - 4Q12
8.4%
7.8%
72.1%
11.7%
393939
Parking Energy Water Management
Gross Revenue – R$ million
RENTAL REVENUE BREAKDOWN - 2012
12.0%
4.3%
7.2%
TOTAL GROSS REVENUE
196.133.3%
76.5%
31.8
45.5
147.1
43.1%
Minimum Rent Percentage on Sales
Key Money Advertising
SERVICES REVENUE BREAKDOWN - 2012
115.3
150.630.5%
SERVICES REVENUE BREAKDOWN 2012
9.5%
7.6%
2011 2012
Rent Services
71.3%
11.6%
Rent Services
404040
Parking Energy Water Management
Performance
Description 4Q11 4Q12 Chg % 2011 2012 Chg %
2
GSB (Total)
Average GLA (m2
) 198,893 255,073 28.2% 193,468 230,710 19.3%
Rent (R$/m2
) 170.34 182.29 7.0% 596.12 652.57 9.5%
Services (R$/m2
) 47.19 58.74 24.5% 164.51 197.47 20.0%
2
Total (R$/m2
) 217.53 241.03 10.8% 760.63 850.04 11.8%
414141
Occupancy Rate
Occupancy Rate Performance
96.7% 96.7%
96.6%
96.5%
4Q11 4Q12 2011 2012
424242
Services Revenue – R$ million
4thQuarter Year
Parking Energy Water Management Total
2011 25.0 4.2 1.4 1.2 31.8
2012 32.5 5.3 4.2 3.5 45.5
Parking Energy Water Management Total
4Q11 7.7 1.1 0.3 0.3 9.4
4Q12 10.8 1.8 1.2 1.2 15.0
434343
Performance Indicators – R$ million
72.8% 68.3%
Adjusted EBITDA and Margin
88.9% 85.5%
NOI Consolidated and Margin
38 7
35.0% 31.5%
29.5
38.7
35.9
48.5
Adjusted Net Result Adjusted FFO
4Q11 4Q124Q11 4Q12
-0.9
-5.3
-8.1 -3.5
444444
4Q11 4Q12 4Q11 4Q12
Performance Indicators – R$ million
71.8% 69.1%
Adjusted EBITDA and Margin
88.3% 87.1%
NOI Consolidated and Margin
125 9158 9
31.0% 27.7%
98.6
125.9
121.3
158.9
Adjusted Net Result Adjusted FFO
2011 20122011 2012
-37 3
-24.9
37.3
-88.6
-72.5
4545452011 2012 2011 2012
Cash X Debt (R$ million)
AMORTIZATION SCHEDULE
1 374 0
Cash X Debt
798.0
1,374.0
344.4
23.7
19 1 19 0 14 9 8 1
20.6
798.0
344.4
117.6
34.6 39.4 45.0 51.2 47.4 25.0 18.3 16.0 21.4
27.3
19.1 19.0 14.9 8.1
8.1 7.9 7.9
3.5
2014 2015 2016 2017 2018 2019 2020 2021 After 2021
Cash CCI Banks Perpetual Bonds
2013Cash Debt
Indebtedness Breakdown
59.8%
Amortization Schedule
18.2%
14.8%
2013 2014 2015 2016 2017 2018 2019 2020 2021
After
2021
Total %
CCI 117.6 34.6 39.4 45.0 51.2 47.4 25.0 18.3 16.0 21.4 415.9      30.3%
Banks 23.7 27.3 19.1 19.0 14.9 8.1 8.1 7.9 7.9 3.5 139.5      10.2%
Perpetual Bonds 20.6 ‐ ‐ ‐ ‐ ‐ ‐ ‐ ‐ 798.0 818.6      59.5%
Amortization Schedule
464646
4.9%
1.4% 0.8% 0.1%
USD IPCA TR CDI TJLP SELIC FIXED
Total 161.9  61.9     58.5  64.0  66.1  55.5  33.1  26.2  23.9  822.9         1,374.0  100.0%
Cash X Debt (R$ million)
According to Rating Agencies' Criteria*
Cash X DebtIndebtedness Breakdown
1,221.0
54.7%
344.4
20.6%
16.6%
Cash Debt
5.5%
1.6% 0.9% 0.1%
USD IPCA TR CDI TJLP SELIC FIXED
474747*Considering 50% of the Subordinated Perpetual Bonds’ balance as Equity, amounting to R$ 153.1 million
Investment Properties- R$ million
Investment Properties
2,835.8 (2)
308.3 2,527.5 (1)
1,558.0 
969.5
(1) Total value of investment properties (malls in operation) according to the
Valuation Report of CB Richard Ellis on basis date 12/31/2012. The
average rate of discount to the cash flow was 8.99%
(2) Total value of investment properties and land value considering
Book Value Adjustment to Fair Value (Operational Assets) Construction in progress
(2) Total value of investment properties and land value, considering
construction in progress .
484848
Contacts
GSB INVESTOR RELATIONSGSB INVESTOR RELATIONS
Alessandro Poli Veronezi
IR Officer
Marcio SniokaMarcio Snioka
IR Superintendent
55 11 3159-510055 11 3159 5100
dri@generalshopping.com.br
www.generalshopping.com.br
494949

More Related Content

Viewers also liked

Cover page analysis
Cover page analysisCover page analysis
Cover page analysis
FaaizaFeroz
 
Presentation3
Presentation3Presentation3
Presentation3
isucktoes
 
alex & alison b-day
alex & alison b-dayalex & alison b-day
alex & alison b-day
Monika Kulon
 
actividad 2.2
actividad 2.2actividad 2.2
actividad 4 (resuelta)
actividad 4 (resuelta)actividad 4 (resuelta)
actividad 4 (resuelta)
cynthia lucero salas saldaña
 
SUNDAR P-RESuME
SUNDAR P-RESuMESUNDAR P-RESuME
SUNDAR P-RESuME
Sundar Syam
 
Juric v. Bergstraesser - NY Appellate Division 3rd Department
Juric v. Bergstraesser - NY Appellate Division 3rd DepartmentJuric v. Bergstraesser - NY Appellate Division 3rd Department
Juric v. Bergstraesser - NY Appellate Division 3rd Department
Damir Juric
 
PLAN_DE_ACTIVIDAD_FISICA_UFT
PLAN_DE_ACTIVIDAD_FISICA_UFTPLAN_DE_ACTIVIDAD_FISICA_UFT
PLAN_DE_ACTIVIDAD_FISICA_UFT
Anubis Gimenez
 
Une histoire à succès qui défie les normes – Yves Doyon
Une histoire à succès qui défie les normes – Yves Doyon Une histoire à succès qui défie les normes – Yves Doyon
Une histoire à succès qui défie les normes – Yves Doyon
Yves Doyon
 
PTPP4
PTPP4PTPP4
Charla informativa sobre movilidad para estudiantes de la Facultad de Económi...
Charla informativa sobre movilidad para estudiantes de la Facultad de Económi...Charla informativa sobre movilidad para estudiantes de la Facultad de Económi...
Charla informativa sobre movilidad para estudiantes de la Facultad de Económi...
Nombre Apellidos
 
WebVRことはじめ
WebVRことはじめWebVRことはじめ
WebVRことはじめ
Kazuya Hiruma
 
eFACiLiTY Maintenance Management System
eFACiLiTY Maintenance Management SystemeFACiLiTY Maintenance Management System
eFACiLiTY Maintenance Management System
eFACiLiTY - Enterprise Facilities Management Software
 

Viewers also liked (14)

Cover page analysis
Cover page analysisCover page analysis
Cover page analysis
 
Presentation3
Presentation3Presentation3
Presentation3
 
alex & alison b-day
alex & alison b-dayalex & alison b-day
alex & alison b-day
 
actividad 2.2
actividad 2.2actividad 2.2
actividad 2.2
 
actividad 4 (resuelta)
actividad 4 (resuelta)actividad 4 (resuelta)
actividad 4 (resuelta)
 
SUNDAR P-RESuME
SUNDAR P-RESuMESUNDAR P-RESuME
SUNDAR P-RESuME
 
Juric v. Bergstraesser - NY Appellate Division 3rd Department
Juric v. Bergstraesser - NY Appellate Division 3rd DepartmentJuric v. Bergstraesser - NY Appellate Division 3rd Department
Juric v. Bergstraesser - NY Appellate Division 3rd Department
 
PLAN_DE_ACTIVIDAD_FISICA_UFT
PLAN_DE_ACTIVIDAD_FISICA_UFTPLAN_DE_ACTIVIDAD_FISICA_UFT
PLAN_DE_ACTIVIDAD_FISICA_UFT
 
Une histoire à succès qui défie les normes – Yves Doyon
Une histoire à succès qui défie les normes – Yves Doyon Une histoire à succès qui défie les normes – Yves Doyon
Une histoire à succès qui défie les normes – Yves Doyon
 
Wordfes2013
Wordfes2013Wordfes2013
Wordfes2013
 
PTPP4
PTPP4PTPP4
PTPP4
 
Charla informativa sobre movilidad para estudiantes de la Facultad de Económi...
Charla informativa sobre movilidad para estudiantes de la Facultad de Económi...Charla informativa sobre movilidad para estudiantes de la Facultad de Económi...
Charla informativa sobre movilidad para estudiantes de la Facultad de Económi...
 
WebVRことはじめ
WebVRことはじめWebVRことはじめ
WebVRことはじめ
 
eFACiLiTY Maintenance Management System
eFACiLiTY Maintenance Management SystemeFACiLiTY Maintenance Management System
eFACiLiTY Maintenance Management System
 

Similar to Presentation - UBS Consumer & Retail

Bradesco BBI – 1st Brazil Investiment Forum
Bradesco BBI – 1st Brazil Investiment ForumBradesco BBI – 1st Brazil Investiment Forum
Bradesco BBI – 1st Brazil Investiment Forum
generalshoppingriweb
 
Analyst Meeting Presentation Dec/13
Analyst Meeting Presentation Dec/13Analyst Meeting Presentation Dec/13
Analyst Meeting Presentation Dec/13
generalshoppingriweb
 
BofAML – 2014 Emerging Markets Corporate Conference
BofAML – 2014 Emerging Markets Corporate ConferenceBofAML – 2014 Emerging Markets Corporate Conference
BofAML – 2014 Emerging Markets Corporate Conference
generalshoppingriweb
 
BofA Emerging Markets Corporate Conference Miami – Maio 2013 (em inglês)
BofA Emerging Markets Corporate Conference Miami – Maio 2013 (em inglês)BofA Emerging Markets Corporate Conference Miami – Maio 2013 (em inglês)
BofA Emerging Markets Corporate Conference Miami – Maio 2013 (em inglês)
generalshoppingriweb
 
Apresentação 2Q13 EN
Apresentação 2Q13 ENApresentação 2Q13 EN
Apresentação 2Q13 EN
generalshoppingriweb
 
Apresentação 3Q12 EN
Apresentação 3Q12 ENApresentação 3Q12 EN
Apresentação 3Q12 EN
generalshoppingriweb
 
Presentation - BofA-ML - Mar/13
Presentation - BofA-ML - Mar/13Presentation - BofA-ML - Mar/13
Presentation - BofA-ML - Mar/13
generalshoppingriweb
 
Apresentação 3Q11 EN
Apresentação 3Q11 ENApresentação 3Q11 EN
Apresentação 3Q11 EN
generalshoppingriweb
 
BTG Pactual Presentation - February 2012
BTG Pactual Presentation - February 2012BTG Pactual Presentation - February 2012
BTG Pactual Presentation - February 2012
generalshoppingriweb
 
Apresentação 2Q12 EN
Apresentação 2Q12 ENApresentação 2Q12 EN
Apresentação 2Q12 EN
generalshoppingriweb
 
Apresentação 1Q12 EN
Apresentação 1Q12 ENApresentação 1Q12 EN
Apresentação 1Q12 EN
generalshoppingriweb
 
135997
135997135997
Apresentação 4Q09 EN
Apresentação 4Q09 ENApresentação 4Q09 EN
Apresentação 4Q09 EN
generalshoppingriweb
 
Apresentação 1Q10 EN
Apresentação 1Q10 ENApresentação 1Q10 EN
Apresentação 1Q10 EN
generalshoppingriweb
 
Apresentação 4Q11 EN
Apresentação 4Q11 ENApresentação 4Q11 EN
Apresentação 4Q11 EN
generalshoppingriweb
 
Apresentação 2Q10 EN
Apresentação 2Q10 ENApresentação 2Q10 EN
Apresentação 2Q10 EN
generalshoppingriweb
 
Apresentacao 4 q08_finalv2
Apresentacao 4 q08_finalv2Apresentacao 4 q08_finalv2
Apresentacao 4 q08_finalv2
generalshoppingriweb
 
Apresentação 3Q10 EN
Apresentação 3Q10 ENApresentação 3Q10 EN
Apresentação 3Q10 EN
generalshoppingriweb
 
Apresentação 2Q14 EN
Apresentação 2Q14 ENApresentação 2Q14 EN
Apresentação 2Q14 EN
generalshoppingriweb
 
Apresentação 2Q11 EN
Apresentação 2Q11 ENApresentação 2Q11 EN
Apresentação 2Q11 EN
generalshoppingriweb
 

Similar to Presentation - UBS Consumer & Retail (20)

Bradesco BBI – 1st Brazil Investiment Forum
Bradesco BBI – 1st Brazil Investiment ForumBradesco BBI – 1st Brazil Investiment Forum
Bradesco BBI – 1st Brazil Investiment Forum
 
Analyst Meeting Presentation Dec/13
Analyst Meeting Presentation Dec/13Analyst Meeting Presentation Dec/13
Analyst Meeting Presentation Dec/13
 
BofAML – 2014 Emerging Markets Corporate Conference
BofAML – 2014 Emerging Markets Corporate ConferenceBofAML – 2014 Emerging Markets Corporate Conference
BofAML – 2014 Emerging Markets Corporate Conference
 
BofA Emerging Markets Corporate Conference Miami – Maio 2013 (em inglês)
BofA Emerging Markets Corporate Conference Miami – Maio 2013 (em inglês)BofA Emerging Markets Corporate Conference Miami – Maio 2013 (em inglês)
BofA Emerging Markets Corporate Conference Miami – Maio 2013 (em inglês)
 
Apresentação 2Q13 EN
Apresentação 2Q13 ENApresentação 2Q13 EN
Apresentação 2Q13 EN
 
Apresentação 3Q12 EN
Apresentação 3Q12 ENApresentação 3Q12 EN
Apresentação 3Q12 EN
 
Presentation - BofA-ML - Mar/13
Presentation - BofA-ML - Mar/13Presentation - BofA-ML - Mar/13
Presentation - BofA-ML - Mar/13
 
Apresentação 3Q11 EN
Apresentação 3Q11 ENApresentação 3Q11 EN
Apresentação 3Q11 EN
 
BTG Pactual Presentation - February 2012
BTG Pactual Presentation - February 2012BTG Pactual Presentation - February 2012
BTG Pactual Presentation - February 2012
 
Apresentação 2Q12 EN
Apresentação 2Q12 ENApresentação 2Q12 EN
Apresentação 2Q12 EN
 
Apresentação 1Q12 EN
Apresentação 1Q12 ENApresentação 1Q12 EN
Apresentação 1Q12 EN
 
135997
135997135997
135997
 
Apresentação 4Q09 EN
Apresentação 4Q09 ENApresentação 4Q09 EN
Apresentação 4Q09 EN
 
Apresentação 1Q10 EN
Apresentação 1Q10 ENApresentação 1Q10 EN
Apresentação 1Q10 EN
 
Apresentação 4Q11 EN
Apresentação 4Q11 ENApresentação 4Q11 EN
Apresentação 4Q11 EN
 
Apresentação 2Q10 EN
Apresentação 2Q10 ENApresentação 2Q10 EN
Apresentação 2Q10 EN
 
Apresentacao 4 q08_finalv2
Apresentacao 4 q08_finalv2Apresentacao 4 q08_finalv2
Apresentacao 4 q08_finalv2
 
Apresentação 3Q10 EN
Apresentação 3Q10 ENApresentação 3Q10 EN
Apresentação 3Q10 EN
 
Apresentação 2Q14 EN
Apresentação 2Q14 ENApresentação 2Q14 EN
Apresentação 2Q14 EN
 
Apresentação 2Q11 EN
Apresentação 2Q11 ENApresentação 2Q11 EN
Apresentação 2Q11 EN
 

More from generalshoppingriweb

Analyst Meeting Presentation – Mar/10
Analyst Meeting Presentation – Mar/10Analyst Meeting Presentation – Mar/10
Analyst Meeting Presentation – Mar/10
generalshoppingriweb
 
Analyst Meeting Presentation – Mar/10
Analyst Meeting Presentation – Mar/10Analyst Meeting Presentation – Mar/10
Analyst Meeting Presentation – Mar/10
generalshoppingriweb
 
Apresentação APIMEC-SP - Dez/10
Apresentação APIMEC-SP - Dez/10Apresentação APIMEC-SP - Dez/10
Apresentação APIMEC-SP - Dez/10
generalshoppingriweb
 
Apresentação APIMEC-SP - Dez/07
Apresentação APIMEC-SP - Dez/07Apresentação APIMEC-SP - Dez/07
Apresentação APIMEC-SP - Dez/07
generalshoppingriweb
 
Analyst Meeting Presentation – Dec/07
Analyst Meeting Presentation – Dec/07Analyst Meeting Presentation – Dec/07
Analyst Meeting Presentation – Dec/07
generalshoppingriweb
 
Apresentação APIMEC-SP - Dez/08
Apresentação APIMEC-SP - Dez/08Apresentação APIMEC-SP - Dez/08
Apresentação APIMEC-SP - Dez/08
generalshoppingriweb
 
Apresentação APIMEC-SP - Dez/09
Apresentação APIMEC-SP - Dez/09Apresentação APIMEC-SP - Dez/09
Apresentação APIMEC-SP - Dez/09
generalshoppingriweb
 
Apresentação APIMEC-SP - Dez/11
Apresentação APIMEC-SP - Dez/11Apresentação APIMEC-SP - Dez/11
Apresentação APIMEC-SP - Dez/11
generalshoppingriweb
 
Apresentação APIMEC-SP - Dez/12
Apresentação APIMEC-SP - Dez/12Apresentação APIMEC-SP - Dez/12
Apresentação APIMEC-SP - Dez/12
generalshoppingriweb
 
Apresentação APIMEC-SP - Dez/13
Apresentação APIMEC-SP - Dez/13Apresentação APIMEC-SP - Dez/13
Apresentação APIMEC-SP - Dez/13
generalshoppingriweb
 
Apresentação APIMEC-SP - Dez/14
Apresentação APIMEC-SP - Dez/14Apresentação APIMEC-SP - Dez/14
Apresentação APIMEC-SP - Dez/14
generalshoppingriweb
 
Apresentação Institucional - Junho 2008
Apresentação Institucional - Junho 2008Apresentação Institucional - Junho 2008
Apresentação Institucional - Junho 2008
generalshoppingriweb
 
Apresentação Bradesco Out/08
Apresentação Bradesco Out/08Apresentação Bradesco Out/08
Apresentação Bradesco Out/08
generalshoppingriweb
 
Apresentação Institucional - Março 2009
Apresentação Institucional - Março 2009Apresentação Institucional - Março 2009
Apresentação Institucional - Março 2009
generalshoppingriweb
 
Apresentação Institucional - Setembro 2009
Apresentação Institucional - Setembro 2009Apresentação Institucional - Setembro 2009
Apresentação Institucional - Setembro 2009
generalshoppingriweb
 
Apresentação BofA-ML - Março 2010 (em inglês)
Apresentação BofA-ML - Março 2010 (em inglês)Apresentação BofA-ML - Março 2010 (em inglês)
Apresentação BofA-ML - Março 2010 (em inglês)
generalshoppingriweb
 
Apresentação BTG Pactual XIV CEO Conference (em inglês)
Apresentação BTG Pactual XIV CEO Conference (em inglês)Apresentação BTG Pactual XIV CEO Conference (em inglês)
Apresentação BTG Pactual XIV CEO Conference (em inglês)
generalshoppingriweb
 
Apresentação - Bradesco BBI - Malls e Commercial Properties
Apresentação - Bradesco BBI - Malls e Commercial PropertiesApresentação - Bradesco BBI - Malls e Commercial Properties
Apresentação - Bradesco BBI - Malls e Commercial Properties
generalshoppingriweb
 
Apresentação 2Q07 EN
Apresentação 2Q07 ENApresentação 2Q07 EN
Apresentação 2Q07 EN
generalshoppingriweb
 
Apresentação 2T07 PT
Apresentação 2T07 PTApresentação 2T07 PT
Apresentação 2T07 PT
generalshoppingriweb
 

More from generalshoppingriweb (20)

Analyst Meeting Presentation – Mar/10
Analyst Meeting Presentation – Mar/10Analyst Meeting Presentation – Mar/10
Analyst Meeting Presentation – Mar/10
 
Analyst Meeting Presentation – Mar/10
Analyst Meeting Presentation – Mar/10Analyst Meeting Presentation – Mar/10
Analyst Meeting Presentation – Mar/10
 
Apresentação APIMEC-SP - Dez/10
Apresentação APIMEC-SP - Dez/10Apresentação APIMEC-SP - Dez/10
Apresentação APIMEC-SP - Dez/10
 
Apresentação APIMEC-SP - Dez/07
Apresentação APIMEC-SP - Dez/07Apresentação APIMEC-SP - Dez/07
Apresentação APIMEC-SP - Dez/07
 
Analyst Meeting Presentation – Dec/07
Analyst Meeting Presentation – Dec/07Analyst Meeting Presentation – Dec/07
Analyst Meeting Presentation – Dec/07
 
Apresentação APIMEC-SP - Dez/08
Apresentação APIMEC-SP - Dez/08Apresentação APIMEC-SP - Dez/08
Apresentação APIMEC-SP - Dez/08
 
Apresentação APIMEC-SP - Dez/09
Apresentação APIMEC-SP - Dez/09Apresentação APIMEC-SP - Dez/09
Apresentação APIMEC-SP - Dez/09
 
Apresentação APIMEC-SP - Dez/11
Apresentação APIMEC-SP - Dez/11Apresentação APIMEC-SP - Dez/11
Apresentação APIMEC-SP - Dez/11
 
Apresentação APIMEC-SP - Dez/12
Apresentação APIMEC-SP - Dez/12Apresentação APIMEC-SP - Dez/12
Apresentação APIMEC-SP - Dez/12
 
Apresentação APIMEC-SP - Dez/13
Apresentação APIMEC-SP - Dez/13Apresentação APIMEC-SP - Dez/13
Apresentação APIMEC-SP - Dez/13
 
Apresentação APIMEC-SP - Dez/14
Apresentação APIMEC-SP - Dez/14Apresentação APIMEC-SP - Dez/14
Apresentação APIMEC-SP - Dez/14
 
Apresentação Institucional - Junho 2008
Apresentação Institucional - Junho 2008Apresentação Institucional - Junho 2008
Apresentação Institucional - Junho 2008
 
Apresentação Bradesco Out/08
Apresentação Bradesco Out/08Apresentação Bradesco Out/08
Apresentação Bradesco Out/08
 
Apresentação Institucional - Março 2009
Apresentação Institucional - Março 2009Apresentação Institucional - Março 2009
Apresentação Institucional - Março 2009
 
Apresentação Institucional - Setembro 2009
Apresentação Institucional - Setembro 2009Apresentação Institucional - Setembro 2009
Apresentação Institucional - Setembro 2009
 
Apresentação BofA-ML - Março 2010 (em inglês)
Apresentação BofA-ML - Março 2010 (em inglês)Apresentação BofA-ML - Março 2010 (em inglês)
Apresentação BofA-ML - Março 2010 (em inglês)
 
Apresentação BTG Pactual XIV CEO Conference (em inglês)
Apresentação BTG Pactual XIV CEO Conference (em inglês)Apresentação BTG Pactual XIV CEO Conference (em inglês)
Apresentação BTG Pactual XIV CEO Conference (em inglês)
 
Apresentação - Bradesco BBI - Malls e Commercial Properties
Apresentação - Bradesco BBI - Malls e Commercial PropertiesApresentação - Bradesco BBI - Malls e Commercial Properties
Apresentação - Bradesco BBI - Malls e Commercial Properties
 
Apresentação 2Q07 EN
Apresentação 2Q07 ENApresentação 2Q07 EN
Apresentação 2Q07 EN
 
Apresentação 2T07 PT
Apresentação 2T07 PTApresentação 2T07 PT
Apresentação 2T07 PT
 

Recently uploaded

Independent Study - College of Wooster Research (2023-2024)
Independent Study - College of Wooster Research (2023-2024)Independent Study - College of Wooster Research (2023-2024)
Independent Study - College of Wooster Research (2023-2024)
AntoniaOwensDetwiler
 
2. Elemental Economics - Mineral demand.pdf
2. Elemental Economics - Mineral demand.pdf2. Elemental Economics - Mineral demand.pdf
2. Elemental Economics - Mineral demand.pdf
Neal Brewster
 
Introduction to Value Added Tax System.ppt
Introduction to Value Added Tax System.pptIntroduction to Value Added Tax System.ppt
Introduction to Value Added Tax System.ppt
VishnuVenugopal84
 
一比一原版(GWU,GW毕业证)加利福尼亚大学|尔湾分校毕业证如何办理
一比一原版(GWU,GW毕业证)加利福尼亚大学|尔湾分校毕业证如何办理一比一原版(GWU,GW毕业证)加利福尼亚大学|尔湾分校毕业证如何办理
一比一原版(GWU,GW毕业证)加利福尼亚大学|尔湾分校毕业证如何办理
obyzuk
 
Tdasx: Unveiling the Trillion-Dollar Potential of Bitcoin DeFi
Tdasx: Unveiling the Trillion-Dollar Potential of Bitcoin DeFiTdasx: Unveiling the Trillion-Dollar Potential of Bitcoin DeFi
Tdasx: Unveiling the Trillion-Dollar Potential of Bitcoin DeFi
nimaruinazawa258
 
The Rise of Generative AI in Finance: Reshaping the Industry with Synthetic Data
The Rise of Generative AI in Finance: Reshaping the Industry with Synthetic DataThe Rise of Generative AI in Finance: Reshaping the Industry with Synthetic Data
The Rise of Generative AI in Finance: Reshaping the Industry with Synthetic Data
Champak Jhagmag
 
Solution Manual For Financial Accounting, 8th Canadian Edition 2024, by Libby...
Solution Manual For Financial Accounting, 8th Canadian Edition 2024, by Libby...Solution Manual For Financial Accounting, 8th Canadian Edition 2024, by Libby...
Solution Manual For Financial Accounting, 8th Canadian Edition 2024, by Libby...
Donc Test
 
Donald Trump Presentation and his life.pptx
Donald Trump Presentation and his life.pptxDonald Trump Presentation and his life.pptx
Donald Trump Presentation and his life.pptx
SerdarHudaykuliyew
 
Instant Issue Debit Cards - High School Spirit
Instant Issue Debit Cards - High School SpiritInstant Issue Debit Cards - High School Spirit
Instant Issue Debit Cards - High School Spirit
egoetzinger
 
Eco-Innovations and Firm Heterogeneity. Evidence from Italian Family and Nonf...
Eco-Innovations and Firm Heterogeneity.Evidence from Italian Family and Nonf...Eco-Innovations and Firm Heterogeneity.Evidence from Italian Family and Nonf...
Eco-Innovations and Firm Heterogeneity. Evidence from Italian Family and Nonf...
University of Calabria
 
Pensions and housing - Pensions PlayPen - 4 June 2024 v3 (1).pdf
Pensions and housing - Pensions PlayPen - 4 June 2024 v3 (1).pdfPensions and housing - Pensions PlayPen - 4 June 2024 v3 (1).pdf
Pensions and housing - Pensions PlayPen - 4 June 2024 v3 (1).pdf
Henry Tapper
 
Instant Issue Debit Cards - School Designs
Instant Issue Debit Cards - School DesignsInstant Issue Debit Cards - School Designs
Instant Issue Debit Cards - School Designs
egoetzinger
 
5 Tips for Creating Standard Financial Reports
5 Tips for Creating Standard Financial Reports5 Tips for Creating Standard Financial Reports
5 Tips for Creating Standard Financial Reports
EasyReports
 
^%$Zone1:+971)581248768’][* Legit & Safe #Abortion #Pills #For #Sale In #Duba...
^%$Zone1:+971)581248768’][* Legit & Safe #Abortion #Pills #For #Sale In #Duba...^%$Zone1:+971)581248768’][* Legit & Safe #Abortion #Pills #For #Sale In #Duba...
^%$Zone1:+971)581248768’][* Legit & Safe #Abortion #Pills #For #Sale In #Duba...
mayaclinic18
 
Financial Assets: Debit vs Equity Securities.pptx
Financial Assets: Debit vs Equity Securities.pptxFinancial Assets: Debit vs Equity Securities.pptx
Financial Assets: Debit vs Equity Securities.pptx
Writo-Finance
 
一比一原版(IC毕业证)帝国理工大学毕业证如何办理
一比一原版(IC毕业证)帝国理工大学毕业证如何办理一比一原版(IC毕业证)帝国理工大学毕业证如何办理
一比一原版(IC毕业证)帝国理工大学毕业证如何办理
conose1
 
Who Is the Largest Producer of Soybean in India Now.pdf
Who Is the Largest Producer of Soybean in India Now.pdfWho Is the Largest Producer of Soybean in India Now.pdf
Who Is the Largest Producer of Soybean in India Now.pdf
Price Vision
 
BONKMILLON Unleashes Its Bonkers Potential on Solana.pdf
BONKMILLON Unleashes Its Bonkers Potential on Solana.pdfBONKMILLON Unleashes Its Bonkers Potential on Solana.pdf
BONKMILLON Unleashes Its Bonkers Potential on Solana.pdf
coingabbar
 
How Non-Banking Financial Companies Empower Startups With Venture Debt Financing
How Non-Banking Financial Companies Empower Startups With Venture Debt FinancingHow Non-Banking Financial Companies Empower Startups With Venture Debt Financing
How Non-Banking Financial Companies Empower Startups With Venture Debt Financing
Vighnesh Shashtri
 
Seminar: Gender Board Diversity through Ownership Networks
Seminar: Gender Board Diversity through Ownership NetworksSeminar: Gender Board Diversity through Ownership Networks
Seminar: Gender Board Diversity through Ownership Networks
GRAPE
 

Recently uploaded (20)

Independent Study - College of Wooster Research (2023-2024)
Independent Study - College of Wooster Research (2023-2024)Independent Study - College of Wooster Research (2023-2024)
Independent Study - College of Wooster Research (2023-2024)
 
2. Elemental Economics - Mineral demand.pdf
2. Elemental Economics - Mineral demand.pdf2. Elemental Economics - Mineral demand.pdf
2. Elemental Economics - Mineral demand.pdf
 
Introduction to Value Added Tax System.ppt
Introduction to Value Added Tax System.pptIntroduction to Value Added Tax System.ppt
Introduction to Value Added Tax System.ppt
 
一比一原版(GWU,GW毕业证)加利福尼亚大学|尔湾分校毕业证如何办理
一比一原版(GWU,GW毕业证)加利福尼亚大学|尔湾分校毕业证如何办理一比一原版(GWU,GW毕业证)加利福尼亚大学|尔湾分校毕业证如何办理
一比一原版(GWU,GW毕业证)加利福尼亚大学|尔湾分校毕业证如何办理
 
Tdasx: Unveiling the Trillion-Dollar Potential of Bitcoin DeFi
Tdasx: Unveiling the Trillion-Dollar Potential of Bitcoin DeFiTdasx: Unveiling the Trillion-Dollar Potential of Bitcoin DeFi
Tdasx: Unveiling the Trillion-Dollar Potential of Bitcoin DeFi
 
The Rise of Generative AI in Finance: Reshaping the Industry with Synthetic Data
The Rise of Generative AI in Finance: Reshaping the Industry with Synthetic DataThe Rise of Generative AI in Finance: Reshaping the Industry with Synthetic Data
The Rise of Generative AI in Finance: Reshaping the Industry with Synthetic Data
 
Solution Manual For Financial Accounting, 8th Canadian Edition 2024, by Libby...
Solution Manual For Financial Accounting, 8th Canadian Edition 2024, by Libby...Solution Manual For Financial Accounting, 8th Canadian Edition 2024, by Libby...
Solution Manual For Financial Accounting, 8th Canadian Edition 2024, by Libby...
 
Donald Trump Presentation and his life.pptx
Donald Trump Presentation and his life.pptxDonald Trump Presentation and his life.pptx
Donald Trump Presentation and his life.pptx
 
Instant Issue Debit Cards - High School Spirit
Instant Issue Debit Cards - High School SpiritInstant Issue Debit Cards - High School Spirit
Instant Issue Debit Cards - High School Spirit
 
Eco-Innovations and Firm Heterogeneity. Evidence from Italian Family and Nonf...
Eco-Innovations and Firm Heterogeneity.Evidence from Italian Family and Nonf...Eco-Innovations and Firm Heterogeneity.Evidence from Italian Family and Nonf...
Eco-Innovations and Firm Heterogeneity. Evidence from Italian Family and Nonf...
 
Pensions and housing - Pensions PlayPen - 4 June 2024 v3 (1).pdf
Pensions and housing - Pensions PlayPen - 4 June 2024 v3 (1).pdfPensions and housing - Pensions PlayPen - 4 June 2024 v3 (1).pdf
Pensions and housing - Pensions PlayPen - 4 June 2024 v3 (1).pdf
 
Instant Issue Debit Cards - School Designs
Instant Issue Debit Cards - School DesignsInstant Issue Debit Cards - School Designs
Instant Issue Debit Cards - School Designs
 
5 Tips for Creating Standard Financial Reports
5 Tips for Creating Standard Financial Reports5 Tips for Creating Standard Financial Reports
5 Tips for Creating Standard Financial Reports
 
^%$Zone1:+971)581248768’][* Legit & Safe #Abortion #Pills #For #Sale In #Duba...
^%$Zone1:+971)581248768’][* Legit & Safe #Abortion #Pills #For #Sale In #Duba...^%$Zone1:+971)581248768’][* Legit & Safe #Abortion #Pills #For #Sale In #Duba...
^%$Zone1:+971)581248768’][* Legit & Safe #Abortion #Pills #For #Sale In #Duba...
 
Financial Assets: Debit vs Equity Securities.pptx
Financial Assets: Debit vs Equity Securities.pptxFinancial Assets: Debit vs Equity Securities.pptx
Financial Assets: Debit vs Equity Securities.pptx
 
一比一原版(IC毕业证)帝国理工大学毕业证如何办理
一比一原版(IC毕业证)帝国理工大学毕业证如何办理一比一原版(IC毕业证)帝国理工大学毕业证如何办理
一比一原版(IC毕业证)帝国理工大学毕业证如何办理
 
Who Is the Largest Producer of Soybean in India Now.pdf
Who Is the Largest Producer of Soybean in India Now.pdfWho Is the Largest Producer of Soybean in India Now.pdf
Who Is the Largest Producer of Soybean in India Now.pdf
 
BONKMILLON Unleashes Its Bonkers Potential on Solana.pdf
BONKMILLON Unleashes Its Bonkers Potential on Solana.pdfBONKMILLON Unleashes Its Bonkers Potential on Solana.pdf
BONKMILLON Unleashes Its Bonkers Potential on Solana.pdf
 
How Non-Banking Financial Companies Empower Startups With Venture Debt Financing
How Non-Banking Financial Companies Empower Startups With Venture Debt FinancingHow Non-Banking Financial Companies Empower Startups With Venture Debt Financing
How Non-Banking Financial Companies Empower Startups With Venture Debt Financing
 
Seminar: Gender Board Diversity through Ownership Networks
Seminar: Gender Board Diversity through Ownership NetworksSeminar: Gender Board Diversity through Ownership Networks
Seminar: Gender Board Diversity through Ownership Networks
 

Presentation - UBS Consumer & Retail

  • 1. UBS Consumer & Retail 11 UBS Consumer & Retail São Paulo –April 2013
  • 2. Disclaimer This presentation contains statements that are forward-looking within the meaning of Section 27A of the Securities Act of 1933 and Section 21E of the Securities Exchange Act of 1934. Such forward-lookingg g statements are only predictions and are not guarantees of future performance. Investors are cautioned that any such forward-looking statements are and will be, as the case may be, subject to many risks, uncertainties and factors relating to the operations and business environments of General Shopping and its subsidiaries that may cause the actual results of the companies to be materially different from any future results expressed or implied in such forward-looking statements. This material is published solely for informational purposes and is not to be construed as a solicitation or an offer to buy or sell any securities or related financial instruments and should not be treated as giving investment advice It is not targeted to the specific investment objectives financial situation orinvestment advice. It is not targeted to the specific investment objectives, financial situation or particular needs of any recipient. No representation or warranty, either express or implied, is provided in relation to the accuracy, completeness or reliability of the information contained herein. This material should not be regarded by recipients as a substitute for the exercise of their own judgment. Any opinions expressed in this material are expressed as of this date and subject to change without notice and General Shopping is not under the obligation to update or keep current the information contained herein. General Shopping and the respective affiliates, directors, partners and employees accept no liability whatsoever for any loss or damage of any kind arising out of the use of all or any partp y y g y g y p of this material. You should consult with your own legal, regulatory, tax, business, investment, financial and accounting advisers to the extent that you deem it necessary, and make your own investment, hedging and trading decision (including decisions regarding the suitability of this transaction) based upon your own judgment and advice from such advisers as you deem necessary and not upon any 222 views expressed in this material.
  • 3. Agenda Sector Overview Company OverviewCompany Overview Financial Performance 333
  • 5. Economic Indicators Unemployment Rate in January 11 7% Unemployment Rate in January 11.7% 10.2% 9.3% 9.3% 8.0% 8.2% 7.2% 6.1% 5 5% 5 4%5.5% 5.4% 555 Jan/04 Jan/05 Jan/06 Jan/07 Jan/08 Jan/09 Jan/10 Jan/11 Jan/12 Jan/13 Source: PME-IBGE Table prepared by General Shopping Brasil
  • 6. Economic Indicators Real Income of the Employed Population¹ 36 7 38.8 R$ billion 30.4 31.9 32.6 35.2 36.7 23.7 24.9 26.1 28.0 Jan/04 Jan/05 Jan/06 Jan/07 Jan/08 Jan/09 Jan/10 Jan/11 Jan/12 Jan/13 666 Jan/04 Jan/05 Jan/06 Jan/07 Jan/08 Jan/09 Jan/10 Jan/11 Jan/12 Jan/13 Source: PME-IBGE; Table prepared by General Shopping Brasil (1)Based on the employed population and their average income
  • 7. Credit Performance Credit Volume – Individuals Volume and Monthly Change 660 690 720 750 24% 26% (t-12) R$ billion 540 570 600 630 660 20% 22% 420 450 480 510 14% 16% 18% 300 330 360 390 10% 12% 777 Source: Central Bank Table prepared by General Shopping Brasil
  • 8. Credit Performance Default Rate Individuals and General 8.0 7.7 7.4 7.9 General Individuals 5.7 888 Source: Central Bank Table prepared by General Shopping Brasil
  • 9. Economic Indicators Consumer Confidence Index Index - Quarterly Moving Average 125 130 110 115 120 95 100 105 80 85 90 999 Source: Fundação Getulio Vargas - FGV Table prepared by General Shopping Brasil
  • 10. Retail Performance Sales Volume - Monthly change (%) As compared with same year-ago period 10.4 8.3 7.8 6.0 5.9 101010 Source: PMC-IBGE Table prepared by General Shopping Brasil
  • 11. Retail Growth 15 25 35 45 Retail Industry: Monthly Change (VS Same Year-Ago Period) of Sales Volume (Jan/11-Jan/13) Total ‐ Retail Books, newspapers, magazines and  stationery Office supplies and equipment,  personal  computer and telecom Other personal and domestic products ‐25 ‐15 ‐5 5 15 y p Jan‐11 8.3 12.5 7.4 4.9 Feb‐11 8.5 14.9 14.8 12.5 Mar‐11 4.0 ‐1.2 4.2 4.6 Apr‐11 10.2 5.8 ‐0.8 12.1 May‐11 6.3 8.3 23.2 3.3 Jun‐11 7.1 9.0 34.7 3.2 Jul‐11 7.1 6.8 16.2 2.9 Aug‐11 6.3 5.2 26.3 1.7 Sep‐11 5.2 2.7 7.6 ‐0.1 Oct‐11 4.2 4.4 28.8 0.5 Nov‐11 6.7 5.5 24.7 2.6Nov 11 6.7 5.5 24.7 2.6 Dec‐11 6.7 ‐2.3 34.8 3.4 Jan‐12 7.8 9.8 32.9 13.1 Feb‐12 10.6 ‐0.2 33.5 5.0 Mar‐12 12.5 4.9 27.3 9.5 Apr‐12 6.0 ‐4.0 33.2 2.6 May‐12 8.3 2.0 17.2 8.2 Jun‐12 9.4 9.5 ‐18.5 6.6 Jul‐12 7.2 6.3 11.3 6.4 Aug‐12 10.0 4.8 11.1 10.6 Sep‐12 8.5 4.1 ‐0.4 7.5 Oct 12 9 2 11 1 16 1 13 6 111111 Oct‐12 9.2 11.1 16.1 13.6 Nov‐12 8.5 11.2 ‐0.8 18.5 Dec‐12 5.1 4.9 ‐23.3 10.0 Jan‐13 5.9 5.4 8.8 13.9 Source: Brazilian Institute of Geography and Statistics (IBGE) Table prepared by General Shopping Brasil
  • 12. Retail Growth Retail Industry: Monthly Change (VS Same Year-Ago Period) of Sales Volume (Jan/11-Jan/13) 15 20 25 Total ‐ Retail Supermarkets and hypermarkets Fabrics, clothing and footwear Furniture and white/durable  goods Pharmaceutical, medical,  orthopedic and cosmetics ‐5 0 5 10 goods orthopedic and cosmetics Jan‐11 8.3 4.2 9.8 19.1 12.7 Feb‐11 8.5 2.7 14.2 20.3 10.6 Mar‐11 4.0 1.4 5.7 11.2 5.3 Apr‐11 10.2 10.6 1.5 19.3 10.5 May‐11 6.3 1.9 5.6 20.4 12.0 Jun‐11 7.1 2.7 11.3 16.4 12.8 Jul‐11 7.1 4.6 1.4 21.1 10.4 Aug‐11 6.3 3.9 0.8 16.9 9.5 Sep‐11 5.2 3.5 0.7 16.0 10.9 Oct‐11 4.2 2.3 ‐2.2 13.1 7.5 Nov‐11 6 7 6 2 0 4 12 3 8 4Nov 11 6.7 6.2 0.4 12.3 8.4 Dec‐11 6.7 4.6 0.8 15.3 7.0 Jan‐12 7.8 8.5 1.5 13.2 8.6 Feb‐12 10.6 13.3 ‐3.2 13.5 9.5 Mar‐12 12.5 12.4 4.3 20.9 14.2 Apr‐12 6.0 3.6 ‐1.4 12.5 9.3 May‐12 8.3 8.8 4.0 9.3 12.3 Jun‐12 9.4 11.1 0.6 15.6 11.3 Jul‐12 7.2 5.0 5.7 12.6 11.4 Aug‐12 10.0 8.5 8.4 15.3 12.8 Sep‐12 8.5 9.9 5.4 6.2 8.2 Oct 12 9 2 6 6 4 5 13 8 13 0 121212 Source: Brazilian Institute of Geography and Statistics (IBGE) Table prepared by General Shopping Brasil Oct‐12 9.2 6.6 4.5 13.8 13.0 Nov‐12 8.5 8.3 6.5 8.5 9.6 Dec‐12 5.1 6.6 3.2 9.0 3.6 Jan‐13 5.9 3.4 5.0 5.8 10.4
  • 14. Differentials  Market-driven company with retail approach  B and C consumption classes as target market  Innovative complementary services  Majority ownership: 81.5% average interestj g 141414
  • 15. Shopping Center´s definitions  ICSC - “Is a group of retail stores, planned, developed and managed like an only one operation.”  ABRASCE – “ A planed group of retail stores with an integrated operation and centralized management and at least part of its rentalmanagement,…, and at least part of its rental revenues must be part of retail´s sales revenues.” 151515
  • 16. General Shopping Brasil Poli Shopping Guarulhos 50.0% 4,527 2,264 15,400 Internacional Shopping 100.0% 75,958 75,958 - Own GLA Expansion (m 2 ) Shopping Center Interest Total GLA (m²) Own GLA (m²) Auto Shopping 100.0% 11,477 11,477 - Shopping Light 85.0% 14,140 12,019 - Santana Parque Shopping 50.0% 26,538 13,269 - Suzano Shopping 100.0% 19,583 19,583 - Cascavel JL Shopping 85 5% 8 877 7 590 2 953Cascavel JL Shopping 85.5% 8,877 7,590 2,953 Top Center Shopping 100.0% 6,369 6,369 - Parque Shopping Prudente 100.0% 15,148 15,148 - Poli Shopping Osasco 100.0% 3,218 3,218 - Shopping do Vale 84.4% 16,487 13,913 -Shopping do Vale 84.4% 16,487 13,913 Unimart Shopping Campinas 100.0% 14,961 14,961 - Outlet Premium São Paulo 50.0% 17,716 8,858 - Parque Shopping Barueri 48.0% 37,420 17,962 - Outlet Premium Brasília 50.0% 16,094 8,047 - Shopping Bonsucesso 100.0% 24,437 24,437 - 81.5% 312,950 255,073 18,353 Greenfield Interest Total GLA (m²) Own GLA (m²) Parque Shopping Sulacap 51.0% 29,932 15,265 Outlet Premium Salvador* 98.0% 27,000 26,460 Outlet Premium Rio de Janeiro* 98.0% 32,000 31,360 Convention Center 100.0% 25,730 25,730 Sh i i 96 % 30 492 29 42 ( ) ( ) 161616 Parque Shopping Maia 96.5% 30,492 29,425 Parque Shopping Atibaia 100.0% 24,043 24,043 90.0% 169,197 152,283 (*) Company may sell up to 48% of the project to BR Partners Fund.
  • 17. Geographic Distribution Internacional Shopping Guarulhos Shopping Light Parque Shopping Prudente Auto Shopping 8 15,148Total GLA (m2) Total GLA (m2) 11,47775,958Total GLA (m2) 14,140Total GLA (m2) Top Center Shopping Shopping do Vale Cascavel JL Shopping Unimart Shopping CampinasOutlet Premium Rio de Janeiro Poli Shopping Guarulhos Poli Shopping Osasco Outlet Premium São Paulo Convention Center 16,487Total GLA (m2) 8,877Total GLA (m2)6,369Total GLA (m2) Outlet Premium Salvador 32,000(1)Total GLA (m2) 14,961Total GLA (m2) Parque Shopping Sulacap Greenfield Shopping in operation 25,730Total GLA (m2)4,527Total GLA (m2) 3,218Total GLA (m2) (1) 27,000 (1)Total GLA (m2) 29,932 (1)Total GLA (m2)17,716Total GLA (m2) Santana Parque Shopping Suzano Shopping Outlet Premium BrasíliaParque Shopping Maia Parque Shopping BarueriParque Shopping AtibaiaShopping Bonsucesso 171717 26,538Total GLA (m2) 19,583Total GLA (m2) 16,094Total GLA (m2) (1) Estimated Source: IBGE 2010 30,492 (1)Total GLA (m2) Region GDP Retail Mkt South + Southeast 72.6% 72.1% 24,437Total GLA (m2) (1) 24,043Total GLA (m2) 37,420Total GLA (m2)
  • 18. Geographic Distribution GDP(1) Number of Shopping Centers(2) 4% 13% 9% 5% 14% 9% R$ 202 billion R$ 508 billion R$ 351 billion 18 60 41 9% 56% 18% 9% 55% 17% R$ 2,088 billion R$ 622 billion Total GDP: R$ 3,770 billion Total Number of Shopping Centers: 455 254 82 Retail Sales(1) GLA(2) g R$ 74 billion R$ 314 billion R$ 181 billion 4% 15% 3% 15% 400,211 m² 1,660,728 m² 859,200 m²R$ 181 billion R$ 1,062 billion R$ 402 billion 9% 52% 20% 8% 59% 15% 859,200 m 6,586,741 m² 1,660,242 m² 181818 (1) Source: IBGE 2010 (2) Source: ABRASCE – December 2012 Total Retail Sales: R$ 2,033 billion Total GLA: 11,167,122 m²
  • 19. Total GLA (m2) 2012 201511,167,122 15,371,654 191919 Source: Alshop Directory, ABRASCE Directory and Companies Prepared by General Shopping Brasil
  • 20. Portfolio Total GLA Evolution (m2) 188,051 501,001 50,131 98,822 19,696 17,919 37,420Pre IPO 88,962 202020 Dec/06 Dec/07 Dec/08 Dec/09 Dec/11 Dec/12 Until Dec/2014 TOTAL GLA
  • 21. Diversified Growth Strategy Consolidation Own GLA(1) Own GLA(1)  Shopping center acquisitions Greenfields Concluded G fi ld Greenfields d D l t 31.9% 35 3%  Concept and development of new shopping centers Expansions Greenfieldsunder Development 23.9% 8.9% 35.3%Expansions  Interest stake increase in assets  GLA expansion of the original portfolio  Implementation of mixed use projects Acquisitions8.9% Implementation of mixed-use projects  Synergies + Profitability Turnaround Acquisitions Expansions Turnaround  Remodeling and retrofit of tenant mix  Innovation in complementary services 212121(1) Considering current shopping centers, expansions and announced greenfields.
  • 22. Case - Outlet Outlet Premium São Paulo Type: Greenfield Stake: 50% Influence area (inhabitants): super-regional O R t 98 0% ( t i ) 100 0% t dOccupancy Rate: 98.0% (at opening) - 100.0% today Description: First outlet of the country. Entrance for main brands with outlet operations Located on the highway which connects São Paulooutlet operations. Located on the highway which connects São Paulo capital to the Campinas metropolitan region. Power center comprising hotel and 2 theme parks. Initiative: Sales channel for remainder merchandise with occupancy costs suitable to the off-price operation 222222
  • 23. Outlet Premium São Paulo- Greenfield 232323
  • 24. Case - Outlet Outlet Premium Brasília Type: Greenfield Stake: 50% Influence area (inhabitants): super-regional Occupancy Rate: pre-tenanted 90.0% - today 97.0% Description: Second Outlet developed in the country. Located on the highway which connects Brasília (country capital) to Goiânia (Goiáshighway which connects Brasília (country capital) to Goiânia (Goiás state capital), the two biggest cities in midwestern states. 242424
  • 25. Outlet Premium Brasília - Greenfield 252525
  • 26. Case - Outlet Outlet Premium Salvador Type: Greenfield Stake: 98% Influence area (inhabitants): super-regional Description: Third Outlet in the country with forecast to open in 2013. Located next to Salvador, the biggest city in northeastern states, on the road to the tourism resortsthe road to the tourism resorts. 262626
  • 27. Outlet Premium Salvador - Greenfield 272727
  • 28. Unimart Shopping Campinas Unimart Shopping Campinaspp g p Type: Open Lifestyle Center Interest: 100% % of B and C consumption classes: 88% Public comprised (inhabitants): 277 thousand Description: Large potential for lifestyle center. Office and home b ildi d F i f d t fit l b dbuildings around. Focus on services, food courts, fitness club and leisure. Lower occupancy costs with higher rentals/m2. 282828
  • 29. Unimart Shopping Campinas – Lifestyle Case Before CompletedCompleted 292929
  • 30. Parque Shopping Prudente - Expansion Parque Shopping Prudente Type: NeighborhoodType: Neighborhood Interest: 100.0% % of B and C consumption classes: 84.0%% of B and C consumption classes: 84.0% Public comprised (inhabitants): 800 thousand 303030
  • 31. Parque Shopping Prudente - Expansion 313131
  • 32. Shopping Bonsucesso - Acquisition Shopping Bonsucesso Type: NeighborhoodType: Neighborhood Interest: 100.0% Total GLA: 24,437 m2Total GLA: 24,437 m Opening: 2006 Acquisition: 2012 Public comprised (inhabitants): 753 thousand 323232
  • 33. Shopping Bonsucesso - Acquisition 333333
  • 34. Increasing Complementary Services Activities Management Parking Water Energy ISG     Auto     Atlas Auto     Poli     Light    Stake Held R ibl f l i th Santana *    Cascavel     Suzano     Energy100% ► Responsible for planning the energy supply and leasing of the equipment for its transmission and distribution ► Engaged in water supply Cascavel     Prudente Parque     Poli Shopping Osasco   Wass I Park 100% 100% ► Engaged in water supply planning and its treatment and distribution ► Controls and manages Top Center   Do Vale     Unimart C i     I Park GSB Adm 100% 100% parking lots ► Manages operations of shopping centers Campinas     Outlet Premium São Paulo     Parque Shopping Barueri    ASG Adm100% pp g ► Manages the operations of Auto Shopping 343434 Outlet Premium Brasília     Services currently provided to the mall  Potential services / currently being implemented  * Partial Shopping Bonsucesso    
  • 35. Stock Performance Stock Performance (Basis 100 – DEC 31, 2008) R$ 12.40* 446.3%* 500 550 600 650 700 56,034* 49.2%*200 250 300 350 400 450 500 0 50 100 150 200 ec‐08 an‐09 eb‐09 ar‐09 pr‐09 ay‐09 un‐09 ul‐09 ug‐09 ep‐09 ct‐09 ov‐09 ec‐09 an‐10 eb‐10 ar‐10 pr‐10 ay‐10 un‐10 ul‐10 ug‐10 ep‐10 ct‐10 ov‐10 ec‐10 an‐11 eb‐11 ar‐11 pr‐11 ay‐11 un‐11 ul‐11 ug‐11 ep‐11 ct‐11 ov‐11 ec‐11 an‐12 eb‐12 ar‐12 pr‐12 ay‐12 un‐12 ul‐12 ug‐12 ep‐12 ct‐12 ov‐12 ec‐12 an‐13 eb‐13 ar‐13 De Ja Fe Ma Ap Ma Ju Ju Au Se Oc No De Ja Fe Ma Ap Ma Ju Ju Au Se Oc No De Ja Fe Ma Ap Ma Ju Ju Au Se Oc No De Ja Fe Ma Ap Ma Ju Ju Au Se Oc No De Ja Fe Ma GSHP3 Ibovespa 353535 (*) In MAR 27, 2013 Until DEC 28, 2012: GSHP3 = 370.0% Ibovespa = 62.3%
  • 36. Liquidity GSHP3 12,625  13,164  13,391  13,561 Volume (R$ thousand) 1 105 1,886  6,263  5,254  3,911  3,236  3,077  5,945  8,196  6,569  5,864  278,611  574  712  568  809  1,105  4,545  Hiring of new Market Maker XP I ti t 64,685  91,672  65,527  66,365  59,840 102,614  64,746  150,268  92,470  156,813  122,759  58,566 XP Investimentos 22,902  13,294  4,231  6,394  17,971  42,790  59,840  58,566  45,608  1Q08 2Q08 3Q08 4Q08 1Q09 2Q09 3Q09 4Q09 1Q10 2Q10 3Q10 4Q10 1Q11 2Q11 3Q11 4Q11 1Q12 2Q12 3Q12 4Q12 363636 Trading Volume Number of Trades
  • 37. Shareholders Nr. Shares Type of investor (*) 40.6% Nr. Shares Type of investor Controlling shareholder 30,000,000 - 58.9% - Brazilian 59.4% 58.9% Brazilian 37.9 - Foreign 3.2% - Individual Free float 20,480,600 Free float Controlling shareholder Total 50,480,600 - Market-making activities (through broker XP Investimentos) since October/10 Listed since July 2007 Market-making activities (through broker XP Investimentos) since October/10 373737(*) Position as of 3/21/2013
  • 39. Gross Revenue – R$ million RENTAL REVENUE BREAKDOWN - 4Q12 TOTAL GROSS REVENUE 61.5 15.7% 3.7% 8.8% 9.4 15.0 43.3 59.6% 42.1% 71.8% Minimum Rent Percentage on Sales 33.9 46.5 37.2% SERVICES REVENUE BREAKDOWN 4Q12 g Key Money Advertising 4Q11 4Q12 Rent Services SERVICES REVENUE BREAKDOWN - 4Q12 8.4% 7.8% 72.1% 11.7% 393939 Parking Energy Water Management
  • 40. Gross Revenue – R$ million RENTAL REVENUE BREAKDOWN - 2012 12.0% 4.3% 7.2% TOTAL GROSS REVENUE 196.133.3% 76.5% 31.8 45.5 147.1 43.1% Minimum Rent Percentage on Sales Key Money Advertising SERVICES REVENUE BREAKDOWN - 2012 115.3 150.630.5% SERVICES REVENUE BREAKDOWN 2012 9.5% 7.6% 2011 2012 Rent Services 71.3% 11.6% Rent Services 404040 Parking Energy Water Management
  • 41. Performance Description 4Q11 4Q12 Chg % 2011 2012 Chg % 2 GSB (Total) Average GLA (m2 ) 198,893 255,073 28.2% 193,468 230,710 19.3% Rent (R$/m2 ) 170.34 182.29 7.0% 596.12 652.57 9.5% Services (R$/m2 ) 47.19 58.74 24.5% 164.51 197.47 20.0% 2 Total (R$/m2 ) 217.53 241.03 10.8% 760.63 850.04 11.8% 414141
  • 42. Occupancy Rate Occupancy Rate Performance 96.7% 96.7% 96.6% 96.5% 4Q11 4Q12 2011 2012 424242
  • 43. Services Revenue – R$ million 4thQuarter Year Parking Energy Water Management Total 2011 25.0 4.2 1.4 1.2 31.8 2012 32.5 5.3 4.2 3.5 45.5 Parking Energy Water Management Total 4Q11 7.7 1.1 0.3 0.3 9.4 4Q12 10.8 1.8 1.2 1.2 15.0 434343
  • 44. Performance Indicators – R$ million 72.8% 68.3% Adjusted EBITDA and Margin 88.9% 85.5% NOI Consolidated and Margin 38 7 35.0% 31.5% 29.5 38.7 35.9 48.5 Adjusted Net Result Adjusted FFO 4Q11 4Q124Q11 4Q12 -0.9 -5.3 -8.1 -3.5 444444 4Q11 4Q12 4Q11 4Q12
  • 45. Performance Indicators – R$ million 71.8% 69.1% Adjusted EBITDA and Margin 88.3% 87.1% NOI Consolidated and Margin 125 9158 9 31.0% 27.7% 98.6 125.9 121.3 158.9 Adjusted Net Result Adjusted FFO 2011 20122011 2012 -37 3 -24.9 37.3 -88.6 -72.5 4545452011 2012 2011 2012
  • 46. Cash X Debt (R$ million) AMORTIZATION SCHEDULE 1 374 0 Cash X Debt 798.0 1,374.0 344.4 23.7 19 1 19 0 14 9 8 1 20.6 798.0 344.4 117.6 34.6 39.4 45.0 51.2 47.4 25.0 18.3 16.0 21.4 27.3 19.1 19.0 14.9 8.1 8.1 7.9 7.9 3.5 2014 2015 2016 2017 2018 2019 2020 2021 After 2021 Cash CCI Banks Perpetual Bonds 2013Cash Debt Indebtedness Breakdown 59.8% Amortization Schedule 18.2% 14.8% 2013 2014 2015 2016 2017 2018 2019 2020 2021 After 2021 Total % CCI 117.6 34.6 39.4 45.0 51.2 47.4 25.0 18.3 16.0 21.4 415.9      30.3% Banks 23.7 27.3 19.1 19.0 14.9 8.1 8.1 7.9 7.9 3.5 139.5      10.2% Perpetual Bonds 20.6 ‐ ‐ ‐ ‐ ‐ ‐ ‐ ‐ 798.0 818.6      59.5% Amortization Schedule 464646 4.9% 1.4% 0.8% 0.1% USD IPCA TR CDI TJLP SELIC FIXED Total 161.9  61.9     58.5  64.0  66.1  55.5  33.1  26.2  23.9  822.9         1,374.0  100.0%
  • 47. Cash X Debt (R$ million) According to Rating Agencies' Criteria* Cash X DebtIndebtedness Breakdown 1,221.0 54.7% 344.4 20.6% 16.6% Cash Debt 5.5% 1.6% 0.9% 0.1% USD IPCA TR CDI TJLP SELIC FIXED 474747*Considering 50% of the Subordinated Perpetual Bonds’ balance as Equity, amounting to R$ 153.1 million
  • 48. Investment Properties- R$ million Investment Properties 2,835.8 (2) 308.3 2,527.5 (1) 1,558.0  969.5 (1) Total value of investment properties (malls in operation) according to the Valuation Report of CB Richard Ellis on basis date 12/31/2012. The average rate of discount to the cash flow was 8.99% (2) Total value of investment properties and land value considering Book Value Adjustment to Fair Value (Operational Assets) Construction in progress (2) Total value of investment properties and land value, considering construction in progress . 484848
  • 49. Contacts GSB INVESTOR RELATIONSGSB INVESTOR RELATIONS Alessandro Poli Veronezi IR Officer Marcio SniokaMarcio Snioka IR Superintendent 55 11 3159-510055 11 3159 5100 dri@generalshopping.com.br www.generalshopping.com.br 494949