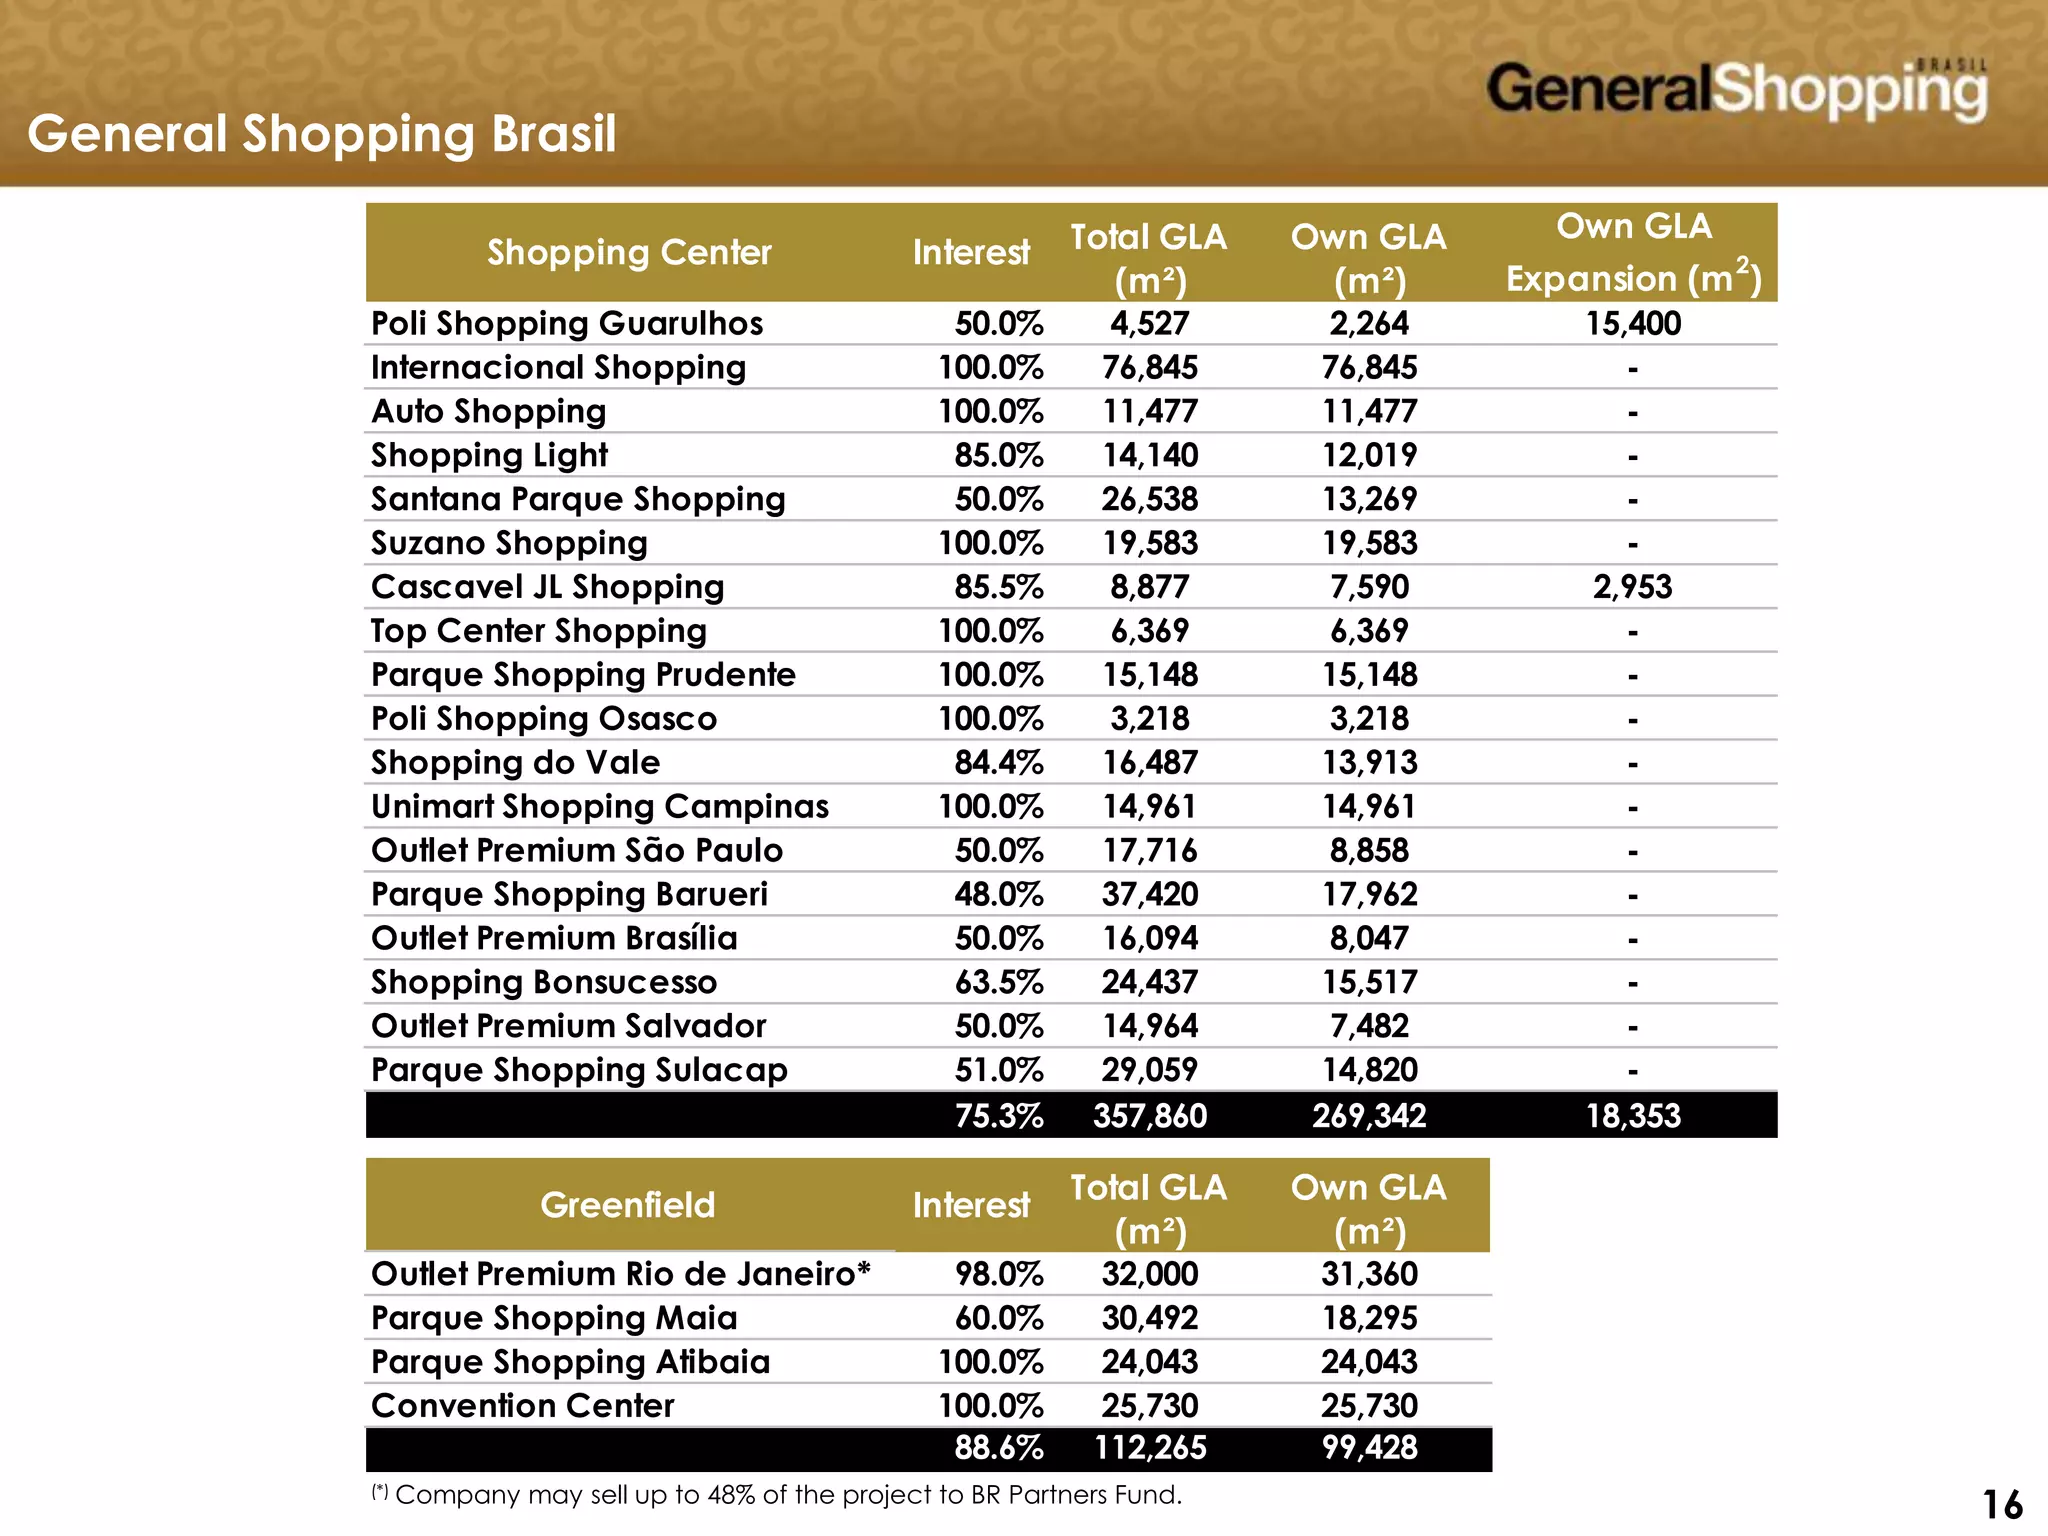
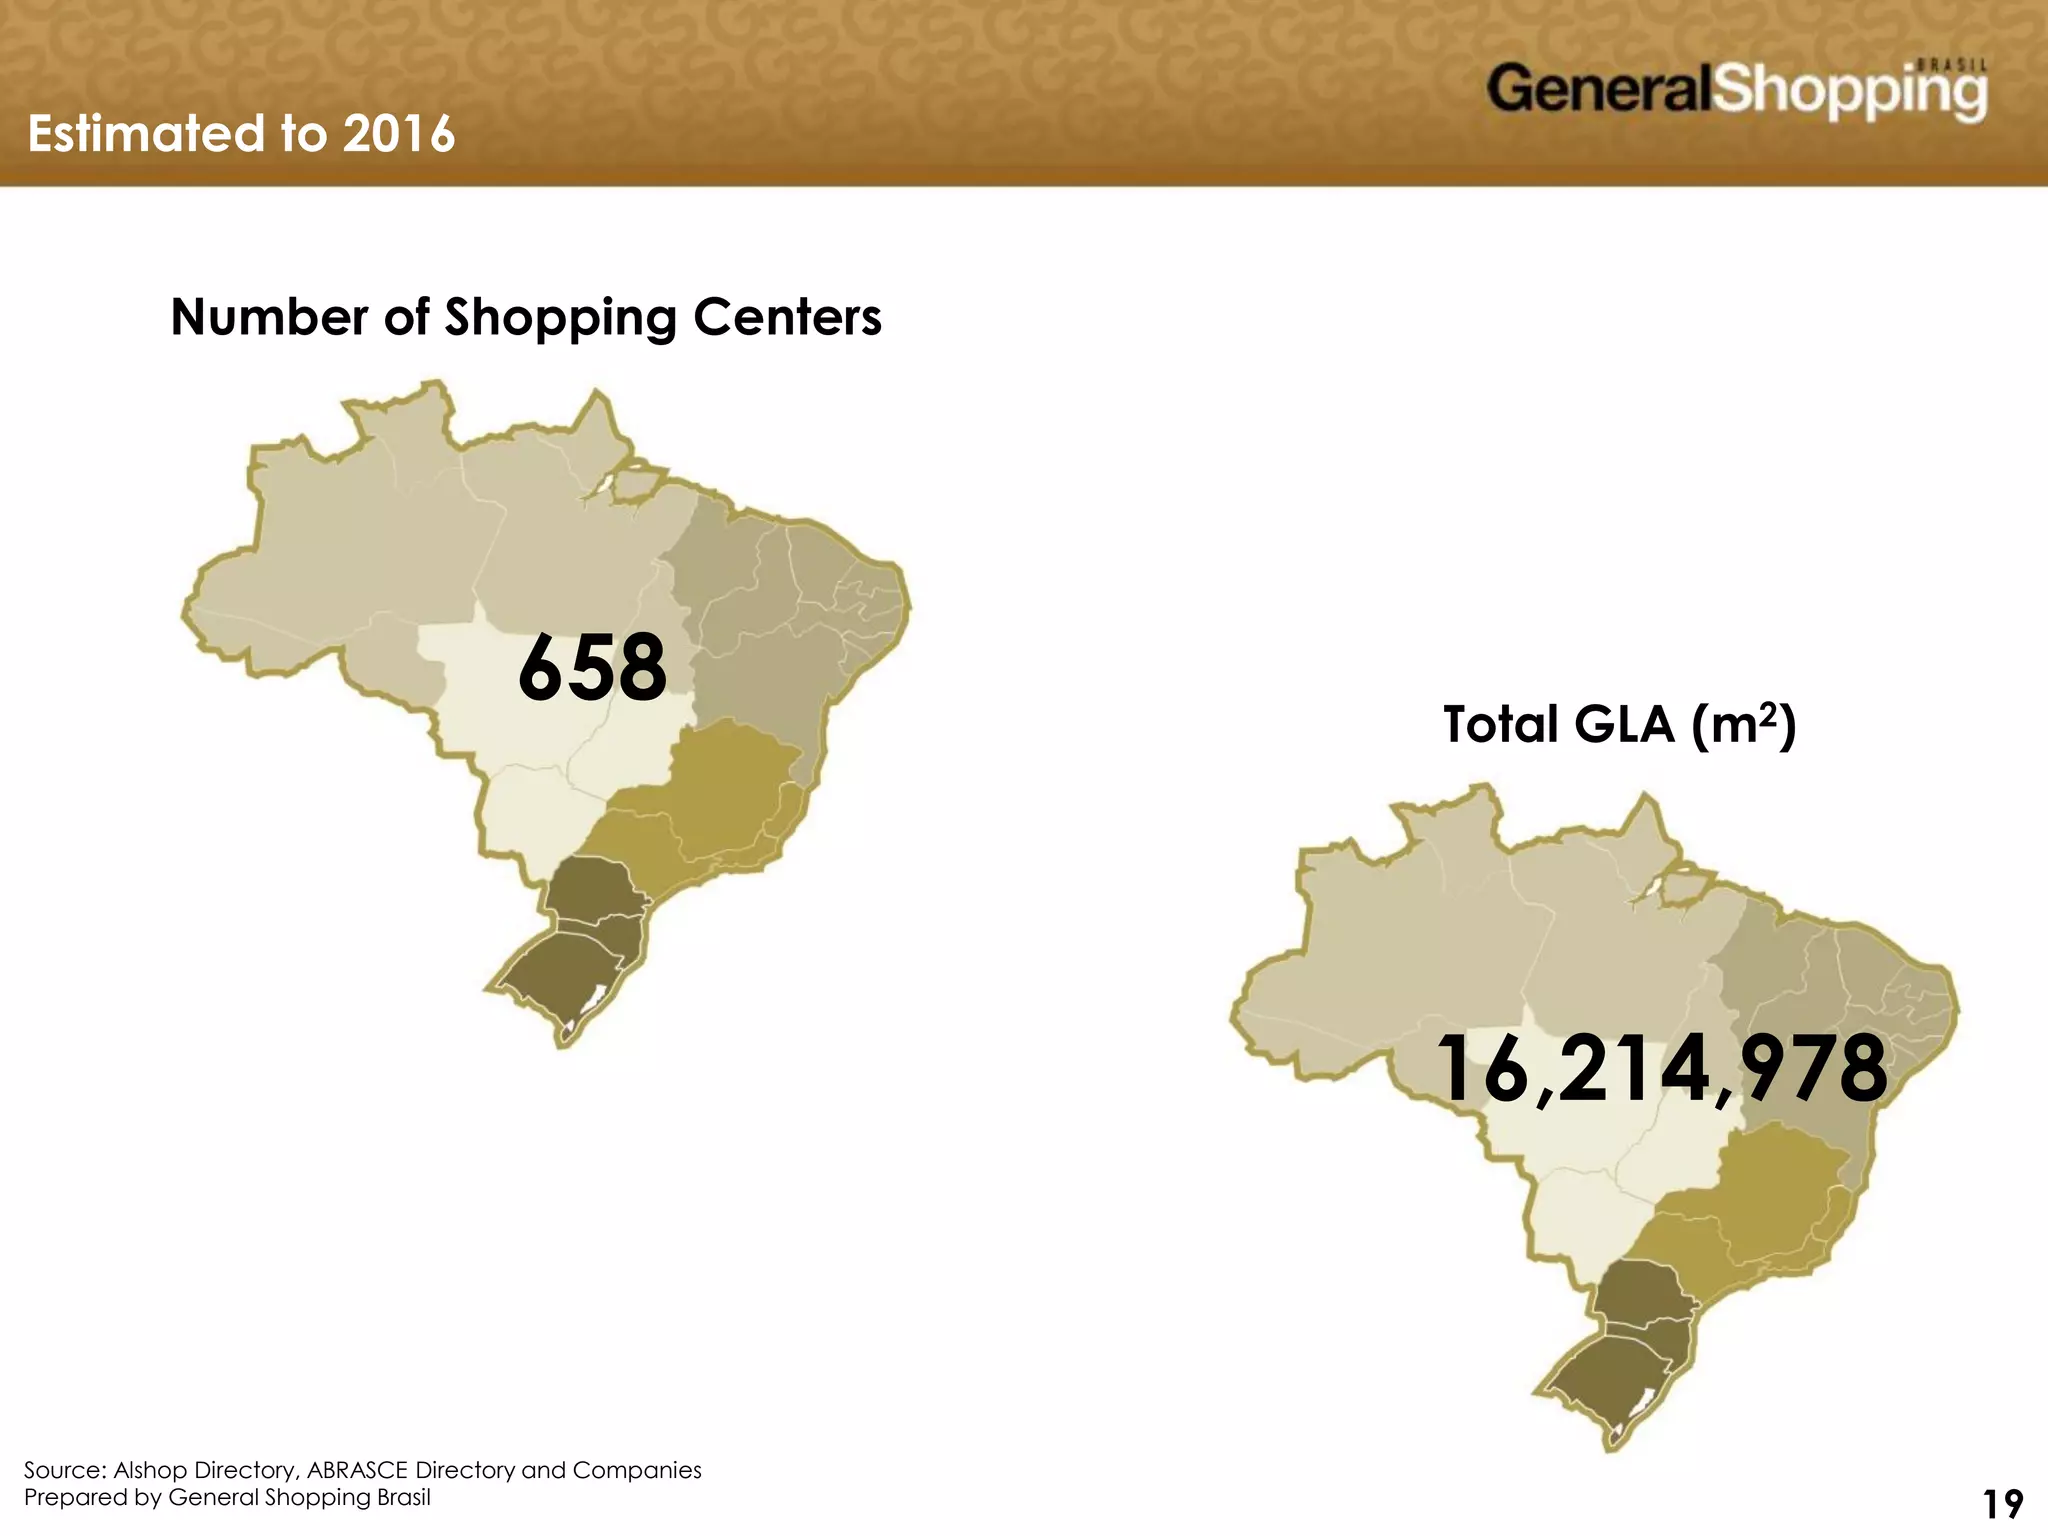
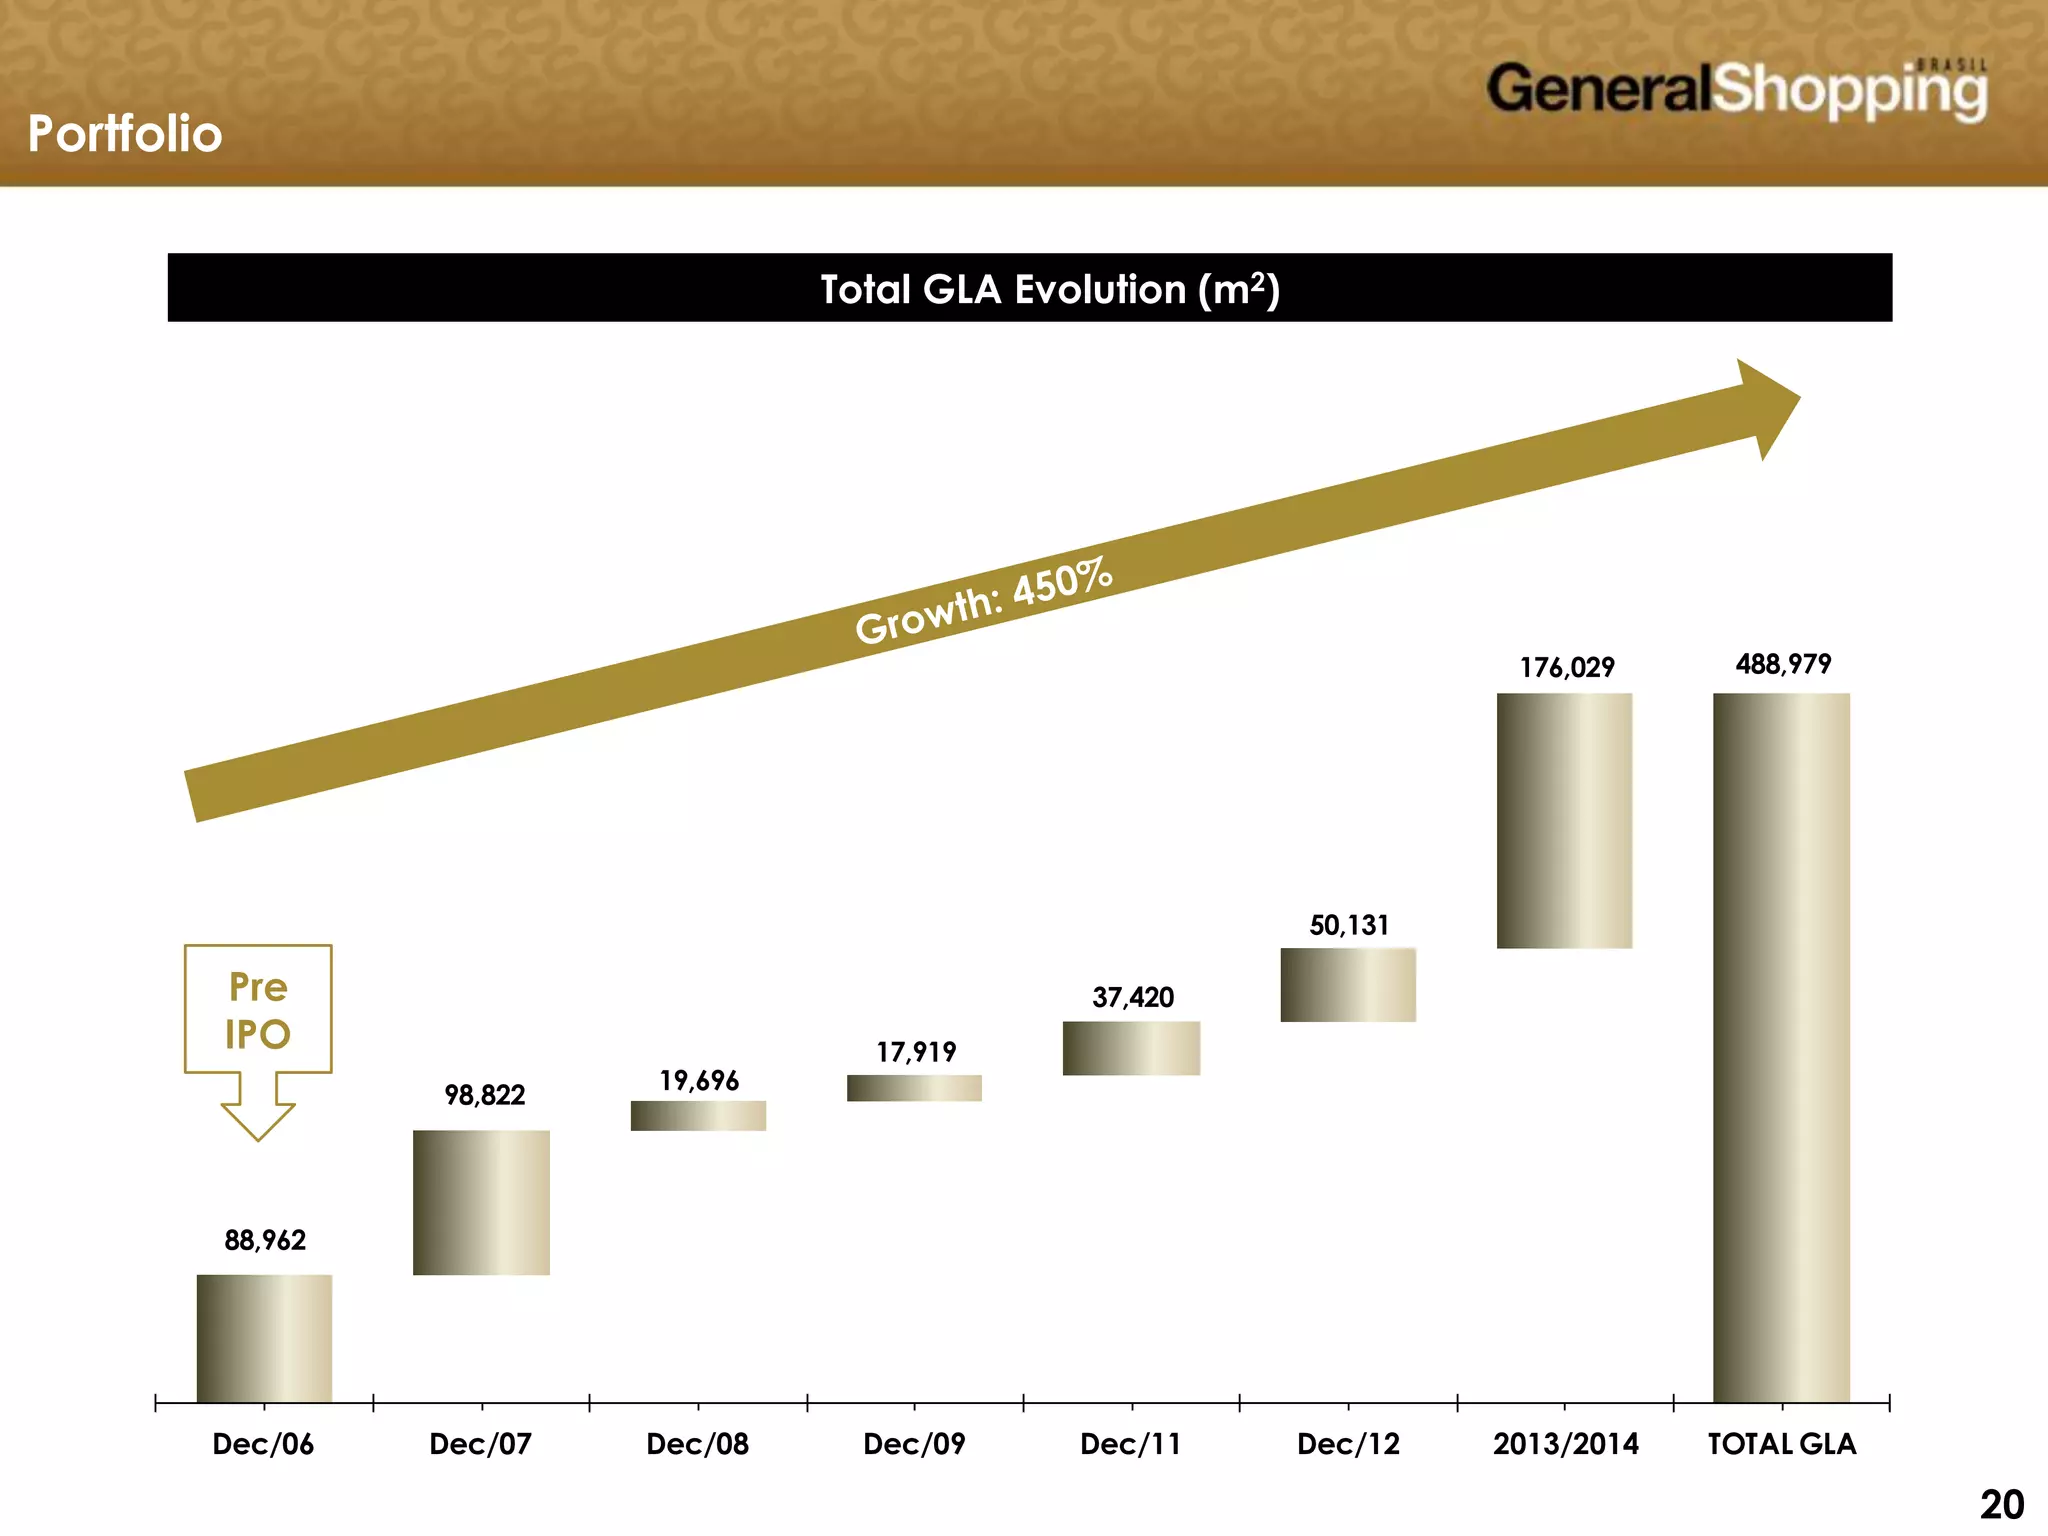
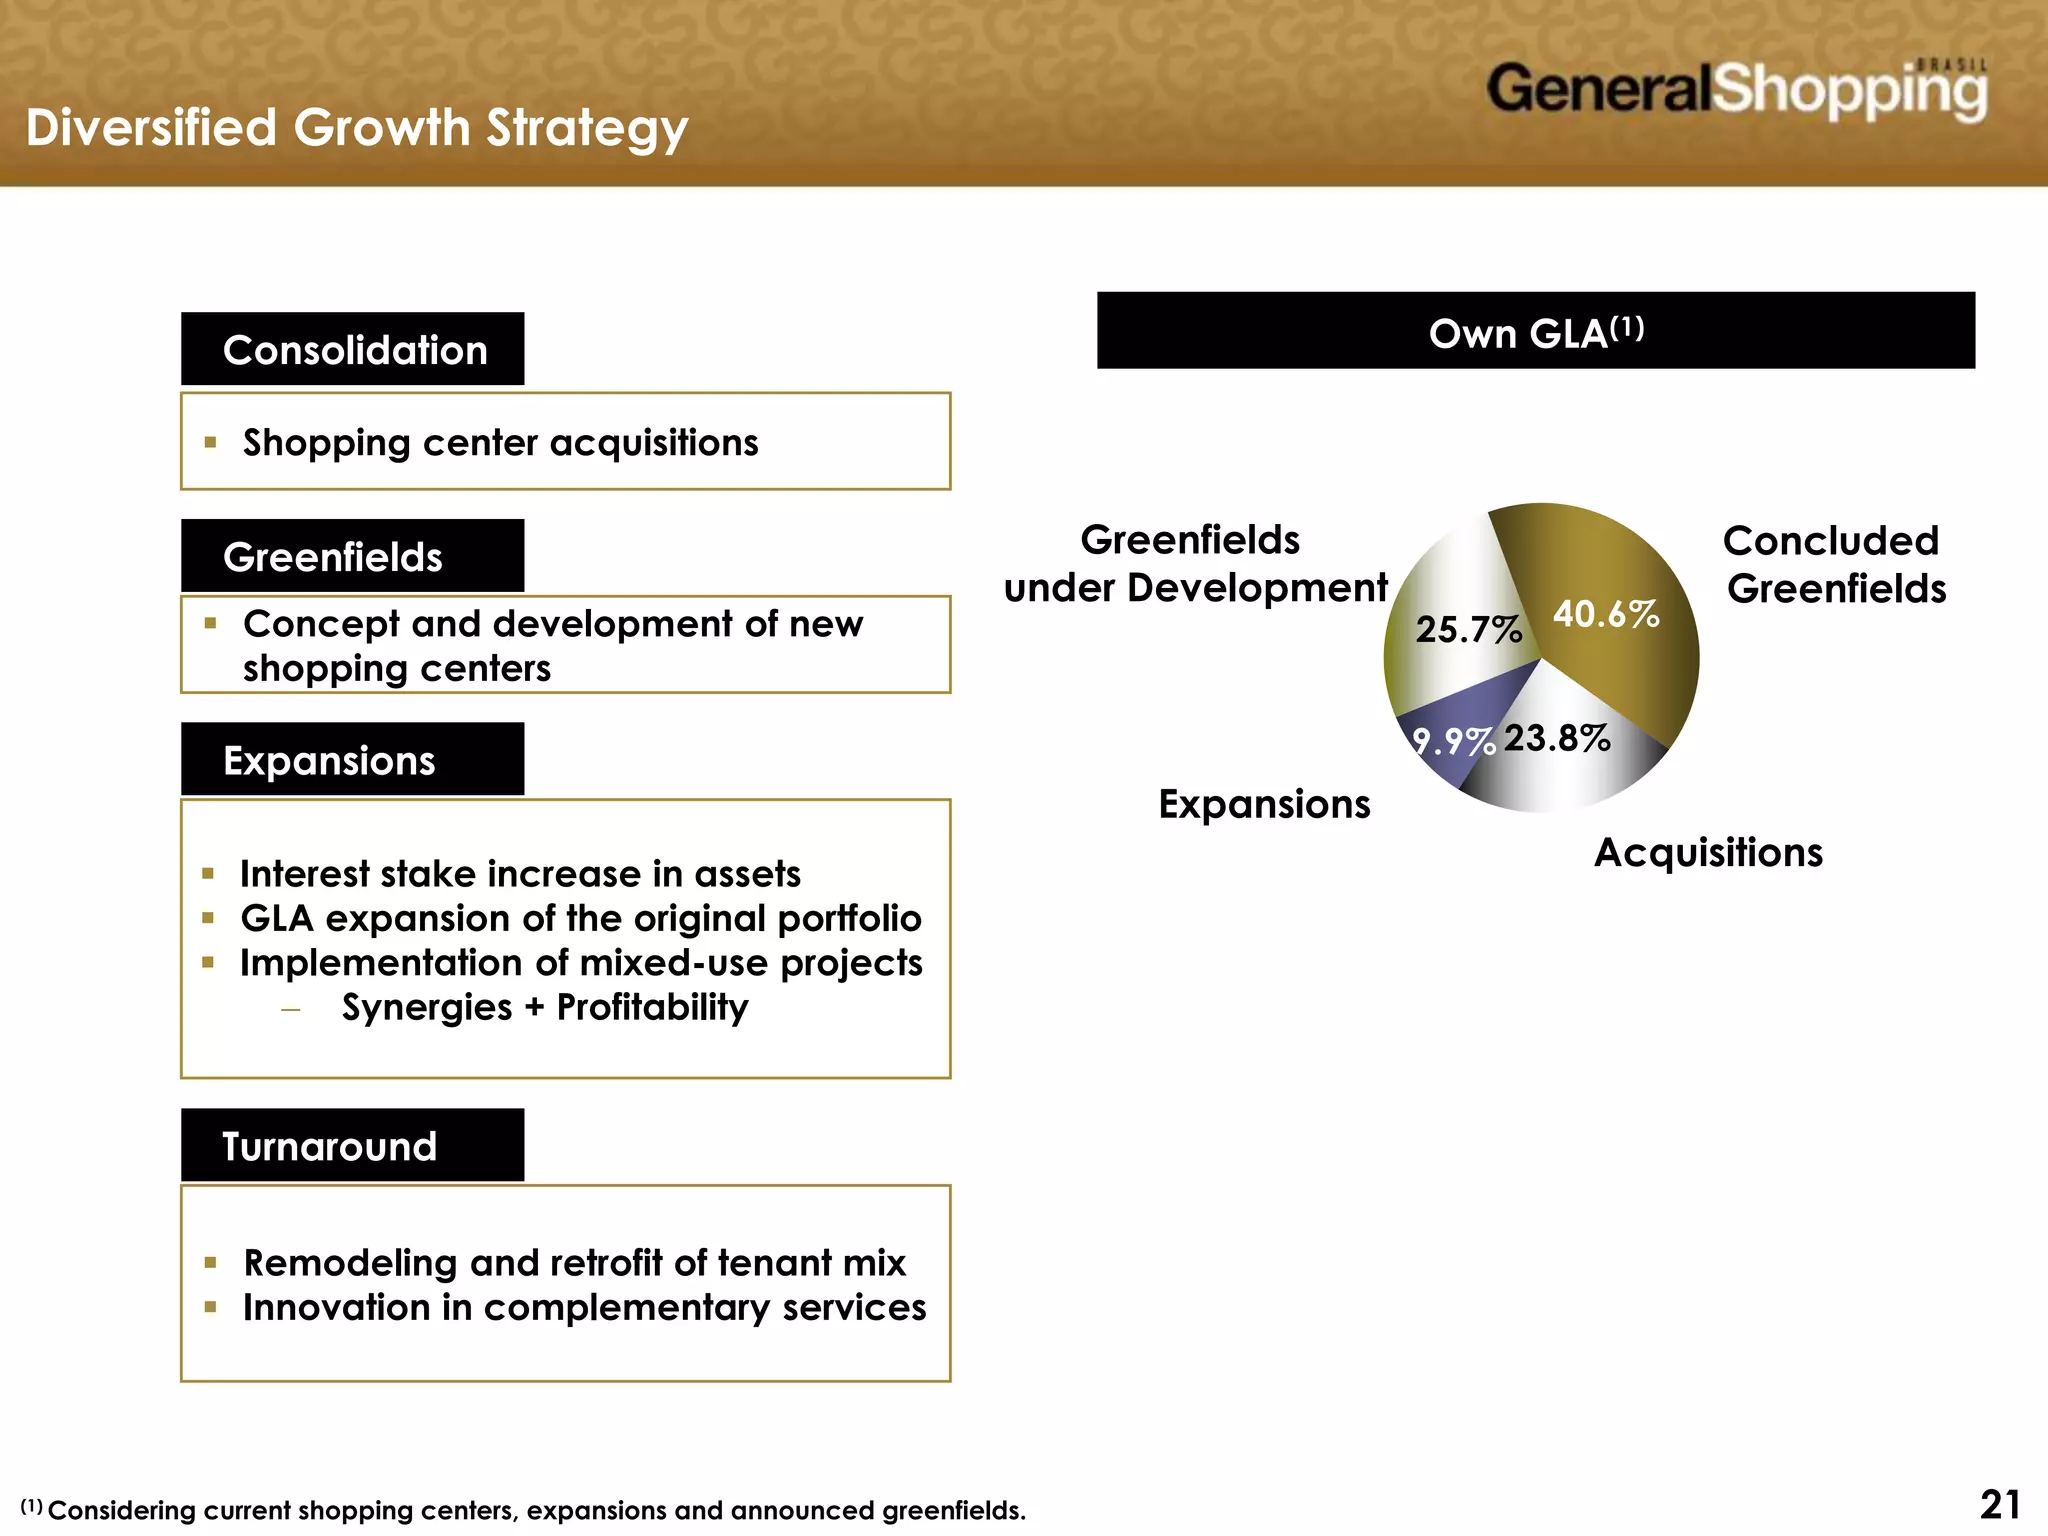
11
2013
222
This presentation contains statements that are forward-looking within the meaning of Section 27A of the
Securities Act of 1933 and Section 21E of the Securities Exchange Act of 1934. Such forward-looking
statements are only predictions and are not guarantees of future performance. Investors are cautioned
that any such forward-looking statements are and will be, as the case may be, subject to many risks,
uncertainties and factors relating to the operations and business environments of General Shopping
and its subsidiaries that may cause the actual results of the companies to be materially different from
any future results expressed or implied in such forward-looking statements.
This material is published solely for informational purposes and is not to be construed as a solicitation or
an offer to buy or sell any securities or related financial instruments and should not be treated as giving
investment advice. It is not targeted to the specific investment objectives, financial situation or
particular needs of any recipient. No representation or warranty, either express or implied, is provided in
relation to the accuracy, completeness or reliability of the information contained herein. This material
should not be regarded by recipients as a substitute for the exercise of their own judgment.
Any opinions expressed in this material are expressed as of this date and subject to change without
notice and General Shopping is not under the obligation to update or keep current the information
contained herein. General Shopping and the respective affiliates, directors, partners and employees
accept no liability whatsoever for any loss or damage of any kind arising out of the use of all or any part
of this material. You should consult with your own legal, regulatory, tax, business, investment, financial
and accounting advisers to the extent that you deem it necessary, and make your own investment,
hedging and trading decision (including decisions regarding the suitability of this transaction) based
upon your own judgment and advice from such advisers as you deem necessary and not upon any
views expressed in this material.
Disclaimer
333
Agenda
Sector Overview
Company Overview
Financial Performance
44
Sector Overview
555
10.5%
9.6% 9.8%
8.7%
7.5% 7.5%
6.1%
5.8%
5.3% 5.2%
Oct/04 Oct/05 Oct/06 Oct/07 Oct/08 Oct/09 Oct/10 Oct/11 Oct/12 Oct/13
Unemployment Rate in October
Economic Indicators
Source: PME-IBGE
Table prepared by General Shopping Brasil
666
25.6
26.7
29.0
30.5
33.3 33.4
36.9 37.2
40.2
41.7
Oct/04 Oct/05 Oct/06 Oct/07 Oct/08 Oct/09 Oct/10 Oct/11 Oct/12 Oct/13
Real Income of the Employed Population¹
R$ billion
Economic Indicators
Source: PME-IBGE; Table prepared by General Shopping Brasil
(1)Based on the employed population and their average income
777
560
590
620
650
680
710
740
770
0%
2%
4%
6%
8%
10%
12%
14%
(t-12) R$ billion
Credit Performance
Credit Volume – Individuals
Volume and Monthly Change
Source: Central Bank
Table prepared by General Shopping Brasil
888
6
7
8
9
Default Rate
Individuals - %
Credit Performance
Source: Central Bank
Table prepared by General Shopping Brasil
999
100
105
110
115
120
125
130
Economic Indicators
Consumer Confidence Index
Index - Quarterly Moving Average
Source: Fundação Getulio Vargas - FGV
Table prepared by General Shopping Brasil
101010
8.6 8.7
4.2
9.2
5.3
Retail Performance
Sales Volume - Monthly change (%)
As compared with same year-ago period
Source: PMC-IBGE
Table prepared by General Shopping Brasil
111111
Retail Growth
Retail Industry: Monthly Change (VS Same Year-Ago Period) of Sales Volume (Oct/11-Oct13)
Source: Brazilian Institute of Geography and Statistics (IBGE)
Table prepared by General Shopping Brasil
Total - Retail
Books, newspapers, magazines and
stationery
Office supplies and equipment, personal
computer and telecom
Other personal and domestic products
Oct-11 4.2 4.4 28.8 0.5
Nov-11 6.7 5.5 24.7 2.6
Dec-11 6.7 -2.3 34.8 3.4
Jan-12 7.8 9.8 32.9 13.1
Feb-12 10.6 -0.2 33.5 5.0
Mar-12 12.5 4.9 27.3 9.5
Apr-12 6.0 -4.0 33.2 2.6
May-12 8.3 2.0 17.2 8.2
Jun-12 9.4 9.5 -18.5 6.6
Jul-12 7.2 6.3 11.3 6.4
Aug-12 10.0 4.8 11.1 10.6
Sep-12 8.5 4.1 -0.4 7.5
Oct-12 9.2 11.1 16.1 13.6
Nov-12 8.5 11.2 -0.8 18.5
Dec-12 5.1 5.4 -23.0 9.0
Jan-13 5.9 6.1 8.7 14.0
Feb-13 -0.3 6.3 5.2 5.5
Mar-13 4.5 2.4 -2.0 15.4
Apr-13 1.6 12.8 5.2 7.1
May-13 4.4 0.7 -0.4 8.4
Jun-13 1.7 -3.5 6.9 6.8
Jul-13 6.0 1.5 8.3 11.7
Aug-13 6.2 -2.1 7.9 8.6
Sep-13 4.3 0.1 16.0 14.9
Oct-13 5.3 -0.6 10.5 11.9
-25
-15
-5
5
15
25
35
45
121212
Total - Retail Supermarkets and hypermarkets Fabrics, clothing and footwear
Furniture and white/durable
goods
Pharmaceutical, medical,
orthopedic and cosmetics
Oct-11 4.2 2.3 -2.2 13.1 7.5
Nov-11 6.7 6.2 0.4 12.3 8.4
Dec-11 6.7 4.6 0.8 15.3 7.0
Jan-12 7.8 8.5 1.5 13.2 8.6
Feb-12 10.6 13.3 -3.2 13.5 9.5
Mar-12 12.5 12.4 4.3 20.9 14.2
Apr-12 6.0 3.6 -1.4 12.5 9.3
May-12 8.3 8.8 4.0 9.3 12.3
Jun-12 9.4 11.1 0.6 15.6 11.3
Jul-12 7.2 5.0 5.7 12.6 11.4
Aug-12 10.0 8.5 8.4 15.3 12.8
Sep-12 8.5 9.9 5.4 6.2 8.2
Oct-12 9.2 6.6 4.5 13.8 13.0
Nov-12 8.5 8.3 6.5 8.5 9.6
Dec-12 5.1 6.8 3.8 8.4 4.1
Jan-13 5.9 3.3 5.2 5.8 10.6
Feb-13 -0.3 -2.1 0.5 -1.0 6.8
Mar-13 4.5 4.1 5.8 -0.8 4.8
Apr-13 1.6 -5.4 10.3 9.1 14.9
May-13 4.4 2.6 1.0 6.3 8.2
Jun-13 1.7 -0.7 -3.2 2.9 6.7
Jul-13 6.0 2.7 6.0 11.0 11.6
Aug-13 6.2 5.6 3.7 7.9 9.8
Sep-13 4.3 1.0 0.4 7.4 11.9
Oct-13 5.3 3.3 3.5 5.0 11.4
-10
-5
0
5
10
15
20
25
Retail Growth
Retail Industry: Monthly Change (VS Same Year-Ago Period) of Sales Volume (Oct/11-Oct13)
Source: Brazilian Institute of Geography and Statistics (IBGE)
Table prepared by General Shopping Brasil
1313
Company Overview
141414
 Market-driven company with retail approach
 B and C consumption classes as target market
 Innovative complementary services
 Majority ownership: 75.3% average interest
Differentials
151515
 ICSC - “Is a group of retail stores, planned,
developed and managed like an only one
operation.”
 ABRASCE – “ A planed group of retail stores with an
integrated operation and centralized
management,…, and at least part of its rental
revenues must be part of retail´s sales revenues.”
Shopping Center´s definitions
161616
General Shopping Brasil
Poli Shopping Guarulhos 50.0% 4,527 2,264 15,400
Internacional Shopping 100.0% 76,845 76,845 -
Auto Shopping 100.0% 11,477 11,477 -
Shopping Light 85.0% 14,140 12,019 -
Santana Parque Shopping 50.0% 26,538 13,269 -
Suzano Shopping 100.0% 19,583 19,583 -
Cascavel JL Shopping 85.5% 8,877 7,590 2,953
Top Center Shopping 100.0% 6,369 6,369 -
Parque Shopping Prudente 100.0% 15,148 15,148 -
Poli Shopping Osasco 100.0% 3,218 3,218 -
Shopping do Vale 84.4% 16,487 13,913 -
Unimart Shopping Campinas 100.0% 14,961 14,961 -
Outlet Premium São Paulo 50.0% 17,716 8,858 -
Parque Shopping Barueri 48.0% 37,420 17,962 -
Outlet Premium Brasília 50.0% 16,094 8,047 -
Shopping Bonsucesso 63.5% 24,437 15,517 -
Outlet Premium Salvador 50.0% 14,964 7,482 -
Parque Shopping Sulacap 51.0% 29,059 14,820 -
75.3% 357,860 269,342 18,353
Outlet Premium Rio de Janeiro* 98.0% 32,000 31,360
Parque Shopping Maia 60.0% 30,492 18,295
Parque Shopping Atibaia 100.0% 24,043 24,043
Convention Center 100.0% 25,730 25,730
88.6% 112,265 99,428
Own GLA
Expansion (m2
)
Shopping Center Interest Total GLA
(m²)
Own GLA
(m²)
Greenfield Interest
Total GLA
(m²)
Own GLA
(m²)
(*) Company may sell up to 48% of the project to BR Partners Fund.
171717
Top Center Shopping
Internacional Shopping Guarulhos
Poli Shopping Guarulhos
Santana Parque Shopping
Poli Shopping Osasco
Suzano Shopping
Shopping Light
Shopping do Vale
Parque Shopping Prudente Auto Shopping
Outlet Premium São Paulo Convention Center
Greenfield
Shopping in
operation
25,730Total GLA (m2)
16,487Total GLA (m2)
Cascavel JL Shopping
Unimart Shopping
Campinas
8,877Total GLA (m2)
8
15,148Total GLA (m2) Total GLA (m2) 11,47776,845Total GLA (m2)
6,369Total GLA (m2)
4,527Total GLA (m2) 3,218Total GLA (m2)
26,538Total GLA (m2) 19,583Total GLA (m2)
Outlet Premium Brasília
16,094Total GLA (m2)
(1) Estimated
Source: IBGE 2011
Parque Shopping Maia
30,492 (1)Total GLA (m2)
Parque Shopping Barueri
(1)
Region GDP Retail Mkt
South + Southeast 71.6% 72.3%
Parque Shopping AtibaiaShopping Bonsucesso
24,437Total GLA (m2)
Geographic Distribution
Outlet Premium Rio de Janeiro
32,000(1)Total GLA (m2)
(1)
24,043Total GLA (m2)
14,961Total GLA (m2)
37,420Total GLA (m2)
Parque Shopping Sulacap
29,059Total GLA (m2)
14,140Total GLA (m2)
17,716Total GLA (m2)
Outlet Premium Salvador
14,964Total GLA (m2)
181818
R$ 84 billion
R$ 350 billion
R$ 216 billion
R$ 1,249 billion
R$ 452 billion
4%
15%
9%
53%
19%
5%
15%
9%
57%
14%
4%
13%
10%
55%
18%
5%
13%
10%
56%
16%
R$ 224 billion
R$ 555 billion
R$ 396 billion
R$ 2,296 billion
R$ 672 billion
Total GDP: R$ 4,143 billion
Total Retail Sales: R$ 2,351 billion
Total Number of Shopping Centers: 492
Total GLA: 12,631,879 m²
21
66
50
269
86
560,407 m²
1,908,944 m²
1,183,653 m²
7,189,768 m²
1,789,106 m²
Geographic Distribution
GDP(1) Number of Shopping Centers(2)
Retail Sales(1)
GLA(2)
(1) Source: IBGE 2011
(2) Source: ABRASCE – December 2013
191919
658
16,214,978
Total GLA (m2)
Number of Shopping Centers
Estimated to 2016
Source: Alshop Directory, ABRASCE Directory and Companies
Prepared by General Shopping Brasil
202020
88,962
98,822
19,696
17,919
37,420
50,131
176,029 488,979
Dec/06 Dec/07 Dec/08 Dec/09 Dec/11 Dec/12 2013/2014 TOTAL GLA
Total GLA Evolution (m2)
Portfolio
Pre
IPO
212121
Diversified Growth Strategy
Consolidation
 Shopping center acquisitions
Greenfields
 Concept and development of new
shopping centers
Expansions
 Interest stake increase in assets
 GLA expansion of the original portfolio
 Implementation of mixed-use projects
 Synergies + Profitability
Turnaround
 Remodeling and retrofit of tenant mix
 Innovation in complementary services
(1) Considering current shopping centers, expansions and announced greenfields.
Concluded
Greenfields
Acquisitions
Expansions
Greenfields
under Development
Own GLA(1)
Own GLA(1)
40.6%
23.8%9.9%
25.7%
222222
Poli Shopping Guarulhos
Type: Downtown Community Center
City/State: Guarulhos/SP
Stake: 50.0%
Total GLA: 4,527 m²
Own GLA: 2,264 m²
Number of Stores: 52
Poli Shopping Guarulhos
232323
Internacional Shopping Guarulhos
Type: Regional
City/State: Guarulhos/SP
Stake: 100.0%
Total GLA: 76,845 m²
Own GLA: 76,845 m²
Number of Stores: 292
Internacional Shopping Guarulhos
242424
Type: Thematic
City/State: Guarulhos/SP
Stake: 100.0%
Total GLA: 11,477 m²
Own GLA: 11,477 m²
Number of Stores: 71
Auto Shopping
Auto Shopping
252525
Shopping Light
Type: Downtown Community Center
City/State: São Paulo/SP
Stake: 85.0%
Total GLA: 14,140 m²
Own GLA: 12,019 m²
Number of Stores: 134
Shopping Light
262626
Santana Parque Shopping
Type: Neighborhood
City/State: São Paulo/SP
Stake: 50.0%
Total GLA: 26,538 m²
Own GLA: 13,269 m²
Number of Stores: 174
Santana Parque Shopping
272727
Suzano Shopping
Type: Neighborhood
City/State: Suzano/SP
Stake: 100.0%
Total GLA: 19,583 m²
Own GLA: 19,583 m²
Number of Stores: 174
Suzano Shopping
282828
Cascavel JL Shopping
Type: Neighborhood
City/State: Cascavel/PR
Stake: 85.5%
Total GLA: 8,877 m²
Own GLA: 7,590 m²
Number of Stores: 74
Cascavel JL Shopping
292929
Top Center Shopping São Paulo
Type: Downtown Community Center
City/State: São Paulo/SP
Stake: 100.0%
Total GLA: 6,369 m²
Own GLA: 6,369 m²
Number of Stores: 67
Top Center Shopping São Paulo
303030
Parque Shopping Prudente
Type: Neighborhood
City/State: Presidente Prudente/SP
Stake: 100.0%
Total GLA: 15,148 m²
Own GLA: 15,148 m²
Number of Stores: 68
313131
Poli Shopping Osasco
Type: Downtown Community Center
City/State: Osasco/SP
Stake: 100.0%
Total GLA: 3,218 m²
Own GLA: 3,218 m²
Number of Stores: 13
Poli Shopping Osasco
323232
Shopping do Vale
Type: Neighborhood
City/State: Cachoeirinha/RS
Stake: 84.4%
Total GLA: 16,487 m²
Own GLA: 13,913 m²
Number of Stores: 103
Shopping do Vale
333333
Unimart Shopping Campinas
Type: Open Lifestyle Center
City/State: Campinas/SP
Stake: 100.0%
Total GLA: 14,961 m²
Own GLA: 14,961 m²
Number of Stores: 132
Description: Developed under the concept of Lifestyle. Unimart is an
open mall that combines commerce and convenience stores. The
range of stores is organized on wide corridors in harmony with
surrounding convenience outdoors, providing a pleasant environment
to customers and reduced operating costs for tenants.
343434
Outlet Premium São Paulo
Type: Outlet Center
City/State: Itupeva/SP
Stake: 50.0%
Total GLA: 17,716 m²
Own GLA: 8,858 m²
Number of Stores: 96
Influence area: Super Regional
Description: First outlet of the country. Entrance for main brands with
outlet operations. Located on the highway which connects São Paulo
capital to the Campinas metropolitan region. Power center comprising
hotel and 2 theme parks.
Initiative: Sales channel for remainder merchandise with occupancy
costs suitable to the off-price operation.
353535
Parque Shopping Barueri
Type: Regional
City/State: Barueri /SP
Stake: 48.0%
Total GLA: 37,420 m²
Own GLA: 17,962 m²
Number of Stores: 174
363636
Outlet Premium Brasília
Type: Outlet Center
City/State: Alexânia/GO
Stake: 50.0%
Total GLA: 16,094 m²
Own GLA: 8,047 m²
Number of Stores: 73
Influence area: Super Regional
Description: Second Outlet developed in the country. Located on the
highway which connects Brasília (country capital) to Goiânia (Goiás
state capital), the two biggest cities in midwestern states.
373737
Shopping Bonsucesso
Shopping Bonsucesso
Type: Neighborhood
City/State: Guarulhos/SP
Stake: 63.5%
Total GLA: 24,437 m2
Own GLA: 15,517 m2
Number of Stores: 132
383838
Outlet Premium Salvador
Type: Outlet Center
City/State: Camaçari/BA
Stake: 50.0%
Total GLA: 14,964 m2
Own GLA: 7,482 m2
Number of Stores: 71
Influence area: Super Regional
Description: Third Outlet from General Shopping Brasil, opened in
October 2013. Located next to Salvador, the biggest city in
northeastern states, on the road to the tourism resorts.
393939
Parque Shopping Sulacap
Type: Neighborhood
City/State: Rio de Janeiro/RJ
Stake: 51.0%
Total GLA: 29,059 m2
Own GLA: 14,820 m2
Number of Stores: 170
Description: Opened in October, 2013.
404040
Outlet Premium Rio de Janeiro
Outlet Premium Rio de Janeiro - Greenfield
Type: Outlet Center
City/State: Duque de Caxias/RJ
Stake: 98%
Estimated Total GLA: 32,000 m2
Estimated Own GLA : 31,360 m2
Influence area (inhabitants): Super Regional
Description: Fourth outlet from the Company. Located near the city of
Rio de Janeiro, with easy access to the city of Rio de Janeiro, the
mountainous region of Rio de Janeiro state, Galeão and Santos
Dumont airports and close to the future metropolitan road arc.
414141
Parque Shopping Maia
Parque Shopping Maia- Greenfield
Type: Neighborhood
City/State: Guarulhos/SP
Stake: 60.0%
Total GLA: 30,492 m2
Own GLA: 18,295 m2
Description: expected to be opened in 2014
424242
Parque Shopping Atibaia
Parque Shopping Atibaia - Greenfield
Type: Neighborhood
City/State: Atibaia/SP
Stake: 100.0%
Total GLA: 24,043 m2
Own GLA: 24,043 m2
Description: expected to be opened in 2014
434343
ISG    
Auto    
Poli    
Light    
Santana *   
Cascavel    
Prudente
Parque    
Poli Shopping
Osasco  
Top Center  
Do Vale    
Unimart
Campinas    
Suzano    
Outlet Premium
São Paulo    
Parque Shopping
Barueri    
Outlet Premium
Brasília    
Shopping
Bonsucesso    
Outlet Premium
Salvador    
Parque Shopping
Sulacap    
Atlas
Energy
Wass
I Park
and
GSPark
GSB Adm
ASG Adm
Stake Held
100%
100%
100%
100%
100%
► Responsible for planning the
energy supply and leasing of
the equipment for its
transmission and distribution
► Engaged in water supply
planning and its treatment
and distribution
► Controls and manages
parking lots
► Manages operations of
shopping centers
► Manages the operations of
Auto Shopping
Management Parking Water Energy
Services currently provided to the mall
 Potential services / currently being implemented
 * Partial
Increasing Complementary Services Activities
444444
R$ 9.12*
301.8%*
50,787*
35.3%*
0
50
100
150
200
250
300
350
400
450
500
550
600
650
700
Dec-08
Jan-09
Feb-09
Mar-09
Apr-09
May-09
Jun-09
Jul-09
Aug-09
Sep-09
Oct-09
Nov-09
Dec-09
Jan-10
Feb-10
Mar-10
Apr-10
May-10
Jun-10
Jul-10
Aug-10
Sep-10
Oct-10
Nov-10
Dec-10
Jan-11
Feb-11
Mar-11
Apr-11
May-11
Jun-11
Jul-11
Aug-11
Sep-11
Oct-11
Nov-11
Dec-11
Jan-12
Feb-12
Mar-12
Apr-12
May-12
Jun-12
Jul-12
Aug-12
Sep-12
Oct-12
Nov-12
Dec-12
Jan-13
Feb-13
Mar-13
Apr-13
May-13
Jun-13
Jul-13
Aug-13
Sep-13
Oct-13
Nov-13
GSHP3 Ibovespa
Stock Performance
(Basis 100 – DEC 30, 2008)
(*) In Dec 5, 2013
Until SEP 30, 2013: GSHP3 = 273.6%
Ibovespa = 39.4%
Stock Performance
454545
64,685
22,90213,294 4,231 6,394
17,971
91,672
65,52766,365
42,790
59,840
102,614
64,746
278,611
150,268
92,470
156,813
122,759
58,566
45,608
86,80486,136
56,068
574 712 568 809 1,105
1,886
6,263
5,254
3,911
3,236 3,077
5,945
4,545
12,625
13,164
8,196
13,391
13,561
6,569
5,864
6,660
11,284
6,810
1Q08 2Q08 3Q08 4Q08 1Q09 2Q09 3Q09 4Q09 1Q10 2Q10 3Q10 4Q10 1Q11 2Q11 3Q11 4Q11 1Q12 2Q12 3Q12 4Q12 1Q13 2Q13 3Q13
Trading Volume Number of Trades
GSHP3
Volume (R$ thousand)
Liquidity
464646
Shareholders
(*) Position as of December 5, 2013
59.4%
40.6%
Free float Controlling shareholder
Nr. Shares Type of investor
(*)
Controlling
shareholder
30,000,000 -
40.5% - Brazilian
56.3% - Foreign
3.2% - Individual
Total 50,480,600 -
Free float 20,480,600
Listed since July 2007
4747
Desempenho Financeiro
484848
Gross Revenue, NOI and Adjusted EBITDA
1Q12 2Q12 3Q12 4Q12 1Q13 2Q13 3Q13
Gross Revenue 40.9 44.1 49.7 61.5 54.5 57.7 58.0
NOI 33.5 35.6 41.2 48.5 43.5 46.0 46.3
Adjusted EBITDA 26.8 28.4 32.0 38.7 34.4 36.9 36.3
NOI Margin 88.0% 86.3% 89.0% 85.5% 87.2% 87.3% 87.8%
Ebitda Margin 70.4% 68.7% 69.2% 68.3% 69.0% 70.0% 68.8%
494949
Rental Gross Revenue
RENTAL REVENUE 1Q12 2Q12 3Q12 4Q12 1Q13 2Q13 3Q13
Minimum Rent 24.0 25.0 27.7 37.1 30.7 31.3 31.0
Percentage on Sales 2.9 3.7 4.3 7.3 4.0 5.1 4.7
Other (a) 5.1 5.4 6.0 2.2 6.6 6.9 8.1
Occupancy Rate 96.6% 96.4% 96.2% 96.7% 96.6% 96.7% 96.4%
(a) Includes: Mall / Advertising, Key Money and Straight-lining Revenue
505050
1.0 1.0 1.6 1.8 1.2 0.8 0.8
1.0 1.0
1.0 1.2
1.4 1.5 1.5
0.7 0.7 0.9
1.2 1.6
1.3 1.1
6.2
7.3
8.2
10.8
9.1 10.8 10.8
41.7
47.0 48.3
58.7
52.0
56.4 57.8
1Q12 2Q12 3Q12 4Q12 1Q13 2Q13 3Q13
R$ million
Energy Water Management Parking Services (R$/m²)
Services Gross Revenue
SERVICES REVENUE 1Q12 2Q12 3Q12 4Q12 1Q13 2Q13 3Q13
Parking 6.2 7.3 8.2 10.8 9.1 10.8 10.8
Energy 1.0 1.0 1.6 1.8 1.2 0.8 0.8
Water 1.0 1.0 1.0 1.2 1.4 1.5 1.5
Management 0.7 0.7 0.9 1.2 1.6 1.3 1.1
Total 8.9 10.0 11.7 15.0 13.3 14.4 14.2
515151
Performance
Description 3Q12 3Q13 Chg % 9M12 9M13 Chg %
Average GLA (m2
) 241,789 246,153 1.8% 222,589 252,100 13.3%
Rent (R$/m2
) 157.14 177.93 13.2% 467.48 509.33 8.9%
Services (R$/m2
) 48.30 57.83 19.7% 137.37 166.06 20.9%
Total (R$/m2
) 205.44 235.76 14.8% 604.85 675.39 11.7%
GSB (Total)
525252
EBITDA, FFO and Adjusted Net Result
Data 1Q12 2Q12 3Q12 4Q12 1Q13 2Q13 3Q13
Adjusted EBITDA 26.8 28.4 32.0 38.7 34.4 36.9 36.3
Adjusted FFO 10.8 (73.4) (6.3) (3.5) (1.2) (71.2) (12.7)
Adjusted Net Result 6.8 (77.4) (9.9) (8.1) (7.3) (77.0) (18.0)
Financial Result (12.5) (93.4) (32.6) (37.7) (30.3) (100.1) (42.4)
Income Taxes/Social Contribution (3.5) (8.4) (5.7) (4.6) (5.3) (10.1) (6.6)
535353
Amortization Schedule
373.0
105.4
40.4 45.8 51.7 58.4 55.2 33.3 27.0 25.0
53.5
19.7
64.8
29.1 20.2 15.7 8.3
8.3 8.1 8.1
4.3
60.0
1.5 1.5 1.4 1.5
1.5 1.5 1.4
5.1
8.2
2014 2015 2016 2017 2018 2019 2020 2021 After 2021
Cash CCI Banks New Funding Perpetual Bonds
881.7
Cash X Debt (R$ million)
2013
75.4 75.4
297.6
1,572.2
373.0
1,647.6
Cash Pro Forma Debt
Cash X Debt
54.2%
21.3%
11.3% 10.3%
1.2% 1.0% 0.7%
USD IPCA TR CDI TJLP FIXED SELIC
Indebtedness Breakdown
* Cash Position and Indebtedness, considering the amounts of new funding of R$ 75.4 million.
2013 2014 2015 2016 2017 2018 2019 2020 2021
After
2021
Total %
CCI 105.4 40.4 45.8 51.7 58.4 55.2 33.3 27.0 25.0 53.5 495.7 30.1%
Banks 19.7 64.8 29.1 20.2 15.7 8.3 8.3 8.1 8.1 4.3 186.6 11.3%
New Funding - 60.0 1.5 1.5 1.4 1.5 1.5 1.5 1.4 5.1 75.4 4.6%
Perpetual Bonds 8.2 - - - - - - - - 881.7 889.9 54.0%
Total 133.3 165.2 76.4 73.4 75.5 65.0 43.1 36.6 34.5 944.6 1,647.6 100.0%
Amortization Schedule
545454
49.2%
23.5%
12.6% 11.4%
1.4% 1.1% 0.8%
USD IPCA TR CDI TJLP FIXED SELIC
Indebtedness Breakdown
* Considering 50% of the Subordinated Perpetual Bonds’ balance as Equity, amounting to R$ 163.8 million.
Include loans related to the Subsequent Events, amounting R$ 75.4 million
Cash X Debt (R$ million)
According to Rating Agencies' Criteria*
75.4 75.4
297.6
1,408.4
373.0
1,483.8
Cash Debt
Cash X Debt
555555
Investment Properties- R$ million
926.4
1,488.9
694.3
Investments Properties
Book Value Adjustmentsto Fair Value(Operational Assets) Constructionsin Progress
2,415.4 (1)
3,109.7 (2)
(1) Total valueof investmentproperties (mallsinoperation) accordingto the
ValuationReportofCB Richard Ellison basisdate 12/31/2012.
The average rate of discountto the cash flowwas 8.99%.
(2) Total valueof investmentproperties andloan value,considering
constriuctioninprogress.
565656
APIMEC – Attendance Seal 7 years
575757
GSB INVESTOR RELATIONS
Alessandro Poli Veronezi
IR Officer
Marcio Snioka
IR Superintendent
55 11 3159-5100
dri@generalshopping.com.br
www.generalshopping.com.br
Contacts

Analyst Meeting Presentation Dec/13

  • 1.
  • 2.
    222 This presentation containsstatements that are forward-looking within the meaning of Section 27A of the Securities Act of 1933 and Section 21E of the Securities Exchange Act of 1934. Such forward-looking statements are only predictions and are not guarantees of future performance. Investors are cautioned that any such forward-looking statements are and will be, as the case may be, subject to many risks, uncertainties and factors relating to the operations and business environments of General Shopping and its subsidiaries that may cause the actual results of the companies to be materially different from any future results expressed or implied in such forward-looking statements. This material is published solely for informational purposes and is not to be construed as a solicitation or an offer to buy or sell any securities or related financial instruments and should not be treated as giving investment advice. It is not targeted to the specific investment objectives, financial situation or particular needs of any recipient. No representation or warranty, either express or implied, is provided in relation to the accuracy, completeness or reliability of the information contained herein. This material should not be regarded by recipients as a substitute for the exercise of their own judgment. Any opinions expressed in this material are expressed as of this date and subject to change without notice and General Shopping is not under the obligation to update or keep current the information contained herein. General Shopping and the respective affiliates, directors, partners and employees accept no liability whatsoever for any loss or damage of any kind arising out of the use of all or any part of this material. You should consult with your own legal, regulatory, tax, business, investment, financial and accounting advisers to the extent that you deem it necessary, and make your own investment, hedging and trading decision (including decisions regarding the suitability of this transaction) based upon your own judgment and advice from such advisers as you deem necessary and not upon any views expressed in this material. Disclaimer
  • 3.
  • 4.
  • 5.
    555 10.5% 9.6% 9.8% 8.7% 7.5% 7.5% 6.1% 5.8% 5.3%5.2% Oct/04 Oct/05 Oct/06 Oct/07 Oct/08 Oct/09 Oct/10 Oct/11 Oct/12 Oct/13 Unemployment Rate in October Economic Indicators Source: PME-IBGE Table prepared by General Shopping Brasil
  • 6.
    666 25.6 26.7 29.0 30.5 33.3 33.4 36.9 37.2 40.2 41.7 Oct/04Oct/05 Oct/06 Oct/07 Oct/08 Oct/09 Oct/10 Oct/11 Oct/12 Oct/13 Real Income of the Employed Population¹ R$ billion Economic Indicators Source: PME-IBGE; Table prepared by General Shopping Brasil (1)Based on the employed population and their average income
  • 7.
    777 560 590 620 650 680 710 740 770 0% 2% 4% 6% 8% 10% 12% 14% (t-12) R$ billion CreditPerformance Credit Volume – Individuals Volume and Monthly Change Source: Central Bank Table prepared by General Shopping Brasil
  • 8.
    888 6 7 8 9 Default Rate Individuals -% Credit Performance Source: Central Bank Table prepared by General Shopping Brasil
  • 9.
    999 100 105 110 115 120 125 130 Economic Indicators Consumer ConfidenceIndex Index - Quarterly Moving Average Source: Fundação Getulio Vargas - FGV Table prepared by General Shopping Brasil
  • 10.
    101010 8.6 8.7 4.2 9.2 5.3 Retail Performance SalesVolume - Monthly change (%) As compared with same year-ago period Source: PMC-IBGE Table prepared by General Shopping Brasil
  • 11.
    111111 Retail Growth Retail Industry:Monthly Change (VS Same Year-Ago Period) of Sales Volume (Oct/11-Oct13) Source: Brazilian Institute of Geography and Statistics (IBGE) Table prepared by General Shopping Brasil Total - Retail Books, newspapers, magazines and stationery Office supplies and equipment, personal computer and telecom Other personal and domestic products Oct-11 4.2 4.4 28.8 0.5 Nov-11 6.7 5.5 24.7 2.6 Dec-11 6.7 -2.3 34.8 3.4 Jan-12 7.8 9.8 32.9 13.1 Feb-12 10.6 -0.2 33.5 5.0 Mar-12 12.5 4.9 27.3 9.5 Apr-12 6.0 -4.0 33.2 2.6 May-12 8.3 2.0 17.2 8.2 Jun-12 9.4 9.5 -18.5 6.6 Jul-12 7.2 6.3 11.3 6.4 Aug-12 10.0 4.8 11.1 10.6 Sep-12 8.5 4.1 -0.4 7.5 Oct-12 9.2 11.1 16.1 13.6 Nov-12 8.5 11.2 -0.8 18.5 Dec-12 5.1 5.4 -23.0 9.0 Jan-13 5.9 6.1 8.7 14.0 Feb-13 -0.3 6.3 5.2 5.5 Mar-13 4.5 2.4 -2.0 15.4 Apr-13 1.6 12.8 5.2 7.1 May-13 4.4 0.7 -0.4 8.4 Jun-13 1.7 -3.5 6.9 6.8 Jul-13 6.0 1.5 8.3 11.7 Aug-13 6.2 -2.1 7.9 8.6 Sep-13 4.3 0.1 16.0 14.9 Oct-13 5.3 -0.6 10.5 11.9 -25 -15 -5 5 15 25 35 45
  • 12.
    121212 Total - RetailSupermarkets and hypermarkets Fabrics, clothing and footwear Furniture and white/durable goods Pharmaceutical, medical, orthopedic and cosmetics Oct-11 4.2 2.3 -2.2 13.1 7.5 Nov-11 6.7 6.2 0.4 12.3 8.4 Dec-11 6.7 4.6 0.8 15.3 7.0 Jan-12 7.8 8.5 1.5 13.2 8.6 Feb-12 10.6 13.3 -3.2 13.5 9.5 Mar-12 12.5 12.4 4.3 20.9 14.2 Apr-12 6.0 3.6 -1.4 12.5 9.3 May-12 8.3 8.8 4.0 9.3 12.3 Jun-12 9.4 11.1 0.6 15.6 11.3 Jul-12 7.2 5.0 5.7 12.6 11.4 Aug-12 10.0 8.5 8.4 15.3 12.8 Sep-12 8.5 9.9 5.4 6.2 8.2 Oct-12 9.2 6.6 4.5 13.8 13.0 Nov-12 8.5 8.3 6.5 8.5 9.6 Dec-12 5.1 6.8 3.8 8.4 4.1 Jan-13 5.9 3.3 5.2 5.8 10.6 Feb-13 -0.3 -2.1 0.5 -1.0 6.8 Mar-13 4.5 4.1 5.8 -0.8 4.8 Apr-13 1.6 -5.4 10.3 9.1 14.9 May-13 4.4 2.6 1.0 6.3 8.2 Jun-13 1.7 -0.7 -3.2 2.9 6.7 Jul-13 6.0 2.7 6.0 11.0 11.6 Aug-13 6.2 5.6 3.7 7.9 9.8 Sep-13 4.3 1.0 0.4 7.4 11.9 Oct-13 5.3 3.3 3.5 5.0 11.4 -10 -5 0 5 10 15 20 25 Retail Growth Retail Industry: Monthly Change (VS Same Year-Ago Period) of Sales Volume (Oct/11-Oct13) Source: Brazilian Institute of Geography and Statistics (IBGE) Table prepared by General Shopping Brasil
  • 13.
  • 14.
    141414  Market-driven companywith retail approach  B and C consumption classes as target market  Innovative complementary services  Majority ownership: 75.3% average interest Differentials
  • 15.
    151515  ICSC -“Is a group of retail stores, planned, developed and managed like an only one operation.”  ABRASCE – “ A planed group of retail stores with an integrated operation and centralized management,…, and at least part of its rental revenues must be part of retail´s sales revenues.” Shopping Center´s definitions
  • 16.
    161616 General Shopping Brasil PoliShopping Guarulhos 50.0% 4,527 2,264 15,400 Internacional Shopping 100.0% 76,845 76,845 - Auto Shopping 100.0% 11,477 11,477 - Shopping Light 85.0% 14,140 12,019 - Santana Parque Shopping 50.0% 26,538 13,269 - Suzano Shopping 100.0% 19,583 19,583 - Cascavel JL Shopping 85.5% 8,877 7,590 2,953 Top Center Shopping 100.0% 6,369 6,369 - Parque Shopping Prudente 100.0% 15,148 15,148 - Poli Shopping Osasco 100.0% 3,218 3,218 - Shopping do Vale 84.4% 16,487 13,913 - Unimart Shopping Campinas 100.0% 14,961 14,961 - Outlet Premium São Paulo 50.0% 17,716 8,858 - Parque Shopping Barueri 48.0% 37,420 17,962 - Outlet Premium Brasília 50.0% 16,094 8,047 - Shopping Bonsucesso 63.5% 24,437 15,517 - Outlet Premium Salvador 50.0% 14,964 7,482 - Parque Shopping Sulacap 51.0% 29,059 14,820 - 75.3% 357,860 269,342 18,353 Outlet Premium Rio de Janeiro* 98.0% 32,000 31,360 Parque Shopping Maia 60.0% 30,492 18,295 Parque Shopping Atibaia 100.0% 24,043 24,043 Convention Center 100.0% 25,730 25,730 88.6% 112,265 99,428 Own GLA Expansion (m2 ) Shopping Center Interest Total GLA (m²) Own GLA (m²) Greenfield Interest Total GLA (m²) Own GLA (m²) (*) Company may sell up to 48% of the project to BR Partners Fund.
  • 17.
    171717 Top Center Shopping InternacionalShopping Guarulhos Poli Shopping Guarulhos Santana Parque Shopping Poli Shopping Osasco Suzano Shopping Shopping Light Shopping do Vale Parque Shopping Prudente Auto Shopping Outlet Premium São Paulo Convention Center Greenfield Shopping in operation 25,730Total GLA (m2) 16,487Total GLA (m2) Cascavel JL Shopping Unimart Shopping Campinas 8,877Total GLA (m2) 8 15,148Total GLA (m2) Total GLA (m2) 11,47776,845Total GLA (m2) 6,369Total GLA (m2) 4,527Total GLA (m2) 3,218Total GLA (m2) 26,538Total GLA (m2) 19,583Total GLA (m2) Outlet Premium Brasília 16,094Total GLA (m2) (1) Estimated Source: IBGE 2011 Parque Shopping Maia 30,492 (1)Total GLA (m2) Parque Shopping Barueri (1) Region GDP Retail Mkt South + Southeast 71.6% 72.3% Parque Shopping AtibaiaShopping Bonsucesso 24,437Total GLA (m2) Geographic Distribution Outlet Premium Rio de Janeiro 32,000(1)Total GLA (m2) (1) 24,043Total GLA (m2) 14,961Total GLA (m2) 37,420Total GLA (m2) Parque Shopping Sulacap 29,059Total GLA (m2) 14,140Total GLA (m2) 17,716Total GLA (m2) Outlet Premium Salvador 14,964Total GLA (m2)
  • 18.
    181818 R$ 84 billion R$350 billion R$ 216 billion R$ 1,249 billion R$ 452 billion 4% 15% 9% 53% 19% 5% 15% 9% 57% 14% 4% 13% 10% 55% 18% 5% 13% 10% 56% 16% R$ 224 billion R$ 555 billion R$ 396 billion R$ 2,296 billion R$ 672 billion Total GDP: R$ 4,143 billion Total Retail Sales: R$ 2,351 billion Total Number of Shopping Centers: 492 Total GLA: 12,631,879 m² 21 66 50 269 86 560,407 m² 1,908,944 m² 1,183,653 m² 7,189,768 m² 1,789,106 m² Geographic Distribution GDP(1) Number of Shopping Centers(2) Retail Sales(1) GLA(2) (1) Source: IBGE 2011 (2) Source: ABRASCE – December 2013
  • 19.
    191919 658 16,214,978 Total GLA (m2) Numberof Shopping Centers Estimated to 2016 Source: Alshop Directory, ABRASCE Directory and Companies Prepared by General Shopping Brasil
  • 20.
    202020 88,962 98,822 19,696 17,919 37,420 50,131 176,029 488,979 Dec/06 Dec/07Dec/08 Dec/09 Dec/11 Dec/12 2013/2014 TOTAL GLA Total GLA Evolution (m2) Portfolio Pre IPO
  • 21.
    212121 Diversified Growth Strategy Consolidation Shopping center acquisitions Greenfields  Concept and development of new shopping centers Expansions  Interest stake increase in assets  GLA expansion of the original portfolio  Implementation of mixed-use projects  Synergies + Profitability Turnaround  Remodeling and retrofit of tenant mix  Innovation in complementary services (1) Considering current shopping centers, expansions and announced greenfields. Concluded Greenfields Acquisitions Expansions Greenfields under Development Own GLA(1) Own GLA(1) 40.6% 23.8%9.9% 25.7%
  • 22.
    222222 Poli Shopping Guarulhos Type:Downtown Community Center City/State: Guarulhos/SP Stake: 50.0% Total GLA: 4,527 m² Own GLA: 2,264 m² Number of Stores: 52 Poli Shopping Guarulhos
  • 23.
    232323 Internacional Shopping Guarulhos Type:Regional City/State: Guarulhos/SP Stake: 100.0% Total GLA: 76,845 m² Own GLA: 76,845 m² Number of Stores: 292 Internacional Shopping Guarulhos
  • 24.
    242424 Type: Thematic City/State: Guarulhos/SP Stake:100.0% Total GLA: 11,477 m² Own GLA: 11,477 m² Number of Stores: 71 Auto Shopping Auto Shopping
  • 25.
    252525 Shopping Light Type: DowntownCommunity Center City/State: São Paulo/SP Stake: 85.0% Total GLA: 14,140 m² Own GLA: 12,019 m² Number of Stores: 134 Shopping Light
  • 26.
    262626 Santana Parque Shopping Type:Neighborhood City/State: São Paulo/SP Stake: 50.0% Total GLA: 26,538 m² Own GLA: 13,269 m² Number of Stores: 174 Santana Parque Shopping
  • 27.
    272727 Suzano Shopping Type: Neighborhood City/State:Suzano/SP Stake: 100.0% Total GLA: 19,583 m² Own GLA: 19,583 m² Number of Stores: 174 Suzano Shopping
  • 28.
    282828 Cascavel JL Shopping Type:Neighborhood City/State: Cascavel/PR Stake: 85.5% Total GLA: 8,877 m² Own GLA: 7,590 m² Number of Stores: 74 Cascavel JL Shopping
  • 29.
    292929 Top Center ShoppingSão Paulo Type: Downtown Community Center City/State: São Paulo/SP Stake: 100.0% Total GLA: 6,369 m² Own GLA: 6,369 m² Number of Stores: 67 Top Center Shopping São Paulo
  • 30.
    303030 Parque Shopping Prudente ParqueShopping Prudente Type: Neighborhood City/State: Presidente Prudente/SP Stake: 100.0% Total GLA: 15,148 m² Own GLA: 15,148 m² Number of Stores: 68
  • 31.
    313131 Poli Shopping Osasco Type:Downtown Community Center City/State: Osasco/SP Stake: 100.0% Total GLA: 3,218 m² Own GLA: 3,218 m² Number of Stores: 13 Poli Shopping Osasco
  • 32.
    323232 Shopping do Vale Type:Neighborhood City/State: Cachoeirinha/RS Stake: 84.4% Total GLA: 16,487 m² Own GLA: 13,913 m² Number of Stores: 103 Shopping do Vale
  • 33.
    333333 Unimart Shopping Campinas UnimartShopping Campinas Type: Open Lifestyle Center City/State: Campinas/SP Stake: 100.0% Total GLA: 14,961 m² Own GLA: 14,961 m² Number of Stores: 132 Description: Developed under the concept of Lifestyle. Unimart is an open mall that combines commerce and convenience stores. The range of stores is organized on wide corridors in harmony with surrounding convenience outdoors, providing a pleasant environment to customers and reduced operating costs for tenants.
  • 34.
    343434 Outlet Premium SãoPaulo Outlet Premium São Paulo Type: Outlet Center City/State: Itupeva/SP Stake: 50.0% Total GLA: 17,716 m² Own GLA: 8,858 m² Number of Stores: 96 Influence area: Super Regional Description: First outlet of the country. Entrance for main brands with outlet operations. Located on the highway which connects São Paulo capital to the Campinas metropolitan region. Power center comprising hotel and 2 theme parks. Initiative: Sales channel for remainder merchandise with occupancy costs suitable to the off-price operation.
  • 35.
    353535 Parque Shopping Barueri ParqueShopping Barueri Type: Regional City/State: Barueri /SP Stake: 48.0% Total GLA: 37,420 m² Own GLA: 17,962 m² Number of Stores: 174
  • 36.
    363636 Outlet Premium Brasília OutletPremium Brasília Type: Outlet Center City/State: Alexânia/GO Stake: 50.0% Total GLA: 16,094 m² Own GLA: 8,047 m² Number of Stores: 73 Influence area: Super Regional Description: Second Outlet developed in the country. Located on the highway which connects Brasília (country capital) to Goiânia (Goiás state capital), the two biggest cities in midwestern states.
  • 37.
    373737 Shopping Bonsucesso Shopping Bonsucesso Type:Neighborhood City/State: Guarulhos/SP Stake: 63.5% Total GLA: 24,437 m2 Own GLA: 15,517 m2 Number of Stores: 132
  • 38.
    383838 Outlet Premium Salvador OutletPremium Salvador Type: Outlet Center City/State: Camaçari/BA Stake: 50.0% Total GLA: 14,964 m2 Own GLA: 7,482 m2 Number of Stores: 71 Influence area: Super Regional Description: Third Outlet from General Shopping Brasil, opened in October 2013. Located next to Salvador, the biggest city in northeastern states, on the road to the tourism resorts.
  • 39.
    393939 Parque Shopping Sulacap ParqueShopping Sulacap Type: Neighborhood City/State: Rio de Janeiro/RJ Stake: 51.0% Total GLA: 29,059 m2 Own GLA: 14,820 m2 Number of Stores: 170 Description: Opened in October, 2013.
  • 40.
    404040 Outlet Premium Riode Janeiro Outlet Premium Rio de Janeiro - Greenfield Type: Outlet Center City/State: Duque de Caxias/RJ Stake: 98% Estimated Total GLA: 32,000 m2 Estimated Own GLA : 31,360 m2 Influence area (inhabitants): Super Regional Description: Fourth outlet from the Company. Located near the city of Rio de Janeiro, with easy access to the city of Rio de Janeiro, the mountainous region of Rio de Janeiro state, Galeão and Santos Dumont airports and close to the future metropolitan road arc.
  • 41.
    414141 Parque Shopping Maia ParqueShopping Maia- Greenfield Type: Neighborhood City/State: Guarulhos/SP Stake: 60.0% Total GLA: 30,492 m2 Own GLA: 18,295 m2 Description: expected to be opened in 2014
  • 42.
    424242 Parque Shopping Atibaia ParqueShopping Atibaia - Greenfield Type: Neighborhood City/State: Atibaia/SP Stake: 100.0% Total GLA: 24,043 m2 Own GLA: 24,043 m2 Description: expected to be opened in 2014
  • 43.
    434343 ISG    Auto     Poli     Light     Santana *    Cascavel     Prudente Parque     Poli Shopping Osasco   Top Center   Do Vale     Unimart Campinas     Suzano     Outlet Premium São Paulo     Parque Shopping Barueri     Outlet Premium Brasília     Shopping Bonsucesso     Outlet Premium Salvador     Parque Shopping Sulacap     Atlas Energy Wass I Park and GSPark GSB Adm ASG Adm Stake Held 100% 100% 100% 100% 100% ► Responsible for planning the energy supply and leasing of the equipment for its transmission and distribution ► Engaged in water supply planning and its treatment and distribution ► Controls and manages parking lots ► Manages operations of shopping centers ► Manages the operations of Auto Shopping Management Parking Water Energy Services currently provided to the mall  Potential services / currently being implemented  * Partial Increasing Complementary Services Activities
  • 44.
  • 45.
    454545 64,685 22,90213,294 4,231 6,394 17,971 91,672 65,52766,365 42,790 59,840 102,614 64,746 278,611 150,268 92,470 156,813 122,759 58,566 45,608 86,80486,136 56,068 574712 568 809 1,105 1,886 6,263 5,254 3,911 3,236 3,077 5,945 4,545 12,625 13,164 8,196 13,391 13,561 6,569 5,864 6,660 11,284 6,810 1Q08 2Q08 3Q08 4Q08 1Q09 2Q09 3Q09 4Q09 1Q10 2Q10 3Q10 4Q10 1Q11 2Q11 3Q11 4Q11 1Q12 2Q12 3Q12 4Q12 1Q13 2Q13 3Q13 Trading Volume Number of Trades GSHP3 Volume (R$ thousand) Liquidity
  • 46.
    464646 Shareholders (*) Position asof December 5, 2013 59.4% 40.6% Free float Controlling shareholder Nr. Shares Type of investor (*) Controlling shareholder 30,000,000 - 40.5% - Brazilian 56.3% - Foreign 3.2% - Individual Total 50,480,600 - Free float 20,480,600 Listed since July 2007
  • 47.
  • 48.
    484848 Gross Revenue, NOIand Adjusted EBITDA 1Q12 2Q12 3Q12 4Q12 1Q13 2Q13 3Q13 Gross Revenue 40.9 44.1 49.7 61.5 54.5 57.7 58.0 NOI 33.5 35.6 41.2 48.5 43.5 46.0 46.3 Adjusted EBITDA 26.8 28.4 32.0 38.7 34.4 36.9 36.3 NOI Margin 88.0% 86.3% 89.0% 85.5% 87.2% 87.3% 87.8% Ebitda Margin 70.4% 68.7% 69.2% 68.3% 69.0% 70.0% 68.8%
  • 49.
    494949 Rental Gross Revenue RENTALREVENUE 1Q12 2Q12 3Q12 4Q12 1Q13 2Q13 3Q13 Minimum Rent 24.0 25.0 27.7 37.1 30.7 31.3 31.0 Percentage on Sales 2.9 3.7 4.3 7.3 4.0 5.1 4.7 Other (a) 5.1 5.4 6.0 2.2 6.6 6.9 8.1 Occupancy Rate 96.6% 96.4% 96.2% 96.7% 96.6% 96.7% 96.4% (a) Includes: Mall / Advertising, Key Money and Straight-lining Revenue
  • 50.
    505050 1.0 1.0 1.61.8 1.2 0.8 0.8 1.0 1.0 1.0 1.2 1.4 1.5 1.5 0.7 0.7 0.9 1.2 1.6 1.3 1.1 6.2 7.3 8.2 10.8 9.1 10.8 10.8 41.7 47.0 48.3 58.7 52.0 56.4 57.8 1Q12 2Q12 3Q12 4Q12 1Q13 2Q13 3Q13 R$ million Energy Water Management Parking Services (R$/m²) Services Gross Revenue SERVICES REVENUE 1Q12 2Q12 3Q12 4Q12 1Q13 2Q13 3Q13 Parking 6.2 7.3 8.2 10.8 9.1 10.8 10.8 Energy 1.0 1.0 1.6 1.8 1.2 0.8 0.8 Water 1.0 1.0 1.0 1.2 1.4 1.5 1.5 Management 0.7 0.7 0.9 1.2 1.6 1.3 1.1 Total 8.9 10.0 11.7 15.0 13.3 14.4 14.2
  • 51.
    515151 Performance Description 3Q12 3Q13Chg % 9M12 9M13 Chg % Average GLA (m2 ) 241,789 246,153 1.8% 222,589 252,100 13.3% Rent (R$/m2 ) 157.14 177.93 13.2% 467.48 509.33 8.9% Services (R$/m2 ) 48.30 57.83 19.7% 137.37 166.06 20.9% Total (R$/m2 ) 205.44 235.76 14.8% 604.85 675.39 11.7% GSB (Total)
  • 52.
    525252 EBITDA, FFO andAdjusted Net Result Data 1Q12 2Q12 3Q12 4Q12 1Q13 2Q13 3Q13 Adjusted EBITDA 26.8 28.4 32.0 38.7 34.4 36.9 36.3 Adjusted FFO 10.8 (73.4) (6.3) (3.5) (1.2) (71.2) (12.7) Adjusted Net Result 6.8 (77.4) (9.9) (8.1) (7.3) (77.0) (18.0) Financial Result (12.5) (93.4) (32.6) (37.7) (30.3) (100.1) (42.4) Income Taxes/Social Contribution (3.5) (8.4) (5.7) (4.6) (5.3) (10.1) (6.6)
  • 53.
    535353 Amortization Schedule 373.0 105.4 40.4 45.851.7 58.4 55.2 33.3 27.0 25.0 53.5 19.7 64.8 29.1 20.2 15.7 8.3 8.3 8.1 8.1 4.3 60.0 1.5 1.5 1.4 1.5 1.5 1.5 1.4 5.1 8.2 2014 2015 2016 2017 2018 2019 2020 2021 After 2021 Cash CCI Banks New Funding Perpetual Bonds 881.7 Cash X Debt (R$ million) 2013 75.4 75.4 297.6 1,572.2 373.0 1,647.6 Cash Pro Forma Debt Cash X Debt 54.2% 21.3% 11.3% 10.3% 1.2% 1.0% 0.7% USD IPCA TR CDI TJLP FIXED SELIC Indebtedness Breakdown * Cash Position and Indebtedness, considering the amounts of new funding of R$ 75.4 million. 2013 2014 2015 2016 2017 2018 2019 2020 2021 After 2021 Total % CCI 105.4 40.4 45.8 51.7 58.4 55.2 33.3 27.0 25.0 53.5 495.7 30.1% Banks 19.7 64.8 29.1 20.2 15.7 8.3 8.3 8.1 8.1 4.3 186.6 11.3% New Funding - 60.0 1.5 1.5 1.4 1.5 1.5 1.5 1.4 5.1 75.4 4.6% Perpetual Bonds 8.2 - - - - - - - - 881.7 889.9 54.0% Total 133.3 165.2 76.4 73.4 75.5 65.0 43.1 36.6 34.5 944.6 1,647.6 100.0% Amortization Schedule
  • 54.
    545454 49.2% 23.5% 12.6% 11.4% 1.4% 1.1%0.8% USD IPCA TR CDI TJLP FIXED SELIC Indebtedness Breakdown * Considering 50% of the Subordinated Perpetual Bonds’ balance as Equity, amounting to R$ 163.8 million. Include loans related to the Subsequent Events, amounting R$ 75.4 million Cash X Debt (R$ million) According to Rating Agencies' Criteria* 75.4 75.4 297.6 1,408.4 373.0 1,483.8 Cash Debt Cash X Debt
  • 55.
    555555 Investment Properties- R$million 926.4 1,488.9 694.3 Investments Properties Book Value Adjustmentsto Fair Value(Operational Assets) Constructionsin Progress 2,415.4 (1) 3,109.7 (2) (1) Total valueof investmentproperties (mallsinoperation) accordingto the ValuationReportofCB Richard Ellison basisdate 12/31/2012. The average rate of discountto the cash flowwas 8.99%. (2) Total valueof investmentproperties andloan value,considering constriuctioninprogress.
  • 56.
  • 57.
    575757 GSB INVESTOR RELATIONS AlessandroPoli Veronezi IR Officer Marcio Snioka IR Superintendent 55 11 3159-5100 dri@generalshopping.com.br www.generalshopping.com.br Contacts