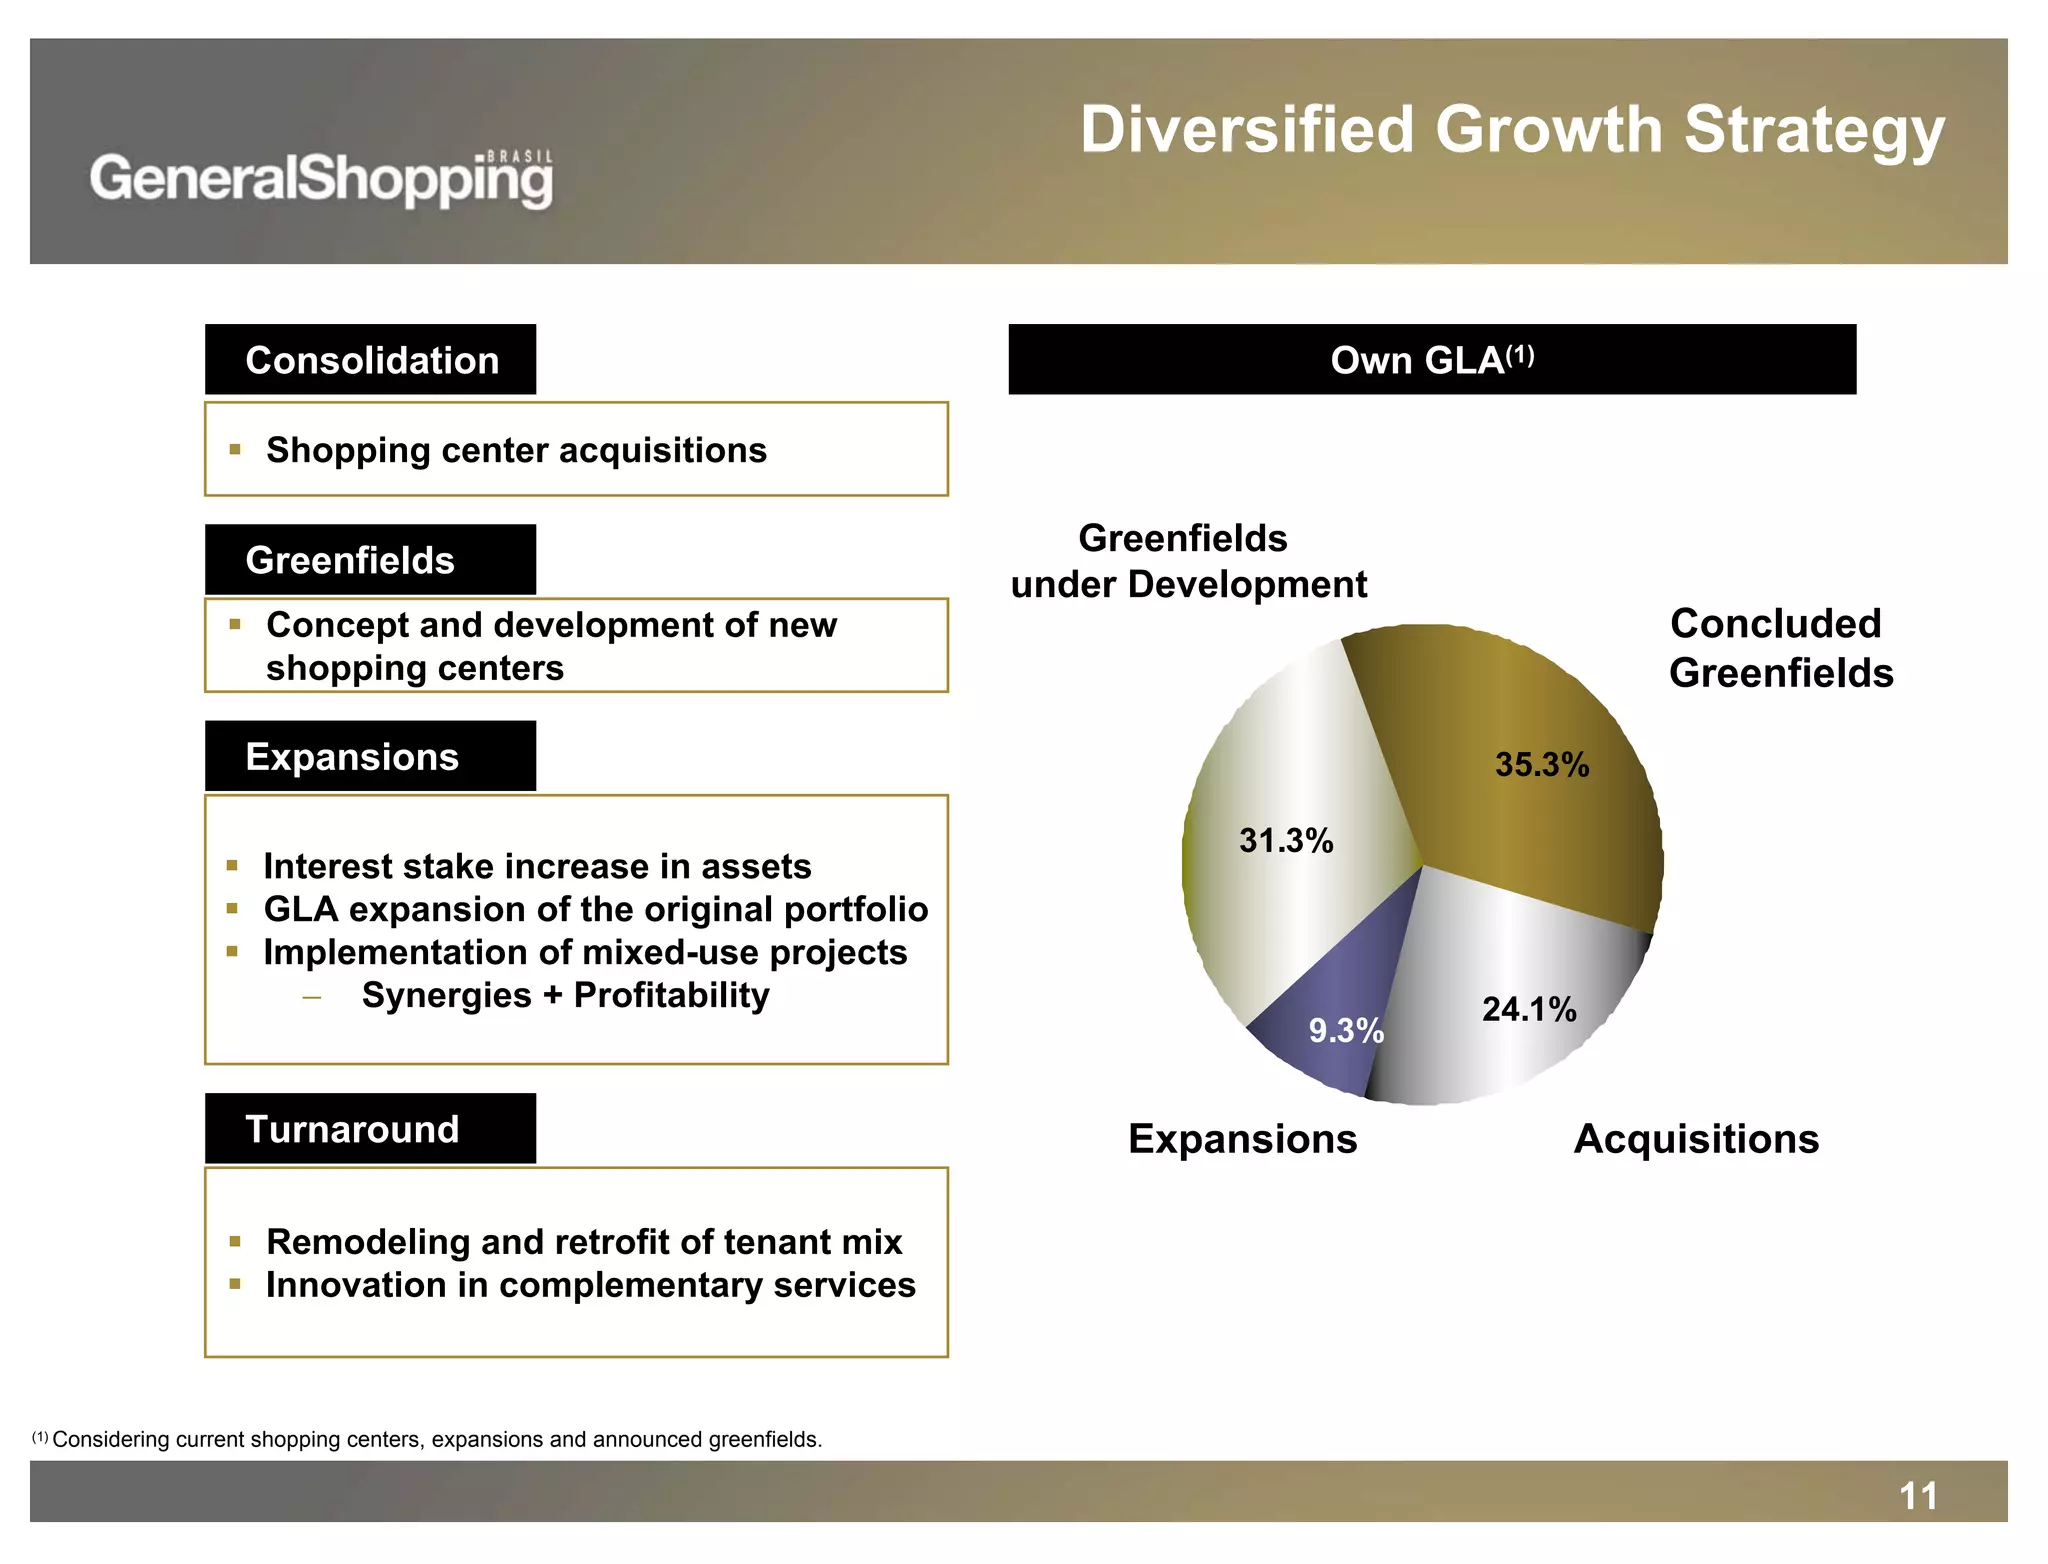
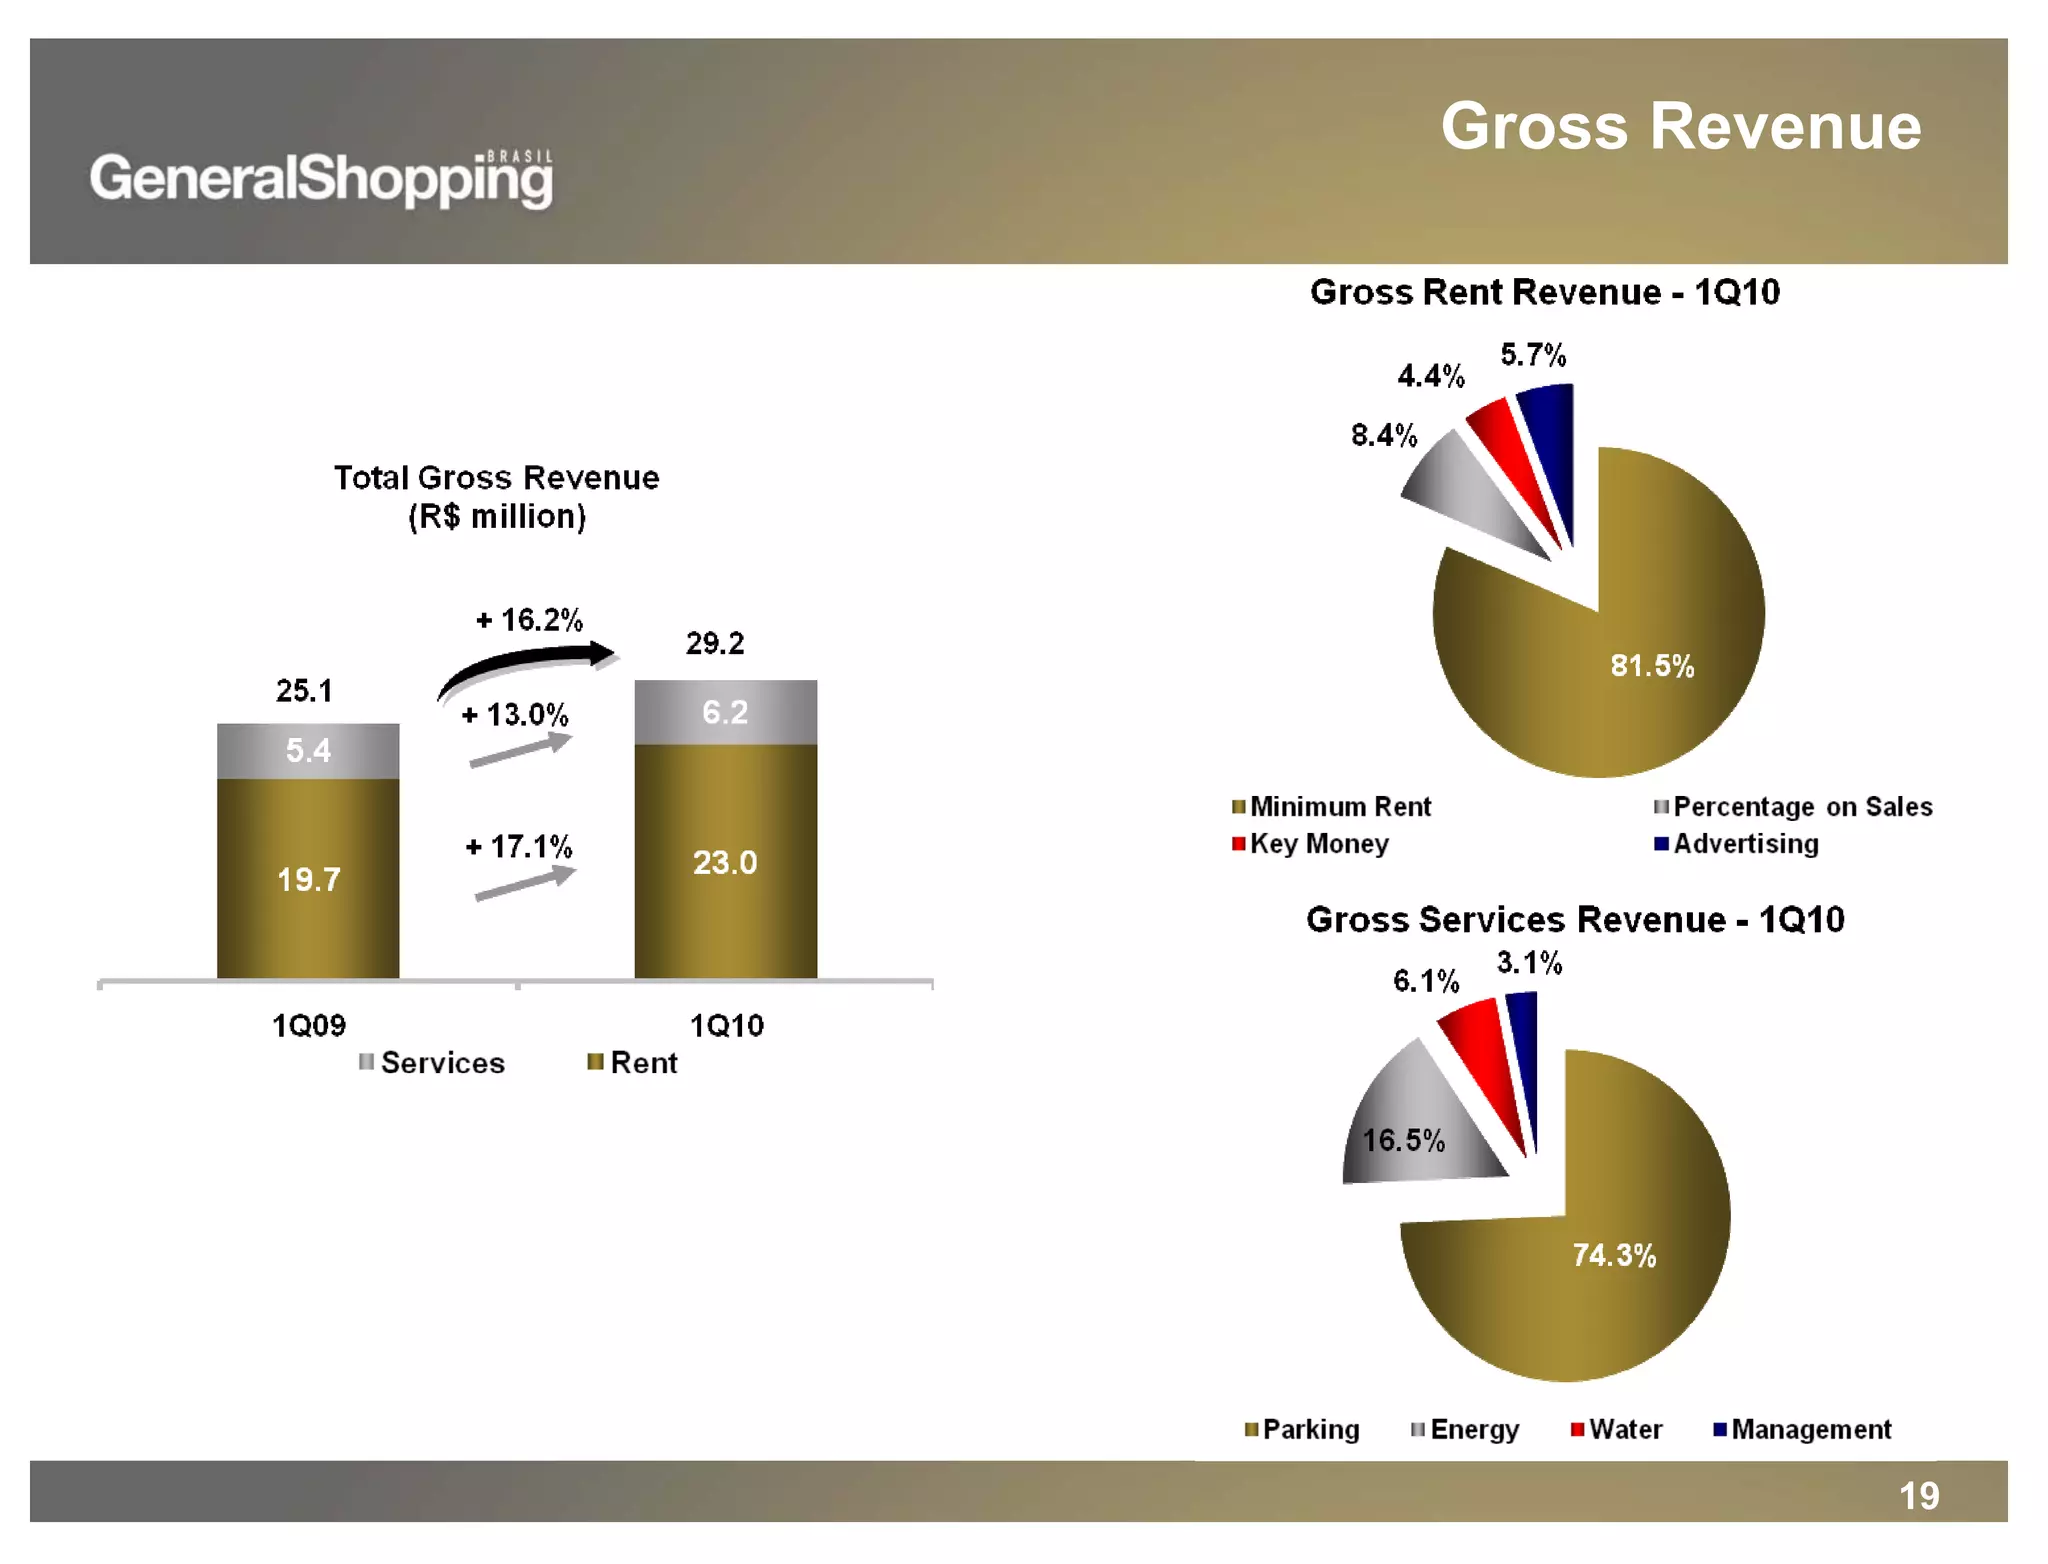
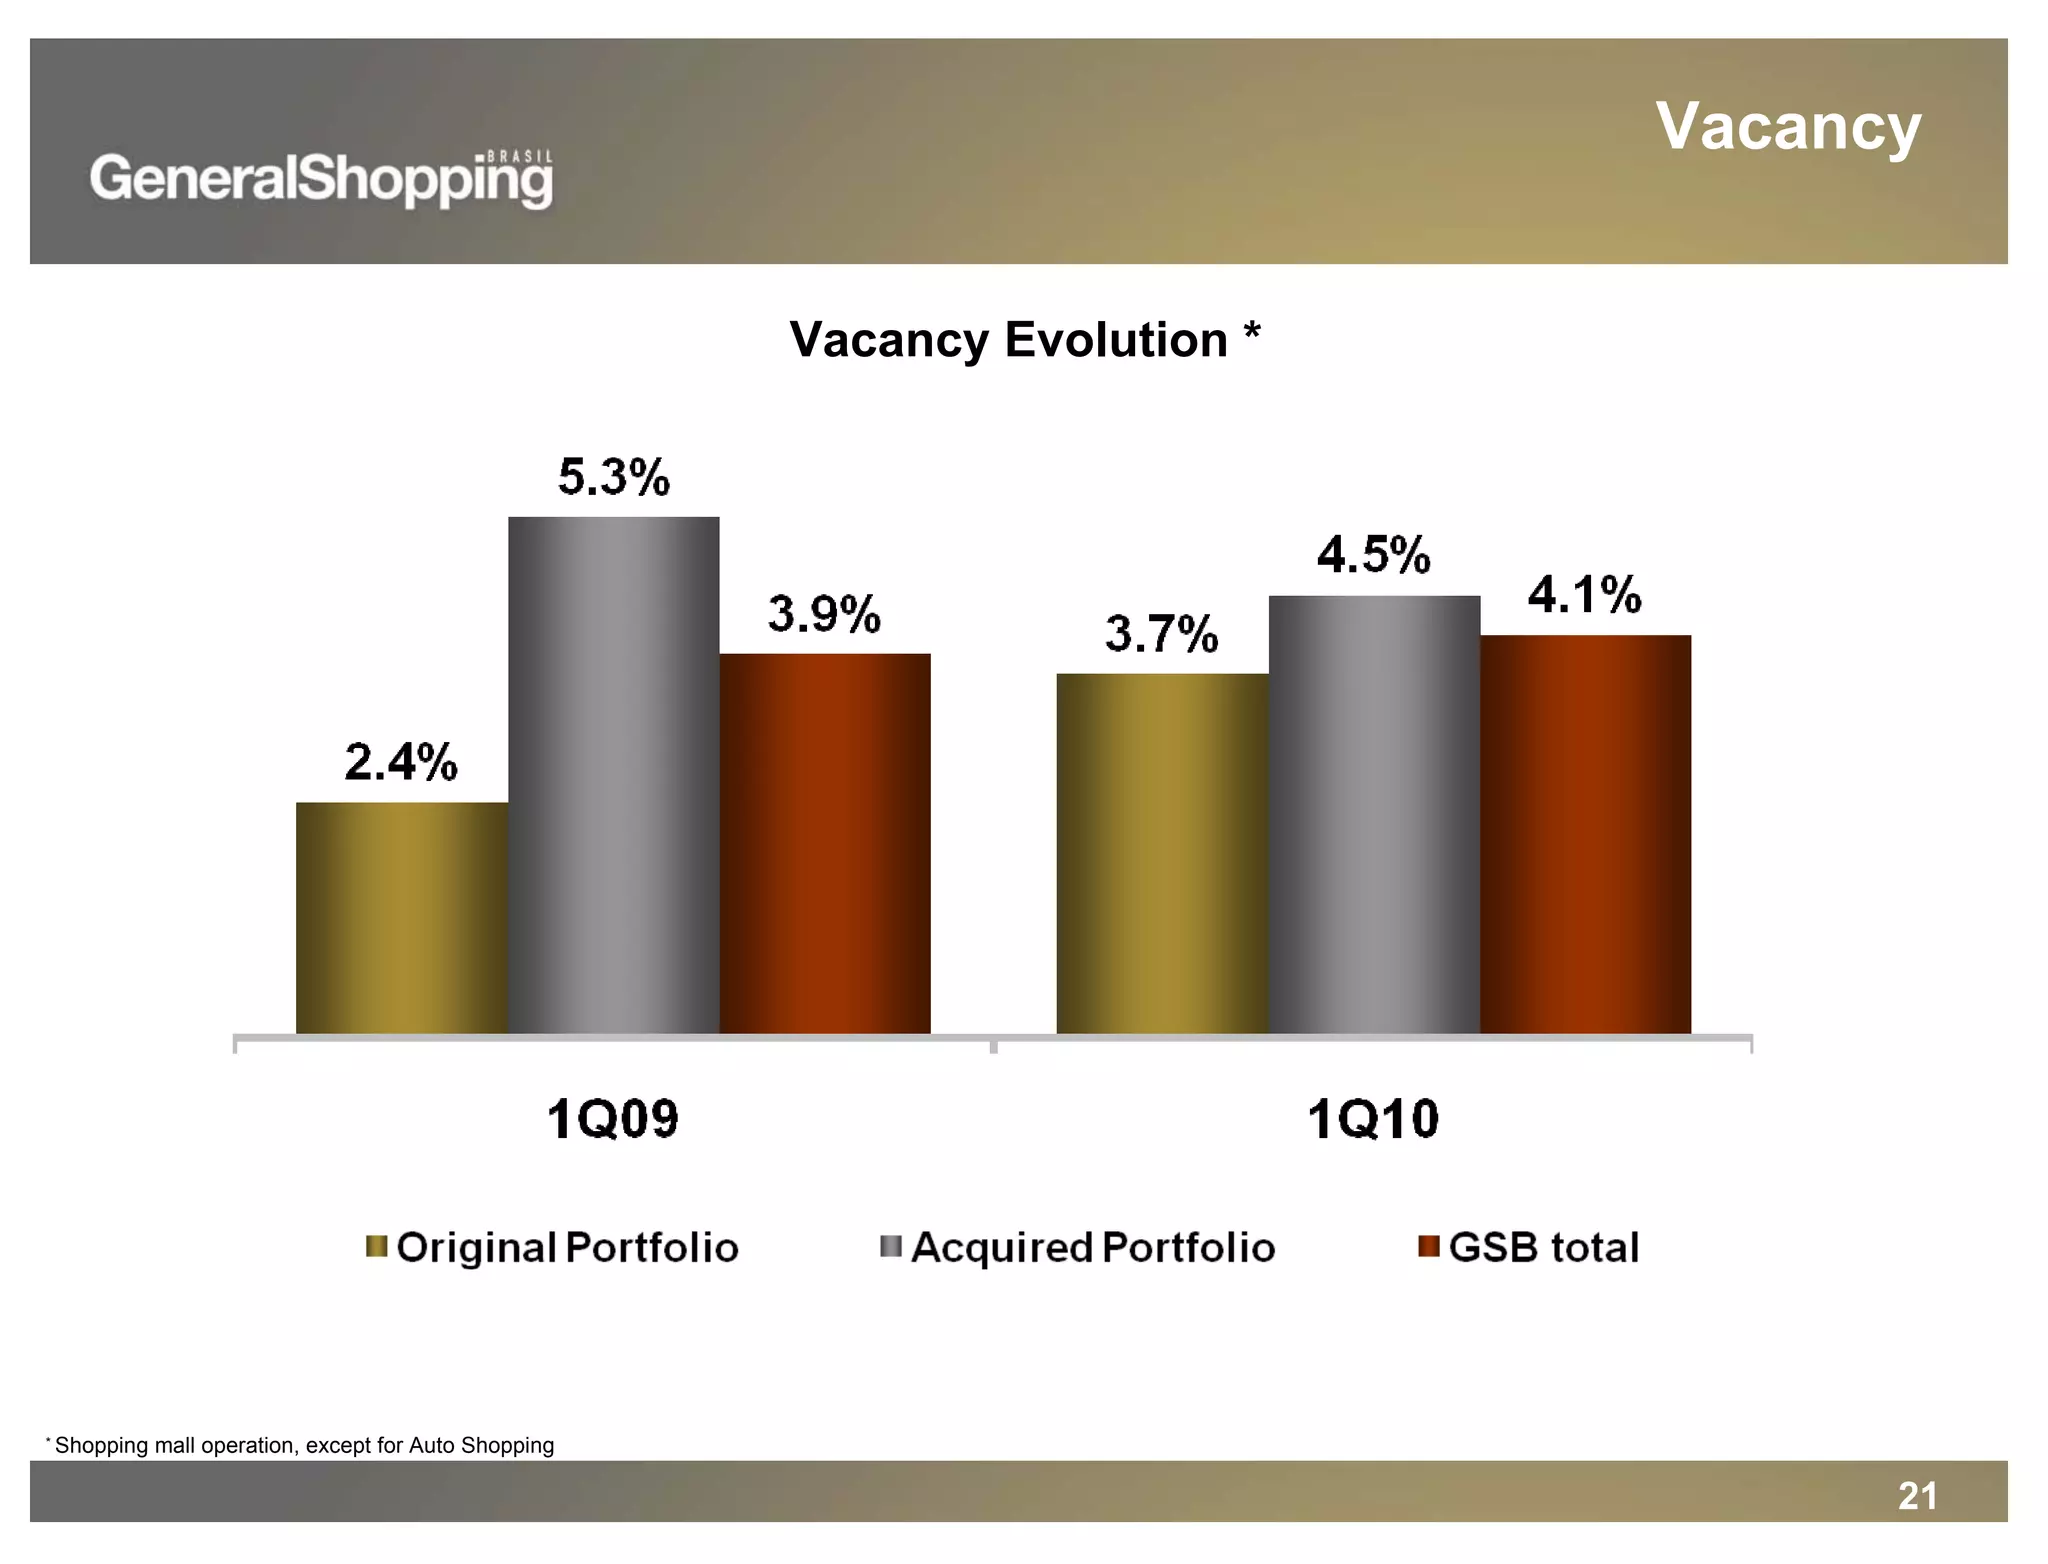
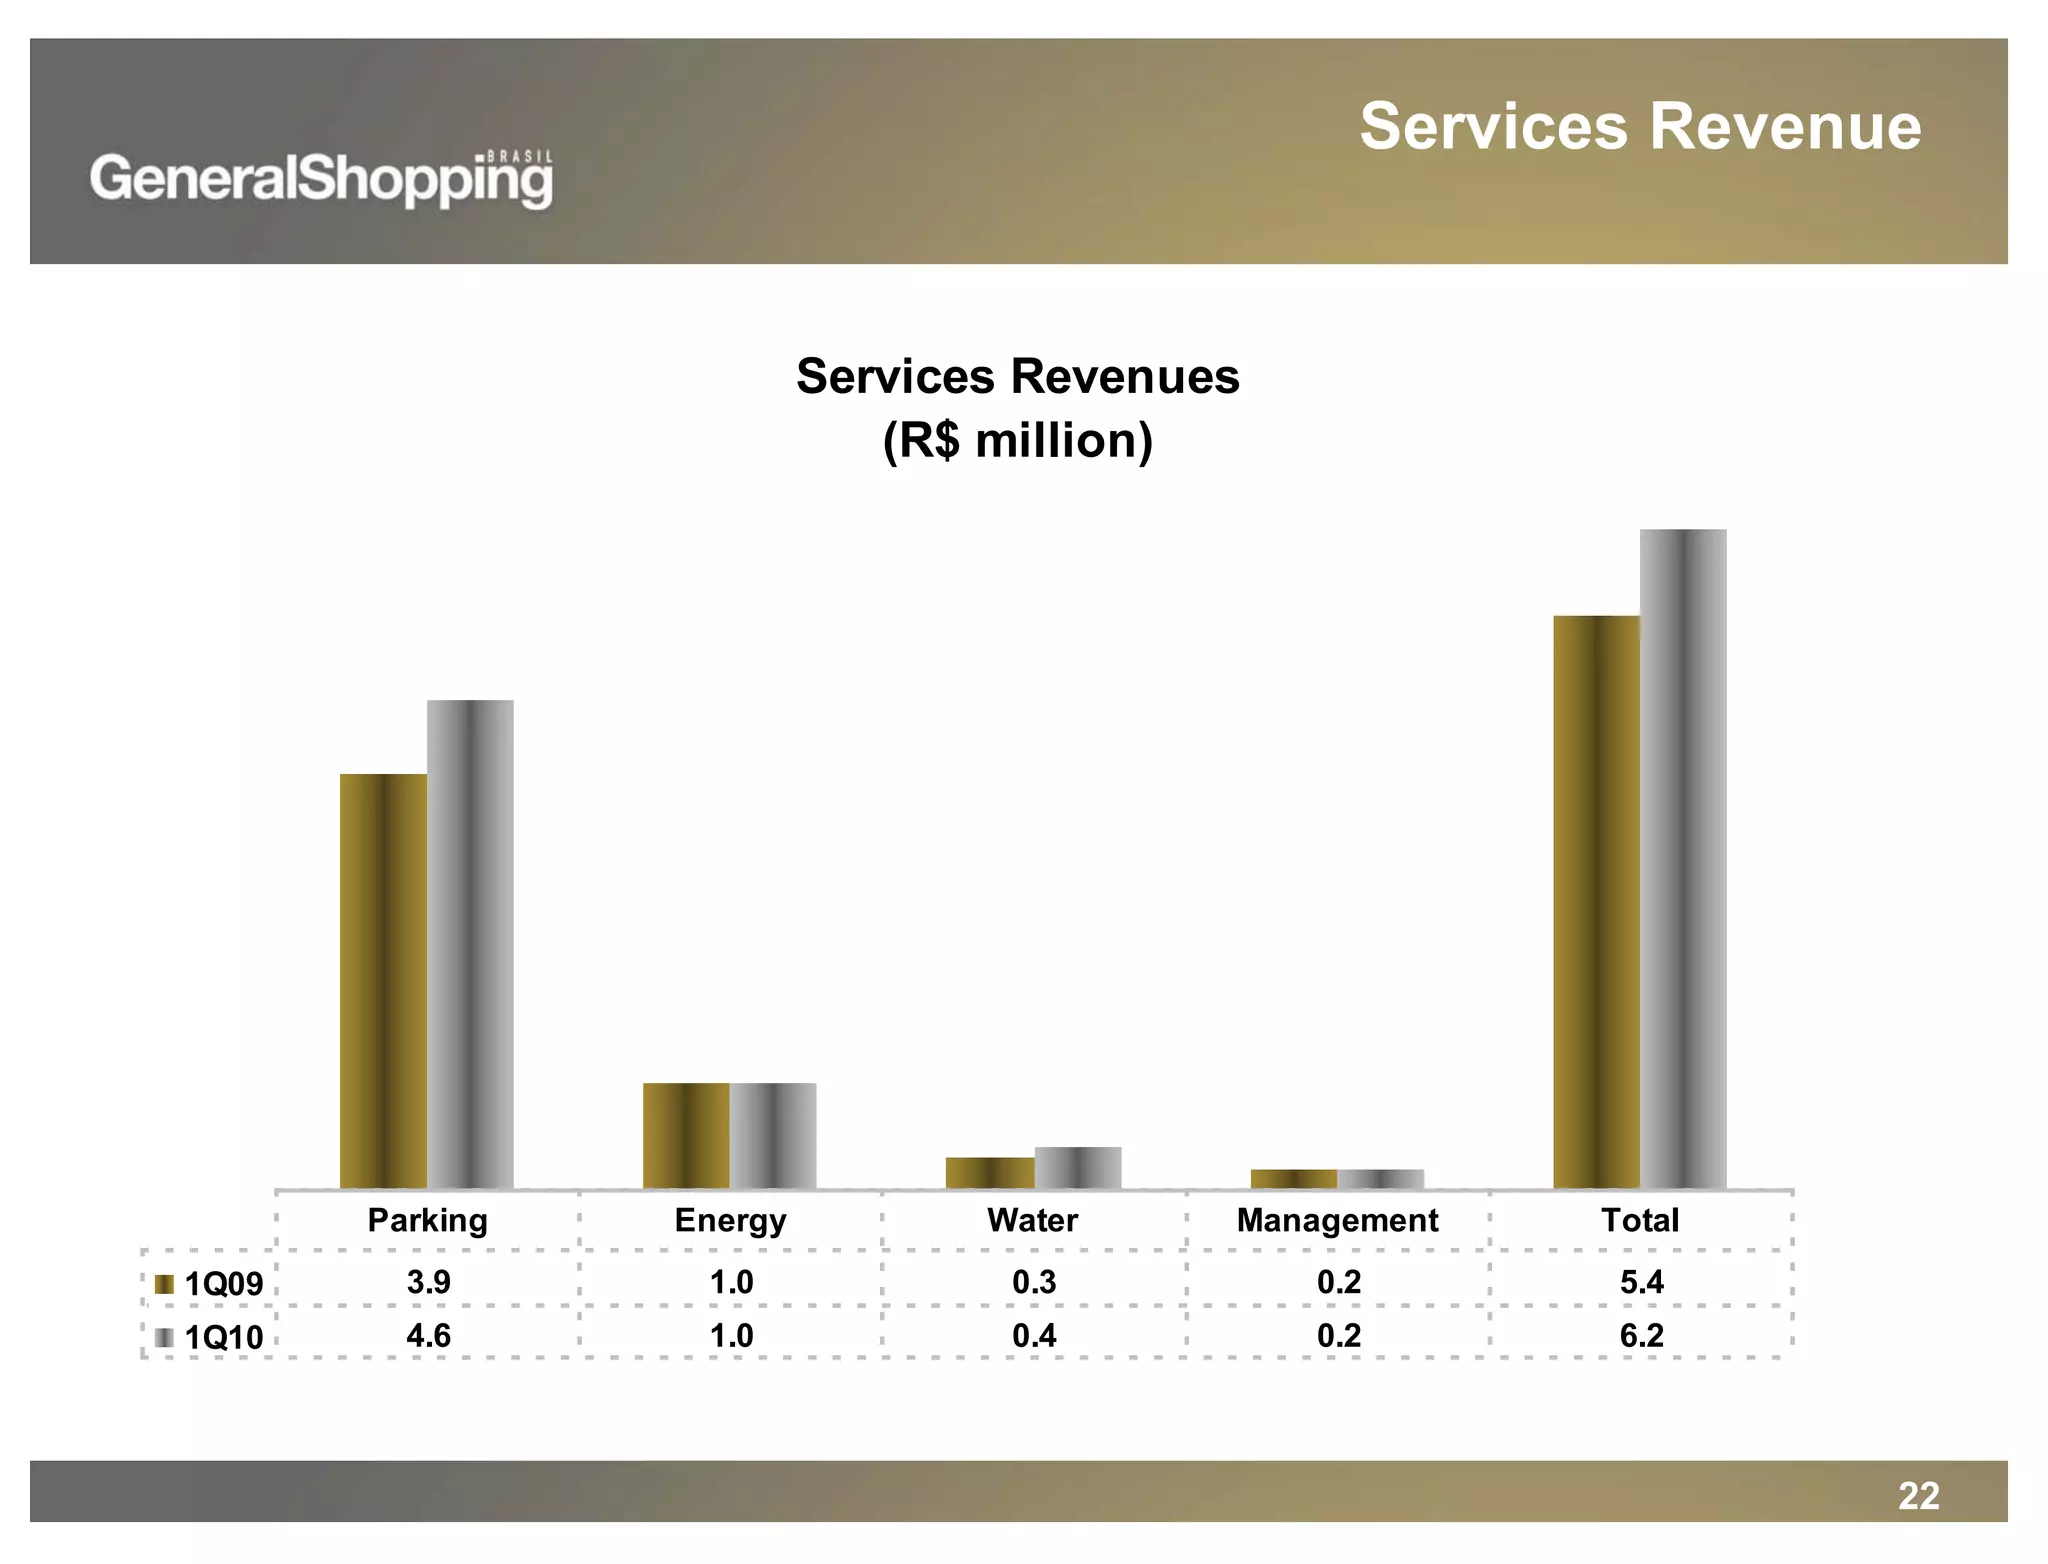
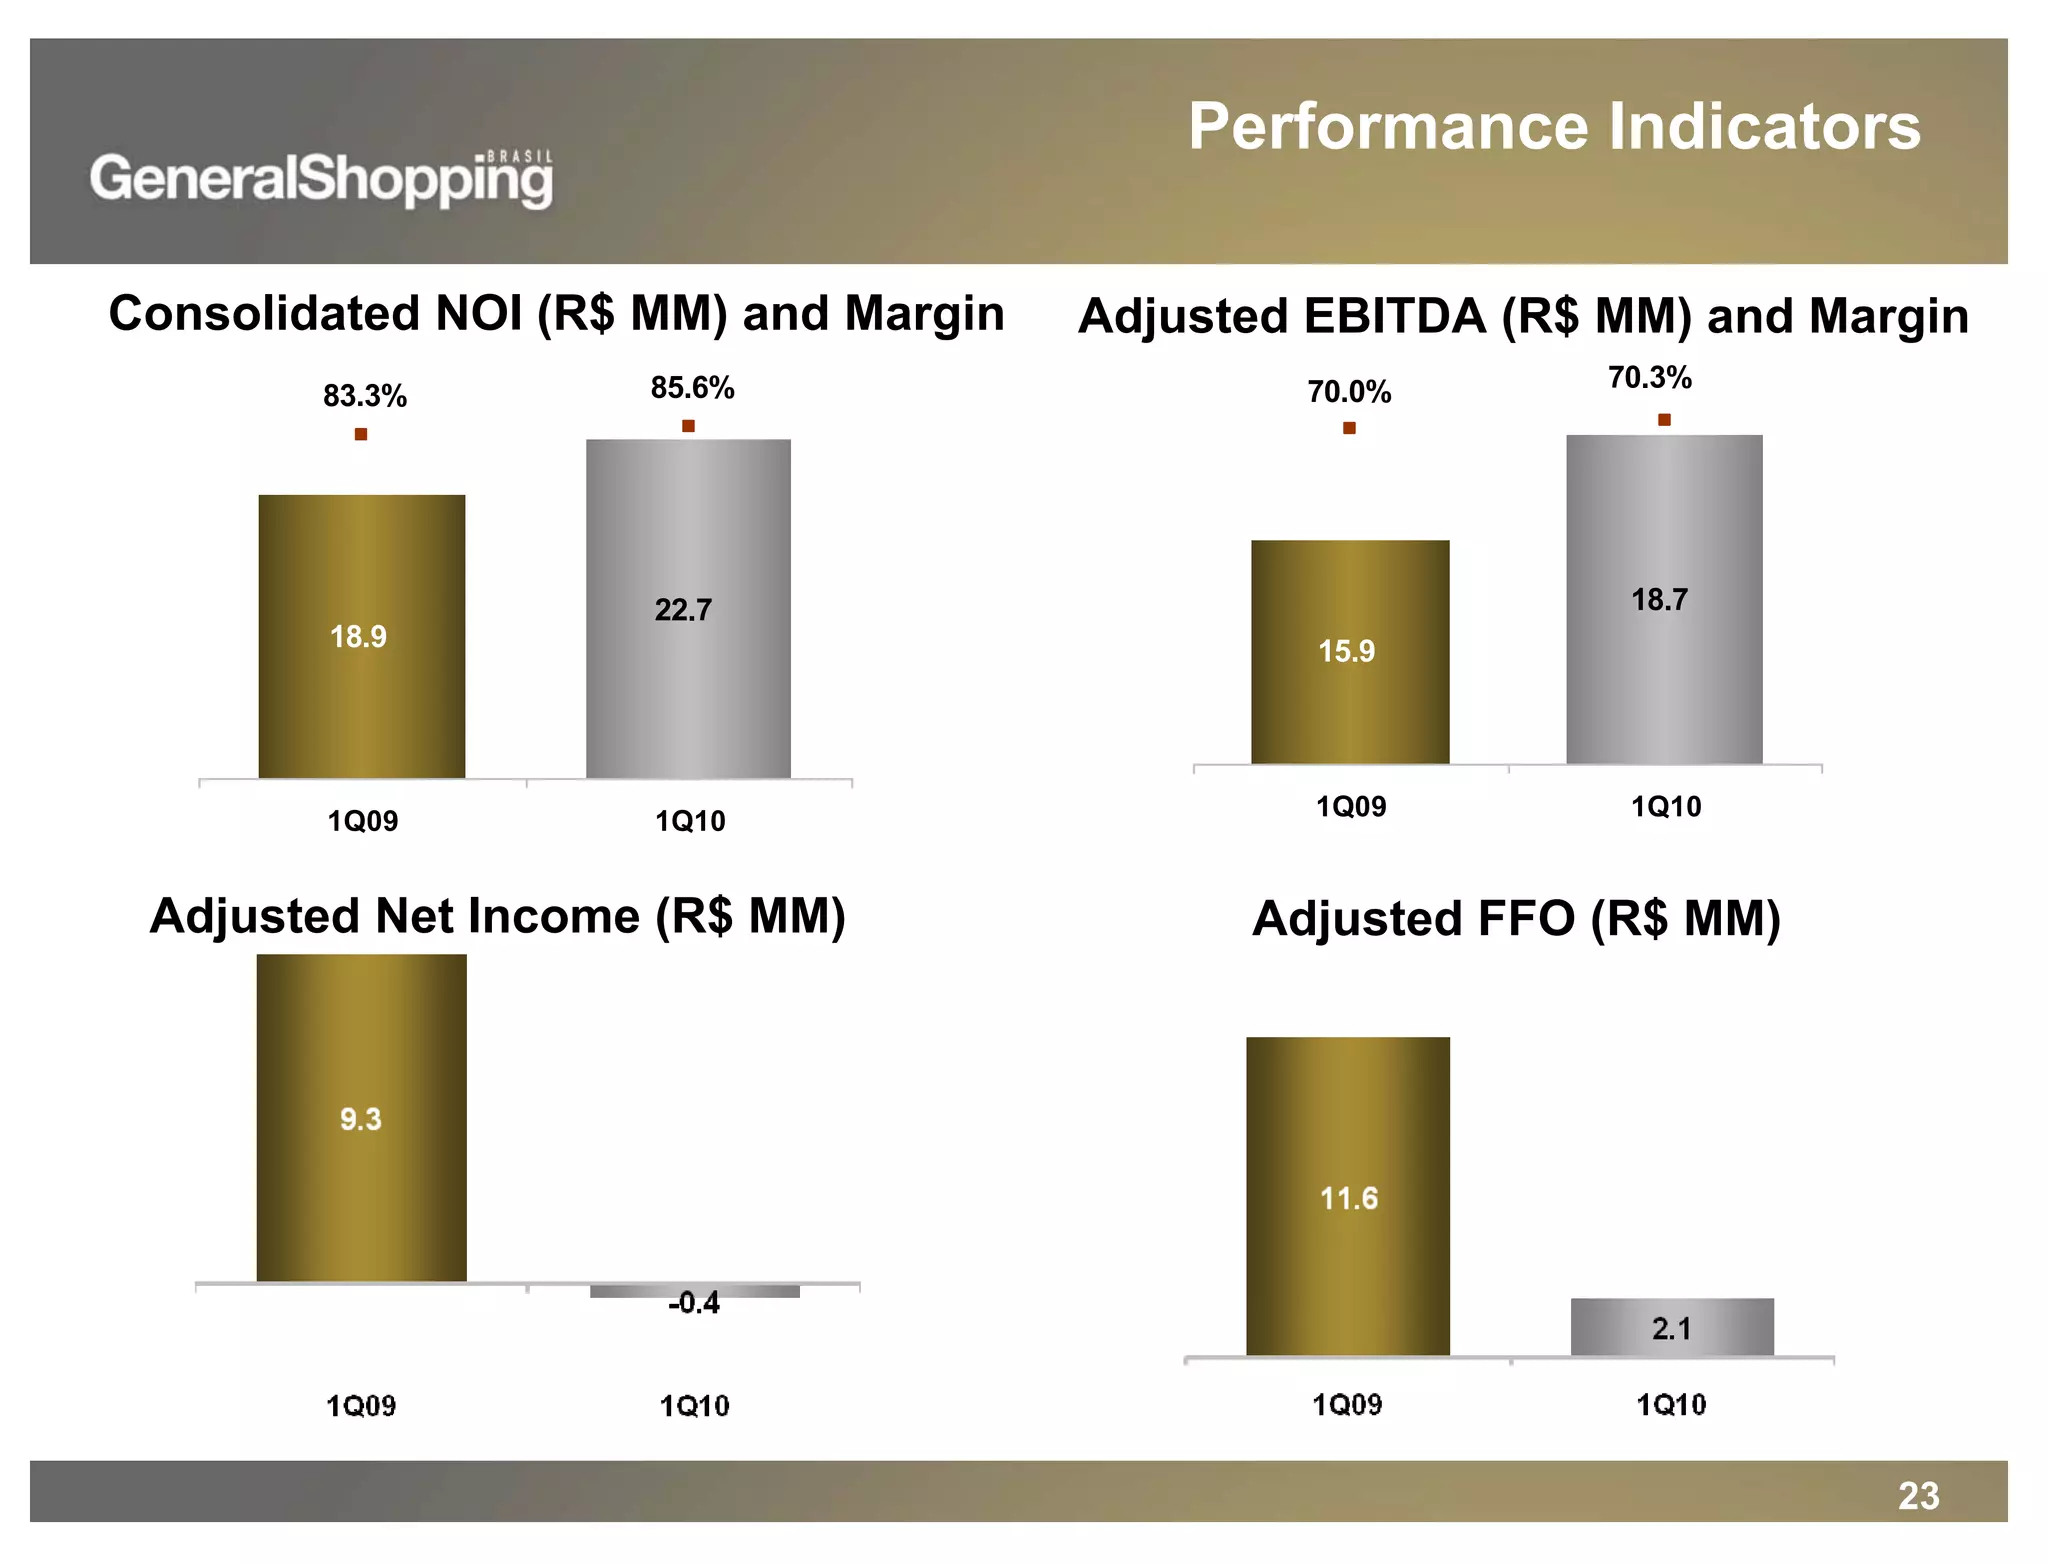
0
1Q10 Earnings
1
Disclaimer
This presentation contains statements that are forward-looking within the meaning of Section 27A of
the Securities Act of 1933 and Section 21E of the Securities Exchange Act of 1934. Such forward-
looking statements are only predictions and are not guarantees of future performance. Investors are
cautioned that any such forward-looking statements are and will be, as the case may be, subject to
many risks, uncertainties and factors relating to the operations and business environments of
General Shopping and its subsidiaries that may cause the actual results of the companies to be
materially different from any future results expressed or implied in such forward-looking statements.
This material is published solely for informational purposes and is not to be construed as a
solicitation or an offer to buy or sell any securities or related financial instruments and should not be
treated as giving investment advice. It is not targeted to the specific investment objectives, financial
situation or particular needs of any recipient. No representation or warranty, either express or
implied, is provided in relation to the accuracy, completeness or reliability of the information
contained herein. This material should not be regarded by recipients as a substitute for the exercise
of their own judgment.
Any opinions expressed in this material are expressed as of this date and subject to change without
notice and General Shopping is not under the obligation to update or keep current the information
contained herein. General Shopping and the respective affiliates, directors, partners and employees
accept no liability whatsoever for any loss or damage of any kind arising out of the use of all or any
part of this material. You should consult with your own legal, regulatory, tax, business, investment,
financial and accounting advisers to the extent that you deem it necessary, and make your own
investment, hedging and trading decision (including decisions regarding the suitability of this
transaction) based upon your own judgment and advice from such advisers as you deem necessary
and not upon any views expressed in this material.
2
Agenda
Sector Overview
Company Overview
Financial Performance
3
Sector Overview
4
Economic Indicators
Source: PME-IBGE
Table prepared by GSB
10.4% 10.2%
8.6% 9.0%
7.6%
mar/06 mar/07 mar/08 mar/09 mar/10
Unemployment Rate in March
5
Economic Indicators
Source: PME-IBGE; Table prepared by GSB
(1)Based on the employed population and average income of the employed population
25.5
27.6 27.6
29.2
30.7
mar/06 mar/07 mar/08 mar/09 mar/10
(R$ billion)
Real Income of the Employed Population (1)
6
Source: Fecomércio
Economic Indicators
Family Income
(Minimum Wages)
Consumer Confidence
Index
Consumer Expectations
Index
Present Situation Index
Up to 10 27.6% 26.5% 29.3%
Above 10 29.5% 29.5% 29.6%
Up to 10 19.9% 17.3% 23.9%
Above 10 21.3% 20.8% 22.1%
Feb/10 vs Feb/09
CONSUMER CONFIDENCE INDEX
Jan/10 vs Jan/09
Retail Growth
-15.0
-10.0
-5.0
0.0
5.0
10.0
15.0
20.0
25.0
Jan-09 7.0 (4.7) 6.3 8.9 6.0
F eb-09 5.7 (6.9) (2.1) 12.0 3.8
M ar-09 (0.2) (8.3) (0.9) 15.7 1.3
A pr-09 14.1 (9.6) (9.9) 11.3 7.1
M ay-09 6.7 (10.7) (6.1) 10.2 2.9
Jun-09 8.2 (1.0) (1.0) 12.6 5.7
Jul-09 10.1 (2.2) 0.5 14.2 6.0
A ug-09 8.5 (5.8) 0.6 14.0 4.8
Sep-09 9.7 (6.6) 1.9 8.2 5.1
Oct-09 12.2 3.9 3.5 12.4 8.6
N o v-09 8.2 4.8 13.8 11.3 8.6
D ec-09 9.8 6.1 13.3 10.8 9.2
Jan-10 10.2 2.3 17.7 10.3 10.4
F eb-10 11.5 11.8 22.2 15.5 12.3
Supermarkets and
hypermarkets
F abrics, clo thing and
fo o twear
F urniture and
white/ durable go o ds
P harmaceutical,
medical, o rtho pedic
and co smetics
T o tal
Retail Industry: Monthly Change (VS Same Year-Ago Period) of Sales Volume (Jan/09-Feb/10)
Source: Brazilian Institute of Geography and Statistics (IBGE)
-5.0
0.0
5.0
10.0
15.0
20.0
25.0
30.0
35.0
J a n- 0 9 2 3 .9 15 .4 5 .0 6 .0
F e b- 0 9 1.9 11.2 10 .5 3 .8
M a r- 0 9 10 .5 18 .0 4 .7 1.3
A pr- 0 9 ( 0 .3 ) 2 7 .6 14 .5 7 .1
M a y- 0 9 6 .9 5 .3 11.1 2 .9
J un- 0 9 4 .5 2 2 .4 11.8 5 .7
J ul- 0 9 12 .1 9 .7 7 .9 6 .0
A ug- 0 9 11.1 ( 0 .2 ) 7 .3 4 .8
S e p- 0 9 10 .0 2 .8 6 .3 5 .1
O c t - 0 9 13 .3 4 .4 9 .5 8 .6
N o v - 0 9 9 .0 18 .0 7 .3 8 .6
D e c - 0 9 9 .6 4 .0 6 .8 9 .2
J a n- 10 7 .0 3 2 .2 6 .0 10 .4
F e b- 10 10 .7 18 .8 5 .1 12 .3
B o o k s , ne ws pa pe rs ,
m a ga zine s a nd s t a t io ne ry
O f f ic e s upplie s a nd
e quipm e nt , pe rs o na l
c o m put e rs a nd t e le c o m
O t he r pe rs o na l a nd
do m e s t ic pro duc t s
T o t a l
Retail Growth
Source: Brazilian Institute of Geography and Statistics (IBGE)
Retail Industry: Monthly Change (VS Same Year-Ago Period) of Sales Volume (Jan/09-Feb/10)
9
Company Overview
10
Market-driven company with retail approachMarket-driven company with retail approach
B and C consumption classes as target marketB and C consumption classes as target market
Innovative complementary servicesInnovative complementary services
Majority ownership: 82.8% average interestMajority ownership: 82.8% average interest
Differentials
11
Own GLA(1)
35.3%
24.1%
9.3%
31.3%
Concluded
Greenfields
AcquisitionsExpansions
Greenfields
under Development
Consolidation
Shopping center acquisitions
Greenfields
Concept and development of new
shopping centers
Expansions
Interest stake increase in assets
GLA expansion of the original portfolio
Implementation of mixed-use projects
− Synergies + Profitability
Turnaround
Remodeling and retrofit of tenant mix
Innovation in complementary services
(1) Considering current shopping centers, expansions and announced greenfields.
Diversified Growth Strategy
12
General Shopping Brasil
(1) Considering a call option to acquire an additional 20.0% stake
Poli Shopping 50.0% 4,527 2,264 52 15,400
Internacional Shopping 100.0% 75,958 75,958 292 -
Auto Shopping 100.0% 11,477 11,477 80 -
Shopping Light 50.1% 14,140 7,092 134 -
Santana Parque Shopping 50.0% 26,538 13,269 176 -
Suzano Shopping 100.0% 19,583 19,583 174 -
Cascavel JL Shopping 85.5% 8,877 7,590 80 2,953
Top Center Shopping 100.0% 6,369 6,369 67 -
Prudente Parque Shopping 100.0% 10,276 10,276 56 -
Poli Shopping Osasco 100.0% 3,218 3,218 19 -
Shopping do Vale 84.4% 16,487 13,913 94 -
Shopping Unimart 100.0% 10,233 10,233 91 -
Outlet Premium São Paulo
(1)
30.0% 17,716 5,315 90 -
82.8% 225,399 186,557 1,405 18,353
Convention Center 100.0% 25,730 25,730
Sulacap Project 90.0% 32,000 28,800
Barueri Project 96.0% 25,000 24,000
94.9% 82,730 78,530
Shopping Center Interest
Total GLA
(m²)
Own GLA
(m²)
Nº
Stores
Own GLA
Expansion (m2
)
Greenfield Interest
Total GLA
(m²)
Own GLA
(m²)
13
GDP(1) Number of Shopping Centers (2)
Retail Sales (1) GLA(2)
Geographic Distribution
(1)Source: IBGE, 2006
(2)Source: ABRASCE, April 2009
R$ 38 billion
R$ 161 billion
R$ 101 billion
R$ 634 billion
R$ 231 billion
3%
14%
9%
54%
20%
3%
14%
8%
60%
15%
3%
13%
9%
55%
20%
5%
13%
9%
57%
16%
R$ 120 billion
R$ 311 billion
R$ 206 billion
R$ 1.346 billion
R$ 387 billion
Total GDP: R$ 2.370 billion
Total Retail Sales: R$ 1.165 billion
Total Number of Shopping Centers: 379
Total GLA: 8,735,468 m²
10
51
35
209
74
262,220 m²
1,213,918 m²
719,912 m²
5,219,190 m²
1,320,228 m²
14
136,743
107,984 104,780
41,288
165,054
General
Shopping
Brasil
Iguatemi Multiplan BR Malls Aliansce
9
11
6
5
4
General
Shopping
B rasil
B R M alls Iguat emi M ult iplan A liansce
Number of Shopping Center Operations Own GLA (m2)
Participation in São Paulo State
15
*
Atlas
Energy
Wass
I Park
GSB Adm
ASG Adm
Stake Held
100%
100%
100%
100%
100%
ISG
Auto
Poli
Light
Santana
Cascavel
Prudente
Parque
Poli Shopping
Osasco
Top Center
Do Vale
Unimart
Suzano
Services currently provided to the mall Potential services / currently being implemented
Increasing Complementary
Services Activities
Management Parking Water Energy
* Partial
► Responsible for planning the
energy supply and leasing of
the equipment for its
transmission and distribution
► Engaged in water supply
planning and its treatment
and distribution
► Controls and manages
parking lots
► Manages operations of
shopping centers
► Manages the operations of
Auto Shopping
Outlet Premium
São Paulo
16
(1): On 03/31/10
(2): On 05/06/10
Stock Performance
(100 base on 12/31/2008)
6 0 .0
110 .0
16 0 .0
2 10 .0
2 6 0 .0
3 10 .0
3 6 0 .0
4 10 .0
4 6 0 .0
510 .0
Jan-09
Feb-09
Mar-09
Apr-09
May-09
Jun-09
Jul-09
Jul-09
Aug-09
Sep-09
Oct-09
Nov-09
Dec-09
Jan-10
Feb-10
Mar-10
Apr-10
Ibovespa GSHP3
R$ 8.25
63,414
GSHP3: 281.14%(1); 261.84%(2)
Ibovespa: 74.86%(1); 57.57%(2)
Stock Performance
17
40.59%
59.41%
Free float Controlling Stake
No. shares
Controlling shareholder 29,990,000
Free float 20,490,600
Total 50,480,600
Market-making activities (through broker Ágora Senior) since October/07
Listed since July 2007
Shareholders
18
Financial Performance
19
Gross Revenue
20
Performance
Original Portfolio and Acquired Portfolio Evolution
1Q09 1Q10 Chg.
Original Portfolio
GLA (m²) 96,791 96,791 0.0%
Rent (R$/m²) 128.11 133.91 4.5%
Services (R$/m²) 36.61 36.58 ‐0.1%
Total (R$/m²) 164.71 170.49 3.5%
Acquired Portfolio
GLA (m²) 84,248 89,766 6.5%
Rent (R$/m²) 86.31 112.29 30.1%
Services (R$/m²) 22.36 28.87 29.1%
Total (R$/m²) 108.68 141.15 29.9%
Total GSB
GLA (m²) 181,039 186,557 3.0%
Rent (R$/m²) 108.66 123.50 13.7%
Services (R$/m²) 29.98 32.87 9.6%
Total (R$/m²) 138.64 156.37 12.8%
21
* Shopping mall operation, except for Auto Shopping
Vacancy
Vacancy Evolution *
22
Services Revenue
Services Revenues
(R$ million)
1Q09 3.9 1.0 0.3 0.2 5.4
1Q10 4.6 1.0 0.4 0.2 6.2
Parking Energy Water Management Total
23
Performance Indicators
Consolidated NOI (R$ MM) and Margin Adjusted EBITDA (R$ MM) and Margin
Adjusted Net Income (R$ MM) Adjusted FFO (R$ MM)
18.9
22.7
83.3% 85.6%
1Q09 1Q10
15.9
18.7
70.0% 70.3%
1Q09 1Q10
24
Indebtedness Breakdown
20.1%
23.6%52.2%
4.1%
CDI rate IGP-M rate TR rate Fixed
(*) On 5/7/10, CVM granted a registration for a public offer of Real Estate Receivables Certificates totaling approximately R$ 60 million.
Amortization Schedule
Cash X Debt
Cash X Debt
(R$ million)
(R$ million)
Amortization S chedule
R $ Millon 2010 2011 2012 2013 After 2013 Total %
C C I 10.5 18.8 21.6 21.8 177.3 250.0 75.8%
Other Banks 65.4 12.0 2.2 0.0 0.0 79.6 24.2%
Total 75.9 30.8 23.8 21.8 177.3 329.6 100.0%
C C I (*) 14.5 24.8 27.6 27.8 215.3 310.0 94.1%
Other Banks (*) 5.4 12.0 2.2 0.0 0.0 19.6 5.9%
Total 19.9 36.8 29.8 27.8 215.3 329.6 100.0%
25
GSB INVESTOR RELATIONS
Alessandro Poli Veronezi
Investor Relations Officer
Marcio Snioka
Investor Relations Manager
55 11 3159-5100
dri@generalshopping.com.br
www.generalshopping.com.br
Contacts

Apresentação 1Q10 EN

  • 1.
  • 2.
    1 Disclaimer This presentation containsstatements that are forward-looking within the meaning of Section 27A of the Securities Act of 1933 and Section 21E of the Securities Exchange Act of 1934. Such forward- looking statements are only predictions and are not guarantees of future performance. Investors are cautioned that any such forward-looking statements are and will be, as the case may be, subject to many risks, uncertainties and factors relating to the operations and business environments of General Shopping and its subsidiaries that may cause the actual results of the companies to be materially different from any future results expressed or implied in such forward-looking statements. This material is published solely for informational purposes and is not to be construed as a solicitation or an offer to buy or sell any securities or related financial instruments and should not be treated as giving investment advice. It is not targeted to the specific investment objectives, financial situation or particular needs of any recipient. No representation or warranty, either express or implied, is provided in relation to the accuracy, completeness or reliability of the information contained herein. This material should not be regarded by recipients as a substitute for the exercise of their own judgment. Any opinions expressed in this material are expressed as of this date and subject to change without notice and General Shopping is not under the obligation to update or keep current the information contained herein. General Shopping and the respective affiliates, directors, partners and employees accept no liability whatsoever for any loss or damage of any kind arising out of the use of all or any part of this material. You should consult with your own legal, regulatory, tax, business, investment, financial and accounting advisers to the extent that you deem it necessary, and make your own investment, hedging and trading decision (including decisions regarding the suitability of this transaction) based upon your own judgment and advice from such advisers as you deem necessary and not upon any views expressed in this material.
  • 3.
  • 4.
  • 5.
    4 Economic Indicators Source: PME-IBGE Tableprepared by GSB 10.4% 10.2% 8.6% 9.0% 7.6% mar/06 mar/07 mar/08 mar/09 mar/10 Unemployment Rate in March
  • 6.
    5 Economic Indicators Source: PME-IBGE;Table prepared by GSB (1)Based on the employed population and average income of the employed population 25.5 27.6 27.6 29.2 30.7 mar/06 mar/07 mar/08 mar/09 mar/10 (R$ billion) Real Income of the Employed Population (1)
  • 7.
    6 Source: Fecomércio Economic Indicators FamilyIncome (Minimum Wages) Consumer Confidence Index Consumer Expectations Index Present Situation Index Up to 10 27.6% 26.5% 29.3% Above 10 29.5% 29.5% 29.6% Up to 10 19.9% 17.3% 23.9% Above 10 21.3% 20.8% 22.1% Feb/10 vs Feb/09 CONSUMER CONFIDENCE INDEX Jan/10 vs Jan/09
  • 8.
    Retail Growth -15.0 -10.0 -5.0 0.0 5.0 10.0 15.0 20.0 25.0 Jan-09 7.0(4.7) 6.3 8.9 6.0 F eb-09 5.7 (6.9) (2.1) 12.0 3.8 M ar-09 (0.2) (8.3) (0.9) 15.7 1.3 A pr-09 14.1 (9.6) (9.9) 11.3 7.1 M ay-09 6.7 (10.7) (6.1) 10.2 2.9 Jun-09 8.2 (1.0) (1.0) 12.6 5.7 Jul-09 10.1 (2.2) 0.5 14.2 6.0 A ug-09 8.5 (5.8) 0.6 14.0 4.8 Sep-09 9.7 (6.6) 1.9 8.2 5.1 Oct-09 12.2 3.9 3.5 12.4 8.6 N o v-09 8.2 4.8 13.8 11.3 8.6 D ec-09 9.8 6.1 13.3 10.8 9.2 Jan-10 10.2 2.3 17.7 10.3 10.4 F eb-10 11.5 11.8 22.2 15.5 12.3 Supermarkets and hypermarkets F abrics, clo thing and fo o twear F urniture and white/ durable go o ds P harmaceutical, medical, o rtho pedic and co smetics T o tal Retail Industry: Monthly Change (VS Same Year-Ago Period) of Sales Volume (Jan/09-Feb/10) Source: Brazilian Institute of Geography and Statistics (IBGE)
  • 9.
    -5.0 0.0 5.0 10.0 15.0 20.0 25.0 30.0 35.0 J a n-0 9 2 3 .9 15 .4 5 .0 6 .0 F e b- 0 9 1.9 11.2 10 .5 3 .8 M a r- 0 9 10 .5 18 .0 4 .7 1.3 A pr- 0 9 ( 0 .3 ) 2 7 .6 14 .5 7 .1 M a y- 0 9 6 .9 5 .3 11.1 2 .9 J un- 0 9 4 .5 2 2 .4 11.8 5 .7 J ul- 0 9 12 .1 9 .7 7 .9 6 .0 A ug- 0 9 11.1 ( 0 .2 ) 7 .3 4 .8 S e p- 0 9 10 .0 2 .8 6 .3 5 .1 O c t - 0 9 13 .3 4 .4 9 .5 8 .6 N o v - 0 9 9 .0 18 .0 7 .3 8 .6 D e c - 0 9 9 .6 4 .0 6 .8 9 .2 J a n- 10 7 .0 3 2 .2 6 .0 10 .4 F e b- 10 10 .7 18 .8 5 .1 12 .3 B o o k s , ne ws pa pe rs , m a ga zine s a nd s t a t io ne ry O f f ic e s upplie s a nd e quipm e nt , pe rs o na l c o m put e rs a nd t e le c o m O t he r pe rs o na l a nd do m e s t ic pro duc t s T o t a l Retail Growth Source: Brazilian Institute of Geography and Statistics (IBGE) Retail Industry: Monthly Change (VS Same Year-Ago Period) of Sales Volume (Jan/09-Feb/10)
  • 10.
  • 11.
    10 Market-driven company withretail approachMarket-driven company with retail approach B and C consumption classes as target marketB and C consumption classes as target market Innovative complementary servicesInnovative complementary services Majority ownership: 82.8% average interestMajority ownership: 82.8% average interest Differentials
  • 12.
    11 Own GLA(1) 35.3% 24.1% 9.3% 31.3% Concluded Greenfields AcquisitionsExpansions Greenfields under Development Consolidation Shoppingcenter acquisitions Greenfields Concept and development of new shopping centers Expansions Interest stake increase in assets GLA expansion of the original portfolio Implementation of mixed-use projects − Synergies + Profitability Turnaround Remodeling and retrofit of tenant mix Innovation in complementary services (1) Considering current shopping centers, expansions and announced greenfields. Diversified Growth Strategy
  • 13.
    12 General Shopping Brasil (1)Considering a call option to acquire an additional 20.0% stake Poli Shopping 50.0% 4,527 2,264 52 15,400 Internacional Shopping 100.0% 75,958 75,958 292 - Auto Shopping 100.0% 11,477 11,477 80 - Shopping Light 50.1% 14,140 7,092 134 - Santana Parque Shopping 50.0% 26,538 13,269 176 - Suzano Shopping 100.0% 19,583 19,583 174 - Cascavel JL Shopping 85.5% 8,877 7,590 80 2,953 Top Center Shopping 100.0% 6,369 6,369 67 - Prudente Parque Shopping 100.0% 10,276 10,276 56 - Poli Shopping Osasco 100.0% 3,218 3,218 19 - Shopping do Vale 84.4% 16,487 13,913 94 - Shopping Unimart 100.0% 10,233 10,233 91 - Outlet Premium São Paulo (1) 30.0% 17,716 5,315 90 - 82.8% 225,399 186,557 1,405 18,353 Convention Center 100.0% 25,730 25,730 Sulacap Project 90.0% 32,000 28,800 Barueri Project 96.0% 25,000 24,000 94.9% 82,730 78,530 Shopping Center Interest Total GLA (m²) Own GLA (m²) Nº Stores Own GLA Expansion (m2 ) Greenfield Interest Total GLA (m²) Own GLA (m²)
  • 14.
    13 GDP(1) Number ofShopping Centers (2) Retail Sales (1) GLA(2) Geographic Distribution (1)Source: IBGE, 2006 (2)Source: ABRASCE, April 2009 R$ 38 billion R$ 161 billion R$ 101 billion R$ 634 billion R$ 231 billion 3% 14% 9% 54% 20% 3% 14% 8% 60% 15% 3% 13% 9% 55% 20% 5% 13% 9% 57% 16% R$ 120 billion R$ 311 billion R$ 206 billion R$ 1.346 billion R$ 387 billion Total GDP: R$ 2.370 billion Total Retail Sales: R$ 1.165 billion Total Number of Shopping Centers: 379 Total GLA: 8,735,468 m² 10 51 35 209 74 262,220 m² 1,213,918 m² 719,912 m² 5,219,190 m² 1,320,228 m²
  • 15.
    14 136,743 107,984 104,780 41,288 165,054 General Shopping Brasil Iguatemi MultiplanBR Malls Aliansce 9 11 6 5 4 General Shopping B rasil B R M alls Iguat emi M ult iplan A liansce Number of Shopping Center Operations Own GLA (m2) Participation in São Paulo State
  • 16.
    15 * Atlas Energy Wass I Park GSB Adm ASGAdm Stake Held 100% 100% 100% 100% 100% ISG Auto Poli Light Santana Cascavel Prudente Parque Poli Shopping Osasco Top Center Do Vale Unimart Suzano Services currently provided to the mall Potential services / currently being implemented Increasing Complementary Services Activities Management Parking Water Energy * Partial ► Responsible for planning the energy supply and leasing of the equipment for its transmission and distribution ► Engaged in water supply planning and its treatment and distribution ► Controls and manages parking lots ► Manages operations of shopping centers ► Manages the operations of Auto Shopping Outlet Premium São Paulo
  • 17.
    16 (1): On 03/31/10 (2):On 05/06/10 Stock Performance (100 base on 12/31/2008) 6 0 .0 110 .0 16 0 .0 2 10 .0 2 6 0 .0 3 10 .0 3 6 0 .0 4 10 .0 4 6 0 .0 510 .0 Jan-09 Feb-09 Mar-09 Apr-09 May-09 Jun-09 Jul-09 Jul-09 Aug-09 Sep-09 Oct-09 Nov-09 Dec-09 Jan-10 Feb-10 Mar-10 Apr-10 Ibovespa GSHP3 R$ 8.25 63,414 GSHP3: 281.14%(1); 261.84%(2) Ibovespa: 74.86%(1); 57.57%(2) Stock Performance
  • 18.
    17 40.59% 59.41% Free float ControllingStake No. shares Controlling shareholder 29,990,000 Free float 20,490,600 Total 50,480,600 Market-making activities (through broker Ágora Senior) since October/07 Listed since July 2007 Shareholders
  • 19.
  • 20.
  • 21.
    20 Performance Original Portfolio andAcquired Portfolio Evolution 1Q09 1Q10 Chg. Original Portfolio GLA (m²) 96,791 96,791 0.0% Rent (R$/m²) 128.11 133.91 4.5% Services (R$/m²) 36.61 36.58 ‐0.1% Total (R$/m²) 164.71 170.49 3.5% Acquired Portfolio GLA (m²) 84,248 89,766 6.5% Rent (R$/m²) 86.31 112.29 30.1% Services (R$/m²) 22.36 28.87 29.1% Total (R$/m²) 108.68 141.15 29.9% Total GSB GLA (m²) 181,039 186,557 3.0% Rent (R$/m²) 108.66 123.50 13.7% Services (R$/m²) 29.98 32.87 9.6% Total (R$/m²) 138.64 156.37 12.8%
  • 22.
    21 * Shopping malloperation, except for Auto Shopping Vacancy Vacancy Evolution *
  • 23.
    22 Services Revenue Services Revenues (R$million) 1Q09 3.9 1.0 0.3 0.2 5.4 1Q10 4.6 1.0 0.4 0.2 6.2 Parking Energy Water Management Total
  • 24.
    23 Performance Indicators Consolidated NOI(R$ MM) and Margin Adjusted EBITDA (R$ MM) and Margin Adjusted Net Income (R$ MM) Adjusted FFO (R$ MM) 18.9 22.7 83.3% 85.6% 1Q09 1Q10 15.9 18.7 70.0% 70.3% 1Q09 1Q10
  • 25.
    24 Indebtedness Breakdown 20.1% 23.6%52.2% 4.1% CDI rateIGP-M rate TR rate Fixed (*) On 5/7/10, CVM granted a registration for a public offer of Real Estate Receivables Certificates totaling approximately R$ 60 million. Amortization Schedule Cash X Debt Cash X Debt (R$ million) (R$ million) Amortization S chedule R $ Millon 2010 2011 2012 2013 After 2013 Total % C C I 10.5 18.8 21.6 21.8 177.3 250.0 75.8% Other Banks 65.4 12.0 2.2 0.0 0.0 79.6 24.2% Total 75.9 30.8 23.8 21.8 177.3 329.6 100.0% C C I (*) 14.5 24.8 27.6 27.8 215.3 310.0 94.1% Other Banks (*) 5.4 12.0 2.2 0.0 0.0 19.6 5.9% Total 19.9 36.8 29.8 27.8 215.3 329.6 100.0%
  • 26.
    25 GSB INVESTOR RELATIONS AlessandroPoli Veronezi Investor Relations Officer Marcio Snioka Investor Relations Manager 55 11 3159-5100 dri@generalshopping.com.br www.generalshopping.com.br Contacts