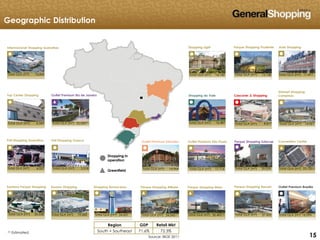
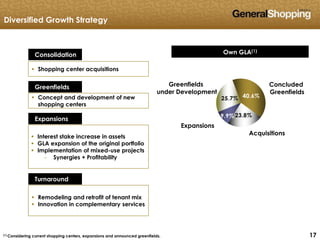
This presentation discusses General Shopping Brasil's portfolio and growth strategy. It contains 3 shopping centers:
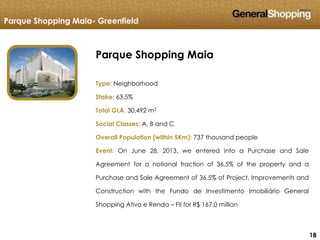
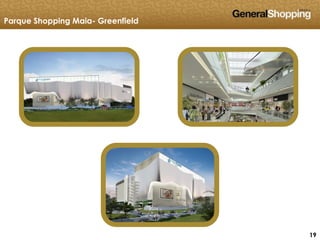
1) Parque Shopping Maia greenfield project, a 63.5% stake in a 30,492 sqm neighborhood shopping center located in Maiona, serving a population of 737,000 within 5km.
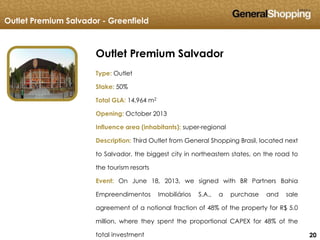
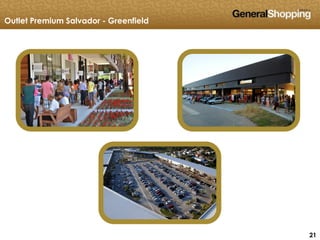
2) Outlet Premium Salvador greenfield project, a 50% stake in a 14,964 sqm outlet mall opened in October 2013 serving the Salvador region.
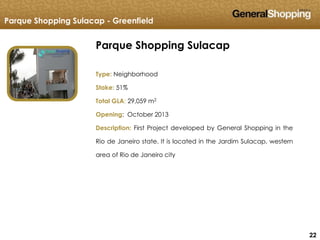
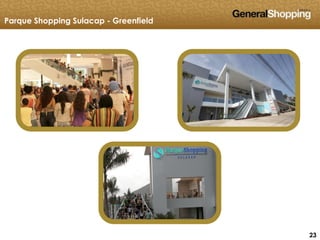
3) Parque Shopping Sulacap greenfield project, a 51% stake in a 29,059 sqm neighborhood shopping center in Rio de Janeiro opened in October 2013, the company's first project in Rio