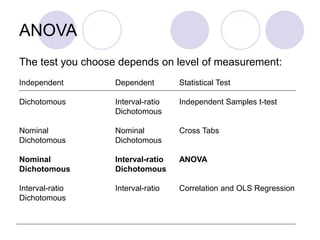
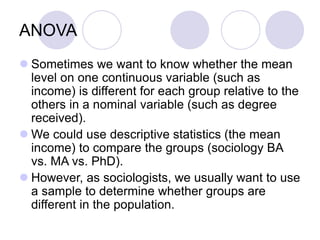
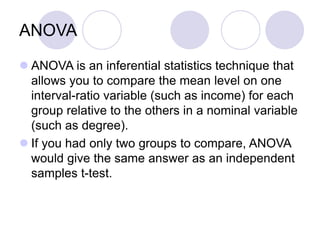
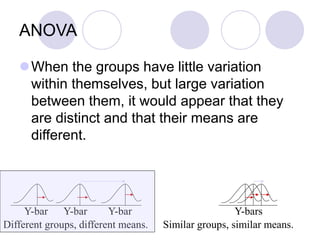
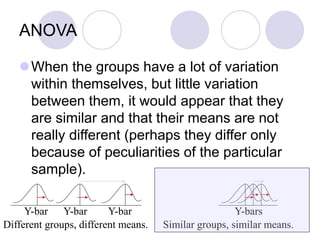
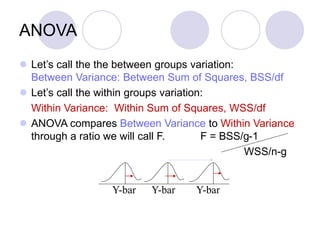
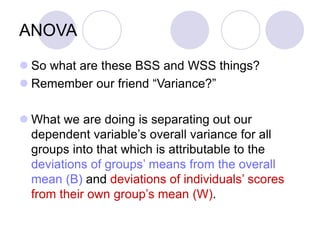
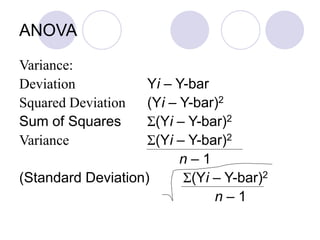
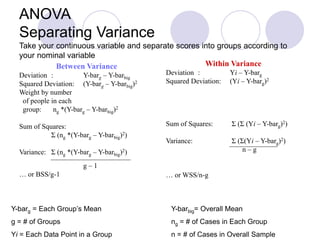
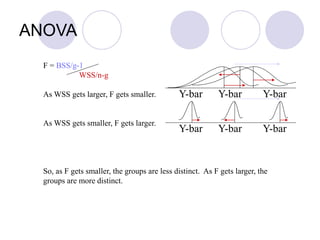
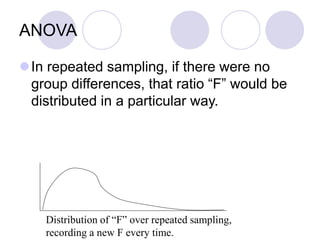
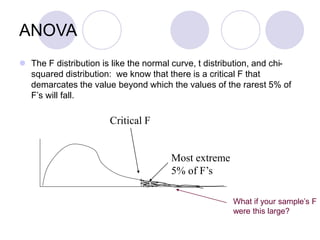
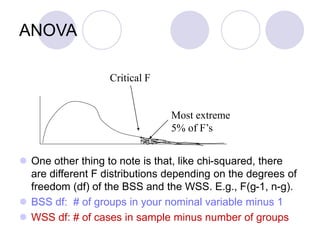
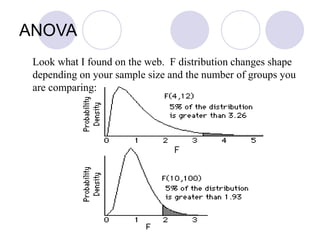
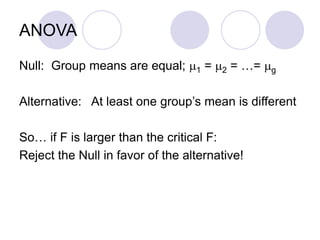
ANOVA
Analysis of Variance
Most Useful when Conducting
Experiments
ANOVA
The test you choose depends on level of measurement:
Independent Dependent Statistical Test
Dichotomous Interval-ratio Independent Samples t-test
Dichotomous
Nominal Nominal Cross Tabs
Dichotomous Dichotomous
Nominal Interval-ratio ANOVA
Dichotomous Dichotomous
Interval-ratio Interval-ratio Correlation and OLS Regression
Dichotomous
ANOVA
 Sometimes we want to know whether the mean
level on one continuous variable (such as
income) is different for each group relative to the
others in a nominal variable (such as degree
received).
 We could use descriptive statistics (the mean
income) to compare the groups (sociology BA
vs. MA vs. PhD).
 However, as sociologists, we usually want to use
a sample to determine whether groups are
different in the population.
ANOVA
 ANOVA is an inferential statistics technique that
allows you to compare the mean level on one
interval-ratio variable (such as income) for each
group relative to the others in a nominal variable
(such as degree).
 If you had only two groups to compare, ANOVA
would give the same answer as an independent
samples t-test.
ANOVA
 One typically uses ANOVA in experiments because these
typically involve comparing persons in experimental
conditions with those in control conditions to see if the
experimental conditions affect people.
Independent Dependent
Nominal Variable Interval-ratio Variable
Experimental Grouping Outcome Variable
 For example: Is “Diff’rent Strokes” funnier than ”Charles in
Charge?”
Experiment:
Do kids exposed to “Diff’rent Strokes” laugh more than those
who watch “Charles in Charge?”
Expose Groups to a Show Record Amount of Laughter
 We then use the sample to make inferences about the
population.
ANOVA
What if three racial groups had incomes distributed like this
in your sample?
All Groups
Groups Broken Down
Isn’t it conceivable that the differences are due to natural random
variability between samples? Would you want to claim they are
different in the population?
Income in $Ks
Income in $Ks
ANOVA
Now…What if three racial groups had incomes distributed
like this in your sample?
All Groups Combined
Groups Separated Out
Doesn’t it now appear that the groups may be different regardless of
sampling variability? Would you feel comfortable claiming the
groups are different in the population?
Income in $Ks
Income in $Ks
ANOVA
 Conceptually, ANOVA compares the variance within
groups to the overall variance between all the groups to
determine whether the groups appear distinct from each
other or if they look quite the same.
Different groups, different means.
Y-bar Y-bar Y-bar
Similar groups, similar means.
Y-bars
Categories
of Nominal
Variable
Measures on
Continuous
Variable
3 4 5 6 7 8 9 10 11 12 13 14 15 16 17 18 19 10 11 12 13 14 15 16
ANOVA
When the groups have little variation
within themselves, but large variation
between them, it would appear that they
are distinct and that their means are
different.
Y-bar Y-bar Y-bar Y-bars
Different groups, different means. Similar groups, similar means.
ANOVA
When the groups have a lot of variation
within themselves, but little variation
between them, it would appear that they
are similar and that their means are not
really different (perhaps they differ only
because of peculiarities of the particular
sample).
Y-bar Y-bar Y-bar Y-bars
Similar groups, similar means.
Different groups, different means.
ANOVA
 Let’s call the the between groups variation:
Between Variance: Between Sum of Squares, BSS/df
 Let’s call the within groups variation:
Within Variance: Within Sum of Squares, WSS/df
 ANOVA compares Between Variance to Within Variance
through a ratio we will call F. F = BSS/g-1
WSS/n-g
Y-bar Y-bar Y-bar
ANOVA
 So what are these BSS and WSS things?
 Remember our friend “Variance?”
 What we are doing is separating out our
dependent variable’s overall variance for all
groups into that which is attributable to the
deviations of groups’ means from the overall
mean (B) and deviations of individuals’ scores
from their own group’s mean (W).
ANOVA
Variance:
Deviation Yi – Y-bar
Squared Deviation (Yi – Y-bar)2
Sum of Squares Σ(Yi – Y-bar)2
Variance Σ(Yi – Y-bar)2
n – 1
(Standard Deviation) Σ(Yi – Y-bar)2
n – 1
ANOVA
Separating Variance
Take your continuous variable and separate scores into groups according to
your nominal variable
Between Variance
Deviation : Y-barg – Y-barbig
Squared Deviation: (Y-barg – Y-barbig)2
Weight by number
of people in each
group: ng *(Y-barg – Y-barbig)2
Sum of Squares:
Σ (ng *(Y-barg – Y-barbig)2)
Variance: Σ (ng *(Y-barg – Y-barbig)2)
g – 1
… or BSS/g-1
Within Variance
Deviation : Yi – Y-barg
Squared Deviation: (Yi – Y-barg)2
Sum of Squares: Σ (Σ (Yi – Y-barg)2)
Variance: Σ (Σ(Yi – Y-barg)2)
n – g
… or WSS/n-g
Y-barg = Each Group’s Mean Y-barbig= Overall Mean
g = # of Groups ng = # of Cases in Each Group
Yi = Each Data Point in a Group n = # of Cases in Overall Sample
ANOVA
F = BSS/g-1
WSS/n-g
As WSS gets larger, F gets smaller.
As WSS gets smaller, F gets larger.
So, as F gets smaller, the groups are less distinct. As F gets larger, the
groups are more distinct.
Y-bar Y-bar Y-bar
Y-bar Y-bar Y-bar
ANOVA
In repeated sampling, if there were no
group differences, that ratio “F” would be
distributed in a particular way.
Distribution of “F” over repeated sampling,
recording a new F every time.
ANOVA
 The F distribution is like the normal curve, t distribution, and chi-
squared distribution: we know that there is a critical F that
demarcates the value beyond which the values of the rarest 5% of
F’s will fall.
Most extreme
5% of F’s
Critical F
What if your sample’s F
were this large?
ANOVA
 One other thing to note is that, like chi-squared, there
are different F distributions depending on the degrees of
freedom (df) of the BSS and the WSS. E.g., F(g-1, n-g).
 BSS df: # of groups in your nominal variable minus 1
 WSS df: # of cases in sample minus number of groups
Most extreme
5% of F’s
Critical F
ANOVA
Look what I found on the web. F distribution changes shape
depending on your sample size and the number of groups you
are comparing:
ANOVA
Null: Group means are equal; 1 = 2 = …= g
Alternative: At least one group’s mean is different
So… if F is larger than the critical F:
Reject the Null in favor of the alternative!
ANOVA
 If your F is in the most extreme 5% of F’s that
could occur by chance if your two variables were
unrelated, you have good evidence that your F
might not have come from a population where
the means for each group are equal.
 So, essentially, ANOVA uses your sample to tell
you whether, in the population, you have
overlapping group distributions (no difference
between means) or fairly distinct group
distributions (differences between means).
ANOVA
Conducting a Test of Significance for the Difference between Two or More
Groups’ Means—ANOVA
By using what we know about the F-ratio, we can tell if our sample could
have come from a population where groups’ means are equal.
1. Set -level (e.g., .05)
2. Find Critical F (depends on BSS and WSS df and -level)
3. State the null and alternative hypotheses:
Ho: 1 = 2 = . . . = n
Ha: At least one group’s mean does not equal the others’
4. Collect and Analyze Data
5. Calculate F: F = BSS/ g – 1 = Σ (ng * (Y-barg – Y-barbig)2)/g-1
WSS/ n – g Σ(Σ(Yi – Y-barg)2)/n-g
6. Make decision about the null hypothesis (is F > Fcrit?)
7. Find P-value

ANOVA.ppt

  • 1.
    ANOVA Analysis of Variance MostUseful when Conducting Experiments
  • 2.
    ANOVA The test youchoose depends on level of measurement: Independent Dependent Statistical Test Dichotomous Interval-ratio Independent Samples t-test Dichotomous Nominal Nominal Cross Tabs Dichotomous Dichotomous Nominal Interval-ratio ANOVA Dichotomous Dichotomous Interval-ratio Interval-ratio Correlation and OLS Regression Dichotomous
  • 3.
    ANOVA  Sometimes wewant to know whether the mean level on one continuous variable (such as income) is different for each group relative to the others in a nominal variable (such as degree received).  We could use descriptive statistics (the mean income) to compare the groups (sociology BA vs. MA vs. PhD).  However, as sociologists, we usually want to use a sample to determine whether groups are different in the population.
  • 4.
    ANOVA  ANOVA isan inferential statistics technique that allows you to compare the mean level on one interval-ratio variable (such as income) for each group relative to the others in a nominal variable (such as degree).  If you had only two groups to compare, ANOVA would give the same answer as an independent samples t-test.
  • 5.
    ANOVA  One typicallyuses ANOVA in experiments because these typically involve comparing persons in experimental conditions with those in control conditions to see if the experimental conditions affect people. Independent Dependent Nominal Variable Interval-ratio Variable Experimental Grouping Outcome Variable  For example: Is “Diff’rent Strokes” funnier than ”Charles in Charge?” Experiment: Do kids exposed to “Diff’rent Strokes” laugh more than those who watch “Charles in Charge?” Expose Groups to a Show Record Amount of Laughter  We then use the sample to make inferences about the population.
  • 6.
    ANOVA What if threeracial groups had incomes distributed like this in your sample? All Groups Groups Broken Down Isn’t it conceivable that the differences are due to natural random variability between samples? Would you want to claim they are different in the population? Income in $Ks Income in $Ks
  • 7.
    ANOVA Now…What if threeracial groups had incomes distributed like this in your sample? All Groups Combined Groups Separated Out Doesn’t it now appear that the groups may be different regardless of sampling variability? Would you feel comfortable claiming the groups are different in the population? Income in $Ks Income in $Ks
  • 8.
    ANOVA  Conceptually, ANOVAcompares the variance within groups to the overall variance between all the groups to determine whether the groups appear distinct from each other or if they look quite the same. Different groups, different means. Y-bar Y-bar Y-bar Similar groups, similar means. Y-bars Categories of Nominal Variable Measures on Continuous Variable 3 4 5 6 7 8 9 10 11 12 13 14 15 16 17 18 19 10 11 12 13 14 15 16
  • 9.
    ANOVA When the groupshave little variation within themselves, but large variation between them, it would appear that they are distinct and that their means are different. Y-bar Y-bar Y-bar Y-bars Different groups, different means. Similar groups, similar means.
  • 10.
    ANOVA When the groupshave a lot of variation within themselves, but little variation between them, it would appear that they are similar and that their means are not really different (perhaps they differ only because of peculiarities of the particular sample). Y-bar Y-bar Y-bar Y-bars Similar groups, similar means. Different groups, different means.
  • 11.
    ANOVA  Let’s callthe the between groups variation: Between Variance: Between Sum of Squares, BSS/df  Let’s call the within groups variation: Within Variance: Within Sum of Squares, WSS/df  ANOVA compares Between Variance to Within Variance through a ratio we will call F. F = BSS/g-1 WSS/n-g Y-bar Y-bar Y-bar
  • 12.
    ANOVA  So whatare these BSS and WSS things?  Remember our friend “Variance?”  What we are doing is separating out our dependent variable’s overall variance for all groups into that which is attributable to the deviations of groups’ means from the overall mean (B) and deviations of individuals’ scores from their own group’s mean (W).
  • 13.
    ANOVA Variance: Deviation Yi –Y-bar Squared Deviation (Yi – Y-bar)2 Sum of Squares Σ(Yi – Y-bar)2 Variance Σ(Yi – Y-bar)2 n – 1 (Standard Deviation) Σ(Yi – Y-bar)2 n – 1
  • 14.
    ANOVA Separating Variance Take yourcontinuous variable and separate scores into groups according to your nominal variable Between Variance Deviation : Y-barg – Y-barbig Squared Deviation: (Y-barg – Y-barbig)2 Weight by number of people in each group: ng *(Y-barg – Y-barbig)2 Sum of Squares: Σ (ng *(Y-barg – Y-barbig)2) Variance: Σ (ng *(Y-barg – Y-barbig)2) g – 1 … or BSS/g-1 Within Variance Deviation : Yi – Y-barg Squared Deviation: (Yi – Y-barg)2 Sum of Squares: Σ (Σ (Yi – Y-barg)2) Variance: Σ (Σ(Yi – Y-barg)2) n – g … or WSS/n-g Y-barg = Each Group’s Mean Y-barbig= Overall Mean g = # of Groups ng = # of Cases in Each Group Yi = Each Data Point in a Group n = # of Cases in Overall Sample
  • 15.
    ANOVA F = BSS/g-1 WSS/n-g AsWSS gets larger, F gets smaller. As WSS gets smaller, F gets larger. So, as F gets smaller, the groups are less distinct. As F gets larger, the groups are more distinct. Y-bar Y-bar Y-bar Y-bar Y-bar Y-bar
  • 16.
    ANOVA In repeated sampling,if there were no group differences, that ratio “F” would be distributed in a particular way. Distribution of “F” over repeated sampling, recording a new F every time.
  • 17.
    ANOVA  The Fdistribution is like the normal curve, t distribution, and chi- squared distribution: we know that there is a critical F that demarcates the value beyond which the values of the rarest 5% of F’s will fall. Most extreme 5% of F’s Critical F What if your sample’s F were this large?
  • 18.
    ANOVA  One otherthing to note is that, like chi-squared, there are different F distributions depending on the degrees of freedom (df) of the BSS and the WSS. E.g., F(g-1, n-g).  BSS df: # of groups in your nominal variable minus 1  WSS df: # of cases in sample minus number of groups Most extreme 5% of F’s Critical F
  • 19.
    ANOVA Look what Ifound on the web. F distribution changes shape depending on your sample size and the number of groups you are comparing:
  • 20.
    ANOVA Null: Group meansare equal; 1 = 2 = …= g Alternative: At least one group’s mean is different So… if F is larger than the critical F: Reject the Null in favor of the alternative!
  • 21.
    ANOVA  If yourF is in the most extreme 5% of F’s that could occur by chance if your two variables were unrelated, you have good evidence that your F might not have come from a population where the means for each group are equal.  So, essentially, ANOVA uses your sample to tell you whether, in the population, you have overlapping group distributions (no difference between means) or fairly distinct group distributions (differences between means).
  • 22.
    ANOVA Conducting a Testof Significance for the Difference between Two or More Groups’ Means—ANOVA By using what we know about the F-ratio, we can tell if our sample could have come from a population where groups’ means are equal. 1. Set -level (e.g., .05) 2. Find Critical F (depends on BSS and WSS df and -level) 3. State the null and alternative hypotheses: Ho: 1 = 2 = . . . = n Ha: At least one group’s mean does not equal the others’ 4. Collect and Analyze Data 5. Calculate F: F = BSS/ g – 1 = Σ (ng * (Y-barg – Y-barbig)2)/g-1 WSS/ n – g Σ(Σ(Yi – Y-barg)2)/n-g 6. Make decision about the null hypothesis (is F > Fcrit?) 7. Find P-value