Download as PDF, PPTX


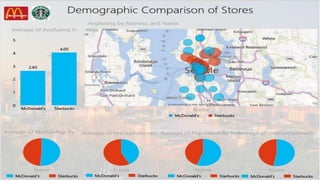
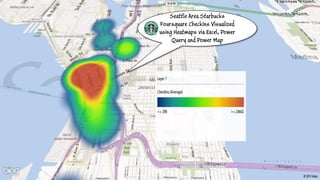
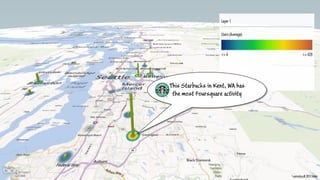
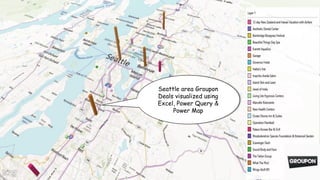
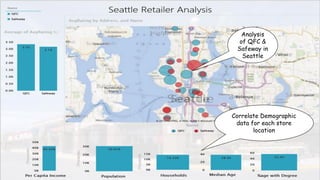
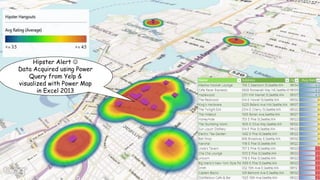
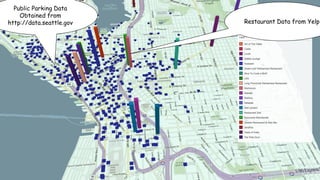
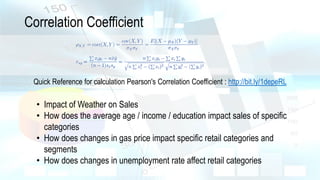


This document discusses analyzing correlations between sales, marketing, and demographic data. It provides examples of how retailers can use various data sources and APIs to correlate factors like weather, gas prices, unemployment rates, and demographics with retail sales and customer behavior. Visualization tools like Excel, Power BI, and Power Map are recommended to analyze and visualize correlated data from sources like Yelp, Foursquare, public data sets, and demographic data to gain customer insights.


