Download as PDF, PPTX

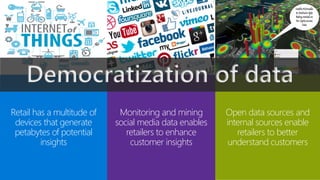
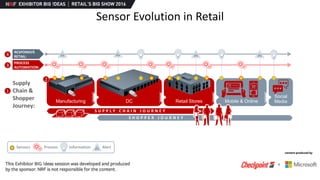
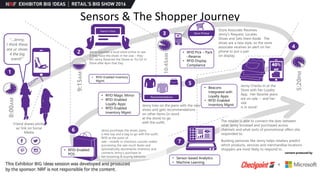
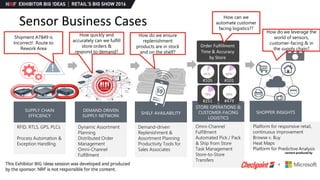
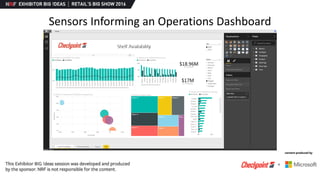


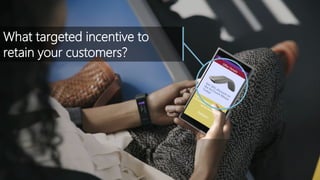


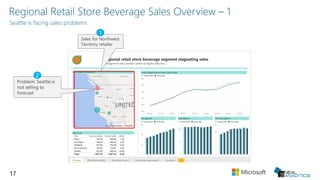
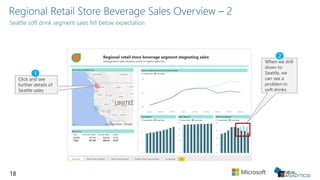


The document discusses how machine learning and sensors can provide insights to retailers by analyzing customer shopping journeys and behaviors. It describes how sensors in stores, online, and in the supply chain can track inventory, sales, and consumer preferences. The presentation then shows examples of how a retailer could use sensor data and machine learning to improve operations, pricing, promotions, and assortment planning.


