
Recommended
More Related Content
What's hot
What's hot (20)
Viewers also liked
Viewers also liked (16)
Similar to An investigation-of-fetal-growth-in-relation-to-pregnancy-characteristics
Similar to An investigation-of-fetal-growth-in-relation-to-pregnancy-characteristics (20)
Recently uploaded
Recently uploaded (20)
An investigation-of-fetal-growth-in-relation-to-pregnancy-characteristics
- 1. AN INVESTIGATION OF FETAL GROWTH IN RELATION TO PREGNANCY CHARACTERISTICS by Joe Max Mongelli MB BS, B Sc (Sydney) MRCOG Thesis submitted to the University of Nottingham for the degree of Doctor of Medicine, November 1994
- 2. 2 CONTENTS Title page 1 Contents 2 Abstract 3 Acknowledgements 4 Abbreviations 5 Part I - Literature Review Chapter 1 The Determinants of Birth Weight 6 Chapter 2 Adjustable Birth Weight Standards 15 Chapter 3 Ultrasonic Methods of Fetal Weight Estimation 22 Chapter 4 Models of Fetal Growth 29 Chapter 5 Screening Strategies for Abnormal Fetal Growth 37 Part II- Development of Research Techniques Chapter 6 Principles of the Customised Growth Chart 49 Chapter 7 Methods of Gestational Age Estimation 57 Chapter 8 Forward Projection of Fetal Weight Estimate 64 Chapter 9 Selection of Ultrasonic Weight Formula 68 Chapter 10 Ultrasonic Study of Fetal Growth: Patients and Methods. 76 Part III - Clinical Findings Chapter 11 An Ultrasound Standard for Fetal Weight Gain 83 Chapter 12 Symphysis-fundus Height in Relation to Gestational Age and Fetal Weight 95 Chapter 13 Fetal Growth Kinetics in Relation to Pregnancy Characteristics 102 Chapter 14 Customised Growth Charts in Relation to Neonatal Outcome 115 Chapter 15 The Prediction of Birth Weight 126 Part IV - General Discussion Chapter 16 Comments and Conclusions 143 References 156
- 3. 3
- 4. 4
- 5. 5
- 6. 6 1. THE DETERMINANTS OF BIRTH WEIGHT 1.1 Introduction Birth weight is one of the most important measures we have of the health status of a population, being a strong predictor of both mortality and morbidity, and reflecting nutritional status and growth rates. Yet the estimation of the normal growth potential -and hence the definition of growth retardation - for a given individual has remained an elusive objective. Neonatal size can be influenced by a large number of variables. Kramer (1987), in a lengthy review on low birth weight, listed 43 potential causes, subdivided into 7 groups, while admitting that his literature search may not have been complete. For the purposes of our discussion, we will attempt to classify them as pathological or physiological, depending whether or not they are associated with adverse perinatal outcome. This classification will be arbitrary for many of these factors, because of our limited knowledge in this field. 1.2 Pathological Factors A large number of pregnancy complications are associated with reduced birth weight. Classically, growth retardation has been classified as either symmetric or asymmetric (Pearce & Campbell, 1985), depending on whether the fetal body dimensions are proportionately reduced, or whether some degree of ‘head sparing’ has occurred. In practice, asymmetric IUGR is associated with either pre- eclamptic toxaemia or recurrent abruption, while most other causes lead to symmetric IUGR.
- 7. 7 Hypertensive Disease. Essential, uncomplicated hypertension poses little or no risk to the fetus. In early onset or severe pre-eclampsia birth weight may be reduced by 300-500g and birth length by 1-3 cm, whereas late onset or mild pre-eclampsia has no such association (Fedrick & Adelstein,1978; Long et al, 1980). Reduced utero-placental blood flow is considered to be responsible for reduced growth. Chronic Maternal Illness Maternal cyanotic heart disease is associated with fetal growth retardation in up to 52% of pregnancies, as opposed to 9% in the acyanotic group (Shime et al, 1987). Diabetes has complex effects on fetal growth, with a tendency towards larger babies unless associated with vascular disease and advanced maternal age, when growth retardation is more likely. It is the main pathological cause of fetal macrosomia. Severe chronic respiratory diseases such as poorly controlled asthma (Greenberger and Patterson, 1983), cystic fibrosis (Palmer et al, 1983) and bronchiectasis (Thaler et al, 1986) may lead to reduced fetal growth. In the case of anaemia, it is difficult to separate the effects of anaemia per se from the underlying nutritional problems. However, women with sickle cell disease, sickle-thalassaemia and sickle haemoglobin-C disease have an increased incidence of growth retarded infants (Powers et al, 1986).This is most likely due to placental micro-infarcts resulting from episodes of sickling, leading to placental insufficiency. Chronic renal disease of moderate severity is associated with IUGR in up to 24% of cases (Katz et al, 1989), although some of this effect may be related to hypertension.
- 8. 8 Systemic lupus erythematosus has been implicated in fetal growth retardation (Carlson,1988), though this may be a result of the underlying renal disease or drug therapy. Maternal Addictions Smoking mothers have babies that are 150 - 200g lighter than those of non-smokers (Wilcox et al,1993a); this appears to be caused by smoking in itself rather than other factors associated with the smoker (Doughterty,1982). Excessive alcohol intake may result in small babies with shortened palpebral fissures and a small head - the fetal alcohol syndrome (Lemoine P et al, 1968). Fetal weights are reduced by 165-200 grams among mothers who drink the equivalent of more than 50 ml of absolute alcohol per day (Ouellette et al, 1977). Heroin addiction has also been associated with reduced fetal growth (Naeye et al, 1973). High Altitude Babies born at high altitude are lighter than those born at ground level (Lubchenko, 1963); this appears to be a 'dose-response' effect related to chronic hypoxia, with smaller babies being born at higher altitude (Yip, 1987). Interestingly, both of these studies showed higher rates of preterm delivery. Malnutrition Maternal malnutrition, when severe, may result in adverse neonatal outcome. Stein and Susser (1975) analysed the birth statistics in Holland during the famine of 1944-1945; they found that birth weights declined by about 10% only when under-nutrition occurred in the third trimester with caloric intake below 1500 g. This is to be expected, since the period of greatest absolute growth is in the last 10 weeks of
- 9. 9 gestation, when the average fetus gains about 2000g during this interval (Hadlock et al, 1991). Placental Disorders. Recurrent antepartum haemorrhages in the first and second trimesters is strongly related to reduced fetal growth, possibly due to impaired development of the utero-placental circulation (Fedrick & Adelstein, 1978). Other placental anomalies associated with SGA infants include circumvallate placenta, and large chorioangiomas. Infection Viral infections, particularly rubella and cytomegalovirus, may reduce fetal weight and length to 80-85% of normal values ( Miller, 1981; Naeye, 1967). In fatal cases of rubella, the growth restriction is associated with markedly reduced cell numbers in the fetal organs (Naeye, 1965). Listeriosis is sometimes associated with IUGR. In global terms, malaria is probably the most important infectious agent associated with growth restriction on a world-wide basis. This is related to haemolytic anaemia and placental insufficiency related to placental infestation. The pathological changes observed in the placenta include perivillous fibrinoid deposits, syncytiotrophoblast necrosis and partial loss of microvilli. A brownish discoloration may be observed (plasmodial placental pigmentation), and these cases are associated with significantly lower birth weights (Garin et al, 1985; Walter et al,1982). Chromosomal Defects Most chromosomal and genetic disorders are associated with impaired fetal growth of varying severity. In Downs’ syndrome the birthweight is 80-90% of normal, while for trisomy 13 and Turner’s syndrome it is
- 10. 10 80% and 84% respectively (Polani, 1974). More severe growth restriction is observed in foetuses with trisomy 18, with an average birth weight of only 62% of normal. Some genetic disorders such as the Seckel and Russell-Silver syndromes are associated with severe dwarfing apparent at birth. On the opposite side of the spectrum, we find a group of genetic disorders that are associated with fetal growth acceleration. These include the Beckwith-Wiedemann syndrome, in which trisomy for the IGF-II gene has been implicated, and ‘stood’ conditions associated with a dramatic increase of fibrous tissue (Elejalde et al, 1977). In Sotos’ syndrome, characterised by cerebral gigantism , the birth weight is not significantly increased but the birth length is increased to a mean of 55.2 cm. 1.3 Physiological Factors Duration of pregnancy. The length of gestation is the most important determinant of birth weight (Wilcox et al,1993b), and also of perinatal mortality and morbidity in the pre-term period (Allen et al, 1993). The 'terminal flattening’ seen in birth weight standards based on menstrual data is artefactual; it is much less marked in standards derived from ultrasound-dated populations (Wilcox et al, 1993a). Parental size. The relationships between birth weight and parental size have been studied extensively, both in humans and in animals. The classic studies by Walton and Hammond (1938) on crosses between the Shire horse and the Shetland pony showed that the birth weights of foal born to Shetland dams of Shire sires were close to those of pure Shetlands; conversely, foals of shire dams by Shetland sires were close to those
- 11. 11 of the pure breed. Evidence in humans on the preponderance of the maternal effects on fetal growth has been presented by Cawley (1954) and Ounsted (1966). Both maternal height and weight have positive correlations with birth weight, the latter being the stronger factor. Low maternal pre-pregnancy weight is significantly correlated with both preterm delivery and low birth weight (Garn 1990). Obesity, as measured by the body mass index, is only weakly correlated (Abrams, 1986; Wilcox et al, 1993b). The parents' own birthweight is significantly correlated with that of their offspring (Alberman et al, 1992). Parity. The positive effect of parity on birth weight has been documented in most races and many mammalian species (Ounsted, 1973; Bantje, 1985), suggesting that its mechanism may have an evolutionary advantage. Garn (1990) has argued, on epidemiological grounds, that the effect of parity is a result of the increase in the maternal pre- pregnancy weight seen in developed countries, rather than an independent factor. This does not agree with multiple regression analysis of birth weight, which shows parity to be a factor independent of mid-pregnancy weight (Wilcox et al, 1993b); this may be because the mid-pregnancy weight is a compound variable, dependent on both the pre-pregnancy weight and the maternal weight gain. There is some evidence that the effect is partner-specific, i.e. a change in partner may be associated with a reduction in the birth weight of the first born of the new relationship (Warburton & Naylor, 1971). It may be argued that because of the significant increase in the perinatal mortality of first-born infants and those of mothers of high parity, this factor should be classified as a pathological variable. The odds ratios, however are only slightly elevated (Kirkup & Welch,1990), and do not justify this re-classification.
- 12. 12 Race. Meredith (1970) published an extensive description of the variations in birth weight among different ethnic groups. Of the 78 groups considered, the largest newborns were found in Anguilla and Nevis, weighing a mean of 3.88 Kg. The smallest babies were those of the Lumi tribe in the Toricelli mountains in New Guinea, with a mean birth weight of 2.4 Kg. These ethnic differences clearly persist in mixed populations from the same location (Cheng et al, 1972; Wilcox et al, 1993b). Birth weight variations do not always correlate with trends in perinatal mortality. In Singapore, Malay babies have a much higher perinatal mortality than Indian babies even though their percentage of low-birthweight (<2500) is significantly smaller (Hughes, 1984), both groups living in similar socio-economic conditions with total health care coverage. Similarly, Californian black babies under 3001g have much lower mortality rates than whites, even though their birthweights are lower (Williams et al, 1982). Sex The female newborn weighs on the average 118 g less than the male (Wilcox et al, 1993b), and this has been observed in most ethnic groups studied (Meredith, 1970).Animal studies suggest that the XY embryo has a growth advantage at the earliest stages of organogenesis (Snow, 1989); hormonal differences are not responsible, since the sex differences are noted even in anencephalic foetuses. It is of interest that in spite of this, females born preterm have lower mortality and morbidity than males (Allen et al, 1993). This may be due to female infants having relatively more energy stores in adipose tissue than males (Oakley et al, 1977).
- 13. 13 Others Women with a history of SGA infants are more likely to give birth to small babies. It is not clear whether this is due to genetic factors, or recurrence of genetic/pathological factors. Work performed by Ounsted (1965,1966) has shown that mothers who have borne SGA infants had themselves lower than average birth weights, although their adult height did not differ significantly from that of women who had given birth to babies of normal weight. Consanguinity in parents has been shown to cause a significant reduction in birth weight in Pakistan (Shami et al, 1991), Japan (Morton, 1958) and Norway ( Magnus et al, 1985). A seasonal trend has been observed in birth weights, with significantly lower values in summer and a peak in winter/early spring (Matsuda, 1992). These fluctuations are rather minor, occurring within a 100g band. 1.4 Discussion The distinction between 'pathological ' and 'physiological' factors is to some extent arbitrary, with a significant 'grey zone' of uncertainty. In terms of defining normal growth potential, the genetic components of the physiological factors are probably more important, and this was stressed by Lazar and colleagues (1975). This distinction is, however, an important exercise in order to develop valid adjustable growth standards. It is likely that fetal development is under the control of inhibitory and stimulatory growth factors, and that some physiological and pathological factors may well act through common pathways. Animal studies have shed some light on the relative importance of fetal genome and maternal effect; these have been reviewed by Snow (1989). There is good evidence to suggest that maternal effects operate
- 14. 14 late in gestation, whereas early fetal growth is controlled by fetal genetic mechanisms. Winick (1971) studied the cellular basis of fetal growth using animal models. Three phases of growth were identified: cellular hyperplasia, followed by both hyperplasia and hypertrophy, and then predominantly hypertrophy. Depending on the timing and duration of experimental insults, different forms of growth restriction were observed. Disturbances in early pregnancy restricted the total cell number, so that no 'catch-up' growth was possible, whereas later in pregnancy cell size was predominantly affected with minimal reduction in cell numbers , and post-natal recovery was possible with adequate nutrition. This points to the heterogeneous nature of growth disturbances and to the need for using appropriate standards. It is difficult to determine how much of the differences observed among different ethnic groups are due to genetic factors, as opposed to environmental factors such as nutrition and socio-economic conditions. Hence customising for ethnicity can only be justified when the adjustment factors are derived from sub-populations in the same location and ideally living under similar socio-economic conditions. The observed differences in neonatal morbidity between different sub-populations do not always agree with the birth weight differences. This lends weight to the argument that, for optimal performance, fetal weight for gestation as an index of morbidity needs to be evaluated in relation to other pregnancy characteristics.
- 15. 15 2. ADJUSTABLE BIRTH WEIGHT STANDARDS 2.1 Introduction Birth weight on its own is only a crude indicator of neonatal welfare, being a retrospective measure from which it is difficult to make accurate inferences about prenatal growth kinetics. The definition of 'low birth weight infant' as being a newborn weighing below 2500g was used as an index of prematurity until the 60's, when it was realised that a considerable proportion of these cases were in fact growth restricted (Ounsted, 1970). It has been nevertheless a convenient tool for epidemiologists, since reliable data on the duration of gestation is often difficult to obtain, particularly in developing countries. This, however, fails to make the important distinction between infants who are small because they were born preterm and those term babies who are small because of constitutional or pathological factors. 2.2 Pathological Implication of Abnormal Birth Weight This has prompted the search for birth weight for gestation standards, so that given the appropriate variables this distinction can be made. When birth weight is analysed as a function of gestation, some important relationships with poor perinatal outcome emerge. In a large study by Patterson et al (1986) of a database of 44 811 cases, a U-shaped relationship was found between birth weight centile and the incidence of morbidity , with minimal morbidity near the middle ranks of birth weight ; the percentage of the total poor perinatal outcome occurring below the tenth or above the 90th centiles increased linearly from 16% at 28-29 weeks to 57% at 40-41 weeks. There is mounting evidence that being small for gestational age has pathological implications extending into childhood and adulthood. Hill et al (1984) , in a small study, related the outcome of term infants
- 16. 16 with nutritional parameters. Malnutrition in the newborn was defined in terms of subcutaneous tissue thickness. About 45% of the 33 malnourished infants had birth weights below the 10th centiles; in this group, poor outcome included reduced educational achievement up to the age of 14. Rantakallio(1985) studied a cohort of 12,000 children in Finland followed up to 14 years; it was found that the incidence of neuro-behavioural disturbances was significantly higher in weight percentile classes below the median. Most of these and similar studies are flawed by the use of menstrual dates in determining gestation . As the error tends to be towards overestimation (Gardosi & Mongelli, 1993), more babies would be classified incorrectly as below the 10th centile than those assigned above the 90th centile. 2.3 Assignment of Gestational Age With very few exceptions, gestation is usually estimated from menstrual dates, rounded down to 'completed weeks'. Typically, when birth weight is plotted against gestation, the resulting standard curves show considerable flattening near term, and this has been attributed either to placental ageing/insufficiency, or to physical restriction of growth. More recent standards in which gestational age has been calculated on the basis of early ultrasound measurements show a much more linear relationship between duration of pregnancy and birth weight (Lindgren, 1988; Wilcox et al,1993a). This inaccuracy in the estimation of gestational age is also likely to lead to a greater apparent variance in the birthweight distribution for any given week of gestation. 2.4 Preterm Delivery and Birth Weight Standards Birth weight standards have in the past been referred to as 'fetal growth curves'. Apart from the fact that these are cross-sectional studies, values derived from preterm deliveries cannot be regarded as
- 17. 17 representative of normal growth. Furthermore, unless the population sample is very large, the number of babies born preterm is relatively small, leading to a greater incidence of sampling errors. Preterm delivery may be associated with growth restriction , and birth weight norms at these gestations may be well below those derived from serial ultrasound weight estimations (Ott, 1993). An experimental model of growth retardation supporting this epidemiological data was described by Alexander (1964). He, and subsequent workers, found that the excision of endometrial caruncles in the sheep (before pregnancy) resulted not only in an increased rate of growth retardation, but also in increased preterm labour rates and intrauterine death. Another indicator of pathology in the preterm period is the statistical distribution of birth weights. Whereas the distribution of birth weights at term shows a significant positive skewness, in the preterm period this becomes negative (Wilcox et al, 1993a), most likely because of the greater number of growth-retarded babies born at these gestations. It has also been shown that preterm babies delivered electively are significantly lighter than those born spontaneously, yet even when the former are excluded from the analysis the negative skewness is reduced but not entirely eliminated (Yudkin, 1987). 2.5 Effect of Environment Reference standards may also be strongly affected by the environment and population characteristics. For example, Lubchenko's (1962) birth weight chart has been used widely in the United States and elsewhere. This was derived from a population in Denver, Colorado, at an altitude of about 10000 ft. Not only did this high altitude result in lower birth weights for all gestations than any other published standard, but also the percentage of births occurring preterm was much higher than expected. There is also some evidence that birth weight standards may
- 18. 18 change historically as living standards and social characteristics vary (Alberman 1991; Ulizzi & Terrenato, 1992). 2.6 Adjustable Standards The realisation that these genetic or physiological effects are in operation led to attempts to introduce adjustment factors to allow for maternal characteristics. Thomson and colleagues (1968) published birth weight for gestation tables allowing for sex, parity and inclusive of correction factors for maternal weight . Altman and Coles (1980) produced nomograms for the calculation of birth weight centiles based on this data that included correction factors for parity, maternal height and weight, and fetal sex. Lazar and colleagues (1975) used multiple regression analysis to derive correction factors for both maternal and paternal weight and height, claiming that paternal weight is as important as maternal weight; they believed that the effect of these variables is largely of genetic origin, and in order to improve their predictive power they estimated what the parental values of height and weight would be at the age of 20 before entering them in their regression model. Parity and ethnic group were not considered in their analysis, and their model was not tested prospectively. Voigt (1989) and Mamelle(1989) published elaborate tables to allow adjustment for these variables, but the fact that they are not in general use attests to their complexity. Some interesting similarities among different birth weight standards were described by Dunn (1989). When the centile cut-off points were expressed as percentages above or below the population median and plotted against gestation, virtually identical values were obtained for all the standards. This remarkable correspondence led to the construction of the Bristol Perinatal Growth Chart, a method that would allow the production of antenatal and post-natal growth
- 19. 19 standard for population sub-groups. The method assumes that the latter are normally distributed. 2.7 The Birth Weight Ratio An alternative variable to describe size for gestation , the 'birth weight ratio' , was described by Brooke and colleagues (1989) in order to analyse factors affecting birth weight. This is simply the observed weight divided by the weight expected for a given gestation. Morley and colleagues (1990) described a relationship between birthweight ratio and the need for mechanical ventilation and post-neonatal mortality in preterm infants; this, however, was not observed in the study of Brownlee et al (1991). More recently, Wilcox and colleagues (1993b) analysed a large database of 31 561 computerised records of term deliveries in order to develop a multiple regression model to predict birth weight. The variables included gestation, sex, maternal height, weight, parity and ethnic group. The ratio of the observed birth weight to predicted weight ('individualised birth weight ratio', IBR) can then be calculated by a computer program and expressed as a centile value. This method has been reported to identify a higher proportion of truly growth retarded infants, as defined by neonatal ponderal index and skinfold thickness measurements (Sanderson, 1994). The drawback of Wilcox's program is that in its present form it is only applicable to babies born at term, and cannot be used for screening purposes in the antenatal period. It can be shown that when birth weight ratios are transformed into centile values, these are very similar to the corresponding birth weight centiles, provided the reference standards used to obtain the mean and standard deviation are similar (chapter 16). 2.8 Discussion The large number of birth weight standards in existence is a reflection of the importance given to this parameter, as well as the need to relate
- 20. 20 birth weight to local conditions. In the English literature alone, Goldenberg and colleagues (1989) were able to review 13 such standards published since 1963. Large differences were noted in the 10th centile cut-off point, greater than 500g for some gestational ages. These discrepancies are partly due to inconsistencies in methodology. For example, McKeown and Gibson (1951) included both live and still births in their analysis of the Birmingham data, whereas most investigators have restricted their samples to live born infants. The treatment of outliers in the data can vary between studies. A variety of corrections for bimodal or skew birthweight distributions have also been adopted (Gruenwald, 1966; Milner & Richards, 1974). A number of studies are also limited by small sample sizes, making it difficult to estimate centile distributions of birthweight with any degree of accuracy. Another major source of error is gestational age assignment. Assessment of fetal well-being, by whatever means, requires an accurate estimate of gestational age. The introduction of routine early ultrasound scanning in the United Kingdom has eliminated large errors, but the use of '10-day' or '7-day' rules whereby menstrual dates are used in preference to ultrasound determined dates if in agreement, may lead to some loss of accuracy (see Chapter 7). Those women who book late tend to have poorer outcomes, and ultrasonography may be of special benefit in this group. Although algorithms have been developed for the accurate determination of gestational age up until 32 week's gestation (Sabbagha et al, 1978), these have not gained widespread acceptance. All of the adjustable standards of fetal growth are limited by their use of cross-sectional birth weight data. While they may be valid for the assessment of relative size, they are not suitable for assessing serial weight estimates, i.e. growth (Altman, 1994).
- 21. 21 With the exception of the IBR, the correction factors are usually presented in tabular form, and do not take into account gestation- dependent variations. Thomson and colleagues (1968) stated that these adjustments should not be made for gestations under 37 weeks, since their numbers was limited in that range. Nevertheless, their parity differences were statistically different even at 32 weeks. Even if there were sufficient numbers, it is doubtful that these adjustment factors would be applicable to intrauterine fetal weight estimates. In practice most clinicians do not adjust beyond sex and parity, probably because of the inconvenience in using complex tables or graphs. In the standard published by Yudkin and colleagues (1987) - widely used in paediatric units in the UK-, no adjustment is made apart from fetal sex. Although the importance of accurate and valid fetal growth standards has long been acknowledged, the validity of specific growth standards when applied to a particular population or study sample is seldom tested. As a result, the assessment of growth retardation and evaluation of screening procedures may be inaccurate and biased.
- 22. 22 3. ULTRASONIC METHODS OF FETAL WEIGHT ESTIMATION 3.1 Introduction Fetal weight estimation plays an important part in clinical obstetrics decision-making, often used in screening for IUGR, the management of diabetes in pregnancy and pregnancy complicated by breech presentation. In current practice, ultrasonography remains the most accurate method for determining the estimated fetal weight (EFW). Although newer imaging techniques such as computerised tomography and nuclear magnetic resonance are likely to be much more accurate (Baker et al, 1994), their cost will prevent widespread use; their main role in the immediate future will remain as research tools. Three- dimensional ultrasound equipment, on the other hand, is now affordable, and the better, more reliable definition of anatomical planes (Kuo, 1991) should lead to reduced operator error and hopefully to better performance of the existing formulae. 3.2 Fetal Weight Estimation Formulae The equations for fetal weight estimation in terms of given ultrasound parameters are usually derived by applying a model of fetal weight composition to a source population examined shortly before delivery. The measured ultrasound parameters and the birth weights, are entered and the relevant coefficients are estimated by multiple regression analysis. The performance of the formula in term of its prediction errors is then tested on a separate sample, and 'target' population. One of the first such formulae to be developed was that of Campbell & Wilkin (1975 ); this was based on the fetal abdominal circumference (AC), and it is still in common use in the UK A considerable number of other formulae that usually employ more than one ultrasound parameter have since been published. A sample of these are listed in
- 23. 23 table 3.1. They can be broadly classified as exponential or non- exponential, depending on the type of mathematical expression. Exponential formulae take the form of: EFW = exp[F(P1,..Pn)] where F(p1,..pn) is a polynomial function of the ultrasound parameters P1 to Pn. Other approaches to weight prediction have been explored. A computer neural network program has been developed specifically to estimate weights in foetuses at risk of macrosomia (Farmer et al, 1992); ultrasound parameters were combined with clinical measurements such as fundal height, with a reported accuracy of around 5%. Birnholz (1986) published an algorithmic method for weight estimation, whereby one of two formulae are chosen by a computer program depending on the body proportions of the individual. About 90% of cases had an error less than 80 g/Kg . This method requires regression analysis of the fetal ultrasound parameters in the population under study. 3.3 Clinical Performance of Weight Estimation Formulae This is usually assessed by the statistical analysis of the errors. They may be expressed as signed or absolute percentage errors, absolute error in grams, errors in grams per Kg of fetal weight, and percent of errors beyond a given threshold. A typical weight formula employing more than one parameter will estimate 75% of cases within 15% of the actual weight (Thompson et al, 1990).The most common practice is to report the mean error and its standard deviation (SD); the former gives a measure of the tendency to under- or over-estimate (the systematic error), whereas the latter indicates the spread of the errors. It has recently been suggested that the standard deviation should be replaced
- 24. 24 by the 95% confidence limit of the errors (Bland & Altman, 1986); this is certainly preferable in situations when the distribution is not Gaussian. There is general agreement that equations employing two or more ultrasound parameters are more reliable than those using only one (Hadlock et al, 1985; Guidetti et al, 1990). Formulae developed within an institution tend to perform better than those from other centres (Thompson et al, 1990), probably because of significant inter- observer variability (Chang et al, 1993) and differences in equipment and populations. For example, formulae derived from Chinese populations perform better on Chinese patients than those developed from European populations (Chang et al, 1991). It has been reported that continual review of the results obtained by the methods used by an obstetric ultrasound department may further enhance its performance (Thompson et al, 1990). In Hadlocks' studies (1985), the prediction errors of equations employing three or four ultrasound parameters (BPD, HC, FL and AC) had a SD of around 8%. Slightly better values were reported by Issel and colleagues (1991), a SD of about 7% by measuring up to 7 ultrasound parameters. In clinical practice these errors tend to be somewhat higher (Miller et al, 1988). The problem of systematic over- or under-estimation of fetal weight is frequently reported when such formulae are used by centres other than the one where the formula originated (Robson et al, 1993). Some of this error may be due to the variations in the lag times between ultrasound examination and delivery, which is not usually allowed for by the authors of the formulae; this means that a fetus examined some days before delivery will be slightly lighter than at birth, and when the birth weight is entered into the regression analysis without due modification, a small but appreciable over-estimation will take place. This problem was appreciated by Spinnato and colleagues (1993), who introduced a time component into the established formulae, valid up to 35 days before delivery. A more serious and common problem is the
- 25. 25 existence of trends in the errors. There may be significant and negative correlation with the size of the fetus (Robson et al, 1993; Miller et al, 1988); hence small babies tend to be overestimated while large ones are under-estimated. This can lead to serious data distortion when producing normal values in growth curves for fetal weight, and may affect the performance of screening programs for small- and large- for gestational age infants. 3.4 Discussion Early retrospective studies on the detection of growth retarded foetuses by measuring the biparietal diameter suggested that this parameter could be helpful in defining groups of cases with higher perinatal mortality and preterm delivery rates (Persson et al, 1978). The technique, however, was subsequently found by Campbell & Dewhurst (1971) to have a false positive rate for SGA of 25%. This is not surprising, since the correlation coefficient of BPD with birth weight is not as high as other ultrasound parameters such as the abdominal circumference and femur length (Favre et al, 1993). Several studies have been published on the performance of different ultrasound parameters in the detection of the SGA fetus. Neilson and colleagues (1984) measured a series of fetal parameters in the third trimester; they found that the product of trunk area and crown-rump length (as an index of fetal weight) was superior to the trunk diameter alone. Dudley and colleagues (1990) showed that EFW was the best of four ultrasound parameters in identifying the small-for-dates infant. Similarly, Chang and colleagues (1993) reported that a single EFW estimate based on multiple ultrasound parameters was superior to abdominal circumference in predicting 2 out of 3 indices of neonatal nutritional deprivation. The efficacy of growth screening programs continues to be limited by the error of ultrasonic EFW and by the lack of a uniform standard for fetal growth and growth velocity. The
- 26. 26 normal standards of EFW published to date show considerable disagreement, and at least some of the differences may be attributable to the choice of weight estimation formula. This is further discussed in chapter 9. Volumetric formulae for fetal weight estimation have been proposed by several workers, including Combs (1993 ) and Birnholz (1986), on the grounds that fetal volume is proportional to weight when the specific gravity is constant. There are at least two theoretical objections to this argument. Firstly, the gestational age-dependent changes in specific gravity have not been described, and the magnitude of error from this factor is unknown. Secondly, growth retarded babies would have considerably less fat stores, increasing their specific gravity and thus leading to underestimation of weight. That this may be the case is suggested by the fact that Birnholz noted systematic underestimation of fetal weight in the under-1000g group, for whom he had to apply a recursive correction formula. In any case, the claimed improvements in accuracy of their methods have not been confirmed by independent workers. Birnholz (1986) has suggested that , on the grounds of information theory, averaging serial fetal weight estimates would improve the final estimate, with the expected improvement being related to the square root of the number of measurements. This makes the assumption that, for a given individual, the error in fetal weight estimation on each occasion is random, i.e. the signed error values are not correlated with each other. This particular issue has not been reported on in the literature. All of the commonly used formulae place an emphasis on bony landmarks and do not use any other soft tissue measurements apart from the AC. While bony landmarks are accurate for the purposes of estimating gestational age, the emphasis on these parameters could explain their relative inaccuracy in estimating weight.
- 27. 27 New weight estimation formulae should be explored that include additional measures of soft tissue parameters. These were explored by Favre and colleagues (1993), who reported better performance in the small for dates group using the thigh circumference and femur length. The standard deviation of the error was nevertheless fairly high at 15.9%, and they did not compare their formulae with older established equations. Other measures that should improve not only accuracy of fetal weight estimation but also performance of other tasks include continual audit and quality control, to ensure consistent techniques and peak performance of equipment. Plastic ‘phantoms’ have been designed in order check the technique and accuracy of the measurements performed by ultrasonographers, but these are not in common use in the UK. The scope for making major errors in estimating growth velocity from ultrasound fetal weight estimation has been pointed out in correspondence by Gardosi (1994b). Substantial gains in accuracy will be needed before abnormalities in growth velocity can be reliably detected.
- 28. 28 Table 3.1 Ultrasound fetal weight estimation formulae. Authors Exponential formulae Campbell & Wilkin (1975) wt=1000*exp(-4.564 +0.282*fac -0.00331*fac*fac) Hadlock et al (1985) wt=exp(2.695 +0.253*fac -0.00275*fac*fac) Hadlock et al (1985) log10(wt)=1.3598 +0.051*fac +0.1844*fl -0.0037*fac*fl Hadlock et al (1985) log10(wt)= 1.4787 -0.003343*fac*fl +0.001837*bpd*bpd +0.0458*fac +0.158*fac Hadlock et al (1985) log10(wt)=1.3596 -0.00386*fac*fl +0.0064*hc +0.00061*bpd*fac +0.0424*fac +0.174*fl Shepard et al (1982) wt=1000*exp(-1.7492 +0.166*bpd +0.046*fac - 0.002646*fac*bpd)*(ln(10)) Warsof et al (1977) wt=1000*exp(2.302585*(-1.599 +0.144*bpd +0.032*fac -0.000111*bpd*bpd*fac)) Persson et al (1986) wt=exp(ln(10)*(0.972*ln(bpd)/ln(10) +1.743*ln(ad)/ln(10) +0.367*ln(fl)/ln(10) -2.646)) Balouet et al (1992) wt=0.1135exp(0.739*ln(fac) +1.179*ln(ethc) -0.041*ln(ithc)) Non-exponential formulae Combs et al (1993) wt=0.23718*fac*fac*fl +0.03312*hc*hc*hc Dudley et al (1990) wt=4.1*fl*apa +0.86*fl*hpa Shinozuka (1987) wt=0.23966*fac*fac*fl +1.6230*bpd*bpd*bpd Birnholz (1986) wt=(3.42928*bpd*ad*ad/1000) +41.218) Birnholz (1986) wt=1.0206*{1.88496*[0.01*fl*ad+0.01667*bpd*ad + 0.01*bpd*bpd]*[(((-0.0069558*fl) +1.7394)*fl/10) -3.3626]} -61.537
- 29. 29 4. MODELS OF FETAL GROWTH 4.1 Introduction Awareness of the limitations of birth weight standards as indicators of fetal growth have led to the pursuit of ultrasound-defined intrauterine growth standards. But while it is relatively easy to obtain birthweight data from large populations, to derive ultrasound-defined standards requires considerable effort in manpower, logistics and equipment. Usually this data originates from ultrasound departments, and often does not contain the clinical details of individual cases. As a result, all of the fetal weight standards published to date have been derived from relatively small samples. The norms for commonly measured ultrasound parameters such as the AC, FL and BPD are well established, yet relatively few studies specifically address the issue of intrauterine weight gain. This is partly because for the purposes of growth monitoring, most ultrasound departments plot the individual measurements rather than weight estimates. This in spite of several studies suggesting that the EFW is at least as good as the AC for the detection of IUGR (Chang et al, 1993; Hedriana & Moore,1994). Here we review the literature on intrauterine weight curves, and describe an 'average' growth curve, based on published data. 4.2 Comparative Analysis of Ultrasound-Derived Growth Curves A total of seven studies describing intra-uterine weight gain were retrieved .Studies on the growth of linear ultrasound parameters without weight estimations were excluded, since derived fetal weight curves can differ markedly depending on the weight equation being used (see chapter 8 ). The characteristics of these studies are
- 30. 30 summarised in table 4.1; these include population samples, weight estimation formulae, mean birth weight and the methods of data analysis. The fetal growth kinetics described by each study are displayed in table 4.2. In order to describe the shape of the growth curves independently of the predicted term weight, growth can be expressed as a percentage of the predicted 280-day fetal weight, and plotted as fractional growth curves. This allows comparisons in terms of arbitrary descriptive landmarks such as gestation at which 50% of the term weight is reached (G50), and the percentage of term weight that is expected at 28, 37 and 42 weeks (P28, P37, P42). Figure 4.1 shows the medians of the ultrasound EFW curves plotted to 42 weeks and also the corresponding birth weight data derived from the East Midlands Obstetric Database (Wilcox et al, 1993a). Figure 4.2 shows the derived fractional growth curves, as a percentage of term weight. The equation for average fractional curve was obtained by taking the arithmetic average of the coefficients of the derived growth functions listed in table 4.1. This is plotted in figure 4.3; only a minimal degree of deceleration is noted at term. 4.3. Alternative models of fetal growth Rossavik and Deter (1986) proposed a sigmoid function to describe fetal growth of any parameter, including weight. This function is of the form: P= c(t) k+st where P is the ultrasound parameter, t is the duration of growth, k a fixed coefficient determined by the anatomical characteristics, c and s constants related to growth regulatory processes. This function allows the prediction of individual 'normal' growth channels based on two
- 31. 31 separate ultrasonic examinations before 27 weeks. This model was applied prospectively by Simon et al (1989) to a number of parameters including fetal weight. They found a small but significant systematic error of overestimation for most of the parameters and fetal weight; the standard deviation of the errors for fetal weight ranged from 6.7 % to 9.4% , depending on gestation. This is well within the range of the published errors of weight estimation formulae. The advantage of this model is that reference charts are no longer needed; instead, growth disturbances may be detected as deviations from the individually projected standard. The main drawbacks are the need for two ultrasound examinations before 27 weeks' gestation, spaced at least 5 weeks apart, and the need for appropriate computer equipment and software to carry out complex calculations. 4.4 Discussion Most of the differences between the published ultrasound growth curves become apparent during the term period. They agree within a 100g band up to about 36 weeks gestation (figure 4.1). Beyond this point, Jeanty's curve shows marked deceleration, whereas Deter's and Otts display moderate acceleration. The remaining four curves continue a linear trend evident from about 28 weeks. Jeanty's abdominal circumference values are markedly below other standards in late pregnancy, and this probably accounts for the deceleration in his weight curve. The overall fractional average curve (figure 4.3) shows only minimal deceleration at term, and this is in contrast to birth weight standards based on menstrual data. Another approach to deriving this curve would have been to use a weighted average; the problem here is that two of the studies are cross-sectional. In any case, the largest studies are included in the middle five curves, and thus it is
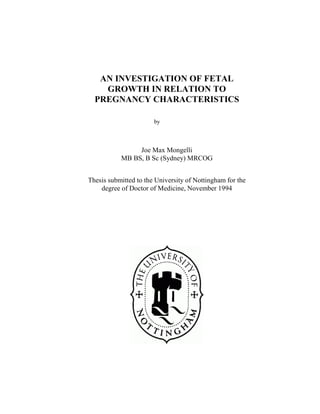
- 32. 32 doubtful that a weighing procedure would change the shape of the curve significantly. On the basis of their published birth weight data, Ott's and Deter's weight formulae overestimate fetal weight at term by 255g and 471 g respectively, and this may account for the steeper slopes of their curves. Larsen's study is the only one to use birth weight in order to select the optimal growth model; yet even here there is a systematic overestimation at term of about 170g. This contrasts with Hadlock's study, of similar (cross-sectional) design, where an overestimation of only about 20g was observed, probably because of better performance of the weight estimation formula. Of the five studies whose weight formula was not developed locally, none compares more than 3 different weight formulas in order to select the best. As will be discussed in chapter 8, the type of weight equation selected may result in differences of more than 300g at term. Hence, when producing standards of intrauterine weight gain, measures should be taken to correct any systematic error due to the weight estimation formula, since other centres will not necessarily employ the same formula. It is unlikely that the method of gestational dating makes a significant contribution to the observed differences among these studies. This is because, with the exception of Ott's study, menstrual dates were used only if in close agreement with early ultrasound measurements; if they did not agree, gestation age was estimated from the early ultrasound measurements of the biparietal diameter . The study by Larsen and colleagues is the only one to produce separate standards for males and females; they describe a mean weight difference between the sexes of 3.8%, but do not elaborate on whether this holds true for all gestations or only for part of pregnancy. It is apparent from figure 4.1 that all of the ultrasound derived medians are higher than the birth weight data, by an average of about 100g.
- 33. 33 Systematic weight estimation errors may account for some of this difference, but other factors may be at play , since the differences persist in the studies where this error was minimal, such as Hadlock's or even negative, as in Jeanty's. The most likely explanation is that infants born preterm are more likely to be growth retarded, and preterm delivery in these cases is an escape mechanism from an adverse intra-uterine environment. Complex mathematical models such as Rossavik's, irrespective of their validity, are unlikely to improve birth weight prediction in view of the magnitude of ultrasound error. A recent study by Shields and colleagues (1993) has shown that serial plotting of fetal measurements on normal curves is as accurate in this respect as complicated mathematical modelling. This would also be expected on the basis of information theory (Birnholz, 1986).
- 34. 34 Figure 4.1. Ultrasound-derived fetal growth standards compared with Nottingham’s birth weight standard. The continuous curves represent the ultrasound-derived standards published by Hadlock et al, Gallivan et al, Ott, Persson & Weldner, Deter et al, Larsen et al and Jeanty (using Shepard’s weight formula). The values for the birth weight standard by Wilcox et al are displayed as triangles. The middle four curves (Hadlock, Gallivan, Larsen and Persson) are closely related.
- 35. 35 Figure 4.2. Proportional growth curves for ultrasound-derived fetal growth standards. The ultrasound-derived standards published by Hadlock et al, Gallivan et al, Ott, Persson & Weldner, Deter et al, Larsen et al and Jeanty (using Shepard’s weight formula) have been transformed into ‘proportional’ growth curves, whereby the values for each gestation represent the percentage of the predicted 280 day fetal weight.
- 36. 36 Figure 4.3. Average proportional fetal growth curve. The transformed proportional fetal growth curves of the ultrasound-derived standards published by Hadlock et al, Gallivan et al, Ott, Persson & Weldner, Deter et al, Larsen et al and Jeanty (using Shepard’s weight formula) have been averaged arithmetically to yield an average curve .
- 37. 37 5. SCREENING STRATEGIES FOR ABNORMAL FETAL GROWTH 5.1 Introduction In spite of the widespread introduction of obstetric ultrasound, our clinical ability to detect the small-for-dates fetus remains poor, with only about 30% -50% of cases detected in the ante-natal period (Jones, 1986; Hepburn & Rosenberg, 1986) . We are also rather ineffective in detecting fetal macrosomia, with sensitivities of about 50% (Sandmire, 1993; Pollack et al, 1992). The question has been raised on several occasions of whether antenatal detection of growth disturbances is going to significantly affect neonatal prognosis . While there is no long-term follow-up data on this issue, there is some evidence that those SGA infants that are detected tend to have a better short-term outcome than the undetected cases (DeCourcy-Wheeler, personal communication). Hence we should persist in our efforts to improve the antenatal detection of the potentially compromised fetus. There are two basic methods in practice for the detection of fetal growth anomalies: obstetric ultrasound and assessment of the fundal height. 5.2 Fetal Ultrasonography Obstetric ultrasound has been investigated as a screening technique since the early 70's (Campbell, 1971).While it has proved successful in the detection of congenital abnormalities (Chitty et al, 1991) and in establishing gestational age, the detection of growth restriction and growth acceleration have remained much more elusive goals. Fetal macrosomia is a common cause of concern for obstetricians, and it is
- 38. 38 common practice to refer cases to the ultrasound department for fetal weight estimation. There is, however, mounting evidence that so far the performance of ultrasound in this weight group is poor compared with other categories (Sandmire,1993). Two ultrasonic methods are in common use for the detection and assessment of fetal growth abnormalities: serial and static measurements of fetal anatomy . At least five randomised trials have been performed since 1984 to assess the efficacy of antenatal ultrasound as a screening tool for growth restriction or developmental anomalies. These were published by the following authors: 1. Bakketeig LS and collegues (1984) 2. Waldenstrom U and collegues (1988) 3. Ewigman B and collegues (1990) 4. Ewigman B and collegues (1993) 5. Newnham JP and collegues (1993) The results have been somewhat contradictory and inconclusive. A significant reduction in the number of SGA infants, a modest increase in the mean birth weight and a significant reduction in the induction rate was demonstrated by Waldenstrom and colleagues, following routine scanning at 12 weeks. This was attributed to a reduction in smoking due to visualisation the baby. On the other hand, in a group undergoing both Doppler and ultrasound imaging on up to 5 occasions, Newnham and colleagues noted a slight but significant increase in the SGA frequency in the screened group. In the largest randomised study to date (4) involving 15151 low-risk pregnancies , no significant differences in outcome were noted between the screened and the routine management group. The latter, however, did undergo ultrasound examination when clinically indicated, thus limiting the scope of the inferences that can be made from this study.
- 39. 39 Optimal strategy for the detection of growth restricted fetus continues to be a controversial issue (Daniellan and colleagues,1994). The study by Chang and colleagues (1993) suggests that the use of either growth velocity or single fetal weight estimates is rather limited at detecting the truly growth restricted fetus as defined by neonatal morphometric indices; at a false positive rate of 10% only 20-40% of the growth retarded fetuses were detected. Similar figures were reported by Daniellan and colleagues (1993). Both of these studies used morphometric indices as the definitive criteria for IUGR; the limitations of these indices are discussed in chapter 9. The data presented by Hedriana and Moore (1994) suggests that a single ultrasound examination is nearly as good as multiple examinations in predicting the birth weight, but they did not test the hypothesis that growth velocity as assessed by multiple measurements is a better predictor of poor outcome than fetal weight estimated from a single measurement. 5.3 Fundal height assessment 5.3.1 Introduction The earliest report on measuring the symphysial-fundal height (SFH) was published in the German literature by Spiegelberg in 1891. Rumboltz and McGoogan (1953) were the first to describe a relationship between reduced growth of the uterine fundus and 'placental insufficiency'. Since then, many conflicting reports have been published on screening for growth disturbances by the clinical measurement of the symphysial-fundal height (SFH). 5.3.2 Precision and accuracy of SFH measurements. The estimation of symphysis-fundus distance is subject to considerable error. Bagger and colleagues (1985) reported an average
- 40. 40 intra-observer variation of 1.5-2 cm and an inter-observer variation of 4 cm; these were not correlated with the actual SFH measurements. Some observers were found to consistently overestimate or underestimate .The accuracy of SFH measurements was checked by comparing clinical measurements with those obtained by ultrasound guided measurement; the differences between the former and the latter ranged from -0.2 to +2.7 cm. Calvert (1982) found intra-observer and inter-observer coefficients of variation of 4.6% and 6.4%, slightly lower values than those published by Bagger's group. The limits of agreement of the inter-observer variation were estimated in a study by Bailey and colleagues (1989) to be -5.0 to +1.6 cm, corresponding to a coefficient of variation of 4%. This study highlights what is probably the major shortcoming of SFH measurents: that the error due to inter- observer variation, even between experienced practitioners, is too wide in relation to the standard deviations in the published reference charts. 5.3.3 Fetal weight estimation by fundal height measurement. Estimation of fetal weight by unaided clinical palpation was reported by Loeffler (1967) to be accurate within 450g of the birth weight in 80% of cases; it is of interest that in this study the accuracy of the individual observers improved with experience. The first attempt to estimate fetal weight by measuring the fundal height was reported by Johnson and colleagues (1954). This method included correction factors for engagement of the fetal head and obesity.The standard deviation of the reported errors was 353g, which is slightly greater than ultrasound estimation using Campbell's formula for abdominal circumference(Campbell & Wilkin,1975). More recently, a Belgian study of an African population showed that SFH was more closely related to fetal weight than gestation (De Muylder and colleagues,1988).
- 41. 41 5.3.4 Derivation of SFH standards. In all the studies, women without 'sure' dates or an early dating ultrasound scan were excluded. In six of the nine papers reviewed the data was filtered by removing those cases whose birth weights were outside arbitrary limits; depending on the degree of restriction, the standard deviation of the SFH values thus obtained would be narrower. The inclusion criteria are summarised in table 3. In all of the above studies there appears to be some flattening of the SFH curve near term. As pointed out by Westin, miscalculation of gestational age may lead to serious error. In all the standards so far published, gestation was reckoned on basis of menstrual dates, ultrasound dating being used routinely to 'confirm' dates (Pearce),or reserved for those cases whose last menstrual period was unknown (Calvert, Quaranta) or otherwise excluding those cases without a known LMP (others). Geirsson (1991) has convincingly argued that even when certain, LMP dates are less reliable than those derived from ultrasound, with an overall tendency to overestimate gestation. He pointed out that birth weight standards in populations whose gestations are derived from ultrasound dating show a much less marked 'terminal flattening' of the reference curves at term. This has also been our experience (Wilcox et al, 1993a). It is likely that SFH reference standards are also subject to the same effect. 5.3.5 Ethnic variations in SFH standards. Table 5.1 shows the differences in SFH standards by ethnic group. For comparative purposes, the 40-week median value is given for each group; the SD deviation is omitted because of the widely different methodologies used. It thus appears that for European populations there are only small differences among the published standards. Indian
- 42. 42 populations, however, have lower term values of around 33 cm, compared with 36 cm for Europeans. Grover and colleagues (1991) published a reference standard derived from 200 low-risk Indian women with birth weights within +/- 1 SD of the local standard. Compared with European curves, their fundal height increments were similar from 20 weeks until 32 weeks (1 cm/week); some slowing was noted thereafter, resulting in term values that were 3 -4 cm lower. Similar values were published by Mathai and colleagues (1987) in South India. However, Depares and colleagues (1989),on comparing European and Pakistani SFH values in Bradford (UK), could not detect significant differences.This may be because of the small samples in their study.Oguranti studied SFH in 581 unselected Nigerian women; their values were also lower than European standards pre-term, but reached similar values at term. These differences in SFH standards among ethnic groups may arise from the well-known differences in birth weights, but could also be due to other factors such as maternal body build and prevalence of fetal pathology. 5.3.6 Clinical performance of SFH measurements. The definitions of 'positive for SGA' by SFH measurements differ in the literature. The populations tested also differ, some being high-risk, hence artificially increasing the detection rate. In most cases at least two or three consecutive readings have to be below the 10th centile. Theoretically, increasing the number of abnormal measurements in order to diagnose SGA should reduce the false positive rate. In a large uncontrolled study of low risk, uncomplicated pregnancies Westin (1977) in Sweden showed that SFH measurements were superior to maternal weight gain, maternal girth measurements, and biochemical analytes (uE3, HPL) for the detection of the SGA infant.The routine introduction of reference SFH charts in the case notes of all their patients was associated with a significantly steeper fall in the local
- 43. 43 perinatal mortality rate compared with the overall Swedish statistics. Pearce and Campbell (1987) compared serial SFH mesurements with a single fetal abdominal circumference (FAC) obtained by ultrasound as screening tests for SGA. No significant differences were noted between the two, when specificities were set equal at 79%. Interestingly, they found a peak sensitivity at 34 weeks, similar to Quaranta's peak at 32 weeks. The only randomized controlled trial on the clinical performance of SFH measurement versus clinical palpation was reported by Lindhard and colleagues (1990), in a population of 1639 women. No significant differences were found between the two methods in terms of the detection rate of SGA, number of interventions, additional diagnostic procedures or the condition of the newborn. Table 5.3 summarises the clinical performance of SFH measurements in detecting SGA infants. Because fundal height standards and the definitions of an abnormal SFH test vary, it is not possible to pool results in order to arrive at average values.Persson and colleagues (1986) summarise positive predictive values for various studies including their own, which is the largest. They range from 13% to 79%; there is a tendency for larger studies to show lower PPV's. This is consistent with the hypothesis that the larger the number of observers, the greater is the effect of inter-observer variability and hence the poorer the tests' performance. 5.4 Discussion If , as one would expect, antenatal detection of IUGR improves neonatal outcome, then an effective screening strategy for growth disturbances is a major target in perinatal medicine. That randomised studies have not been able to document a definite improvement in outcome following routine ultrasound examinations may be due to a number of factors. To some extent this is likely to reflect the limited
- 44. 44 accuracy of ultrasound in estimating fetal size; in none of the studies was fetal weight rather than the individual biometric parameters plotted. Another factor is the threshold for clinical intervention. In Newnham's study, the induction rates of the screened women did not differ significantly from the regular group even though the former were significantly more likely to be given the diagnosis of IUGR. This suggests some reluctance on the part of the clinicians to act on the basis of the ultrasound findings. Not to be discounted is the lack of an appropriate standard for detecting deviations in growth velocity. The concept that fetal growth could be monitored by such a simple and inexpensive tool as a tape measure has generated wide interest.The lack of agreement in the literature on the efficacy of SFH measurements is not surprising, given the wide differences in definitions and population sampling. The fact that the median 40-week values for different ethnic groups reflect their differences in mean birth weights provides additional support to the notion that SFH measurements are an indicator of fetal size. At least three studies compared traditional clinical palpation with SFH measurements for the detection of SGA fetuses. Secher and colleagues (1990) found no significant differences betweeen these two methods. Similar results were obtained by Pschera and colleagues (1984), and by Lindhard and colleagues (1990). This may be due to the clinicians’ longer experience with clinical palpation as opposed to the newer SFH measurement, and hence the results may have been biased by this factor. There is no good evidence that introduction of routine SFH measurements leads to a reduction in perinatal mortality rates. The improved figures reported by Westin may well have been a chance result, since this study was not properly controlled. In view of the magnitude of the error due to inter-observer variability, it is likely that SFH measurements are clinically more useful when
- 45. 45 performed serially and frequently by the same observer using a consistent technique. There is some evidence to suggest that test performance for SFH may be optimal around 32-34 weeks, and it is of interest that this coincides with the period of peak performance for ultrasonic fetal weight estimation of 32 to 36 weeks (Hedriana & Moore, 1994). If ultrasound growth screening is to be performed as a one-stage routine, then this gestational age interval offers the best hope for success. It could also be possible to improve the accuracy of ultrasonic fetal weight estimate by combining it with the SFH; this approach was described by Farmer and colleagues (1992), who, in addition toultrasound data and the SFH also included maternal characteristics such as height and parity. They developed a trained neural network which, in the case of suspected macrosomia, was significantly more accurate in estimating fetal weight than either Hadlock’s or Shepard’s formula; its mean percentage error was 4.7% with a standard deviation of 3.9%. Accurate fetal weight estimation is the key to an effective screening program for growth disturbances. This is an area that continues to evolve, and improvements may be brought about by advanced information processing techniques, using current clinical measurements.
- 46. 46 Table 5.1 Criteria for Population Selection of SFH Standards Study Population selection criteria for derivation of standard. Quaranta Birth weight between 25th and 90th centiles Belizan Birth weight between 10th and 90th centiles Westin Mean birth weight +/- 1 SD Calvert Birth weight between 10th and 90th centiles Pearce Birth weight between 10th and 90th centiles Grover Birth weight within mean +/- 1sd Mathai Term delivery of live infant Rosenberg Birth weight between 25th and 90th centiles Ogunranti All patients sure of their dates. Persson Infant weight/length ratio between 10th and 90th centile
- 47. 47 Table 5.2 Ethnic variation in SFH standards. Study Ethnic Group Sample size 40-week value Quaranta European 138 36.5 Belizan Latin American 139 34.5 Westin European 428 36 Calvert European 381 36 Pearce European 699 37 Persson European 1350 36 Ogunranti Afro-caribbean 581 39.4 Grover Indian 200 33 Mathai Indian 250 33.8
- 48. 48 Table 5.3 Clinical performance of SFH measurements. Study Definition of abnormal result FP sens spec Quaranta 2 cons or 3 isolated vals <10th cent 21 73 80 Belizan 1 single val <10th 21 86 90 Westin 1 single val<2cm below median or 3 cons static or decreasing vals 54 75 64 Lindhard As above 41 28 97 Calvert 1 single val<2cm below median or 3 cons static or decreasing vals 80 76 60 Pearce 1 single val below 10th centile 64 76 79 Grover 1 single val < 1sd below mean 16 81 94 Mathai 1 single val < 1sd below mean 23 78 88 Rosenberg 20% of measurements below 10th centile 21 62 85 Cnattingius 'catch-up and low' SFH growth NA 79 92 Persson outside 2sd's NA 27 88
- 49. 49 6. PRINCIPLES OF THE CUSTOMISED GROWTH CHART. 6.1 Introduction To produce an adjustable standard that takes into account the physiological factors influencing fetal weight is a computational task that is not easily performed by using tables and graphs. The logical solution to this problem is computer software. The principles of a computer-generated growth standard which carries out this task were first published in the Lancet in 1992 by J.Gardosi, Professor A.Chang and colleagues.Unlike previous attempts that relied on fixed correction factors from tables applied to birth weight standards, the calculations were performed by computer software and growth charts could be displayed on screen and printed. Ultrasound- derived fetal growth standards rather than birthweight standards were used for generating growth curves, and corrections factors that included maternal weight at booking, maternal height, parity, ethnic group and fetal sex were scaled up or down depending on the gestational age. 6.2 The prediction of normal growth potential The initial obstetric database consisted of 4179 pregnancies with ultrasound-confirmed dates. Multiple regression analysis showed that in addition to gestation and sex, maternal weight at booking, height , ethnic group and parity were factors that significantly affected birth weight. This was confirmed by analysis of variance.The multiple regression analysis was repeated by Mr Mark Wilcox on a much larger sample of 38114 cases, smoking being entered as an independent variable.Continuous variables such as gestation, height and weight were centered around their means so as to minimize computational
- 50. 50 problems. The details of the analysis have been published elsewhere (Gardosi et al, 1994), and the coefficients are given in table 3.1. This regression model allows us to estimate the fetal weight at 40 weeks for any combination of maternal characteristics. In the prediction of normal birthweight, the confounding effect of smoking is dealt with by entering the non-smoking coefficient for all cases.The model can only explain 31% of the variability of birth weight in the database, but this is likely to be an underestimate, since up to 55% of records in obstetric databases may have at least one error (Dombrowski, 1994); the East Midlands Obstetric Database is not subject to rigorous quality controls. 6.3 The generation of normal fetal growth curves The method of generating growth curves relies on the working hypothesis that, for normally grown fetuses, the morphology of the growth curves is approximately the same irrespective of birth weight. This means that if the mean curves from population subgroups are described in terms of a polynomial function of gestation, division of the polynomial coefficients by the 40-week weight will yield a new function whose coefficients will not vary appreciably between subgroups. Some indirect support for this postulate comes from the work by Dunn (1989) and Thomson (1968). In chapter 4 we reviewed the literature on ultrasound-derived fetal weight growth curves and for each mean curve we derived a 'proportional' curve, by dividing the coefficients of the original by its predicted 40 week weight . An average growth curve was produced by taking the arithmetic mean of the respective coefficients; this function will estimate the percentage of term weight for any gestation. Multiplying this function by the predicted 40-week weight obtained from the regression model will yield an individual 'ideal' antenatal growth curve. The 10th and 90th centile reference curves are derived
- 51. 51 from the standard error of the regression analysis, and are adjusted at each gestation so that the ratio of the standard error to fetal weight (coefficient of variation) remains constant at 11%. Some paired examples of the charts are shown in figures 6.1 to 6.4. Mrs Average (fig 6.1) is a European woman of average height and weight (163 cm and 63.4 Kg) who has had a previous delivery of a male infant weighing 2700 g at 37 weeks. The value within the square (9) is the centile value of this weight for 37 weeks. The expected birth weight at 40 weeks is just over 3800 grams. Figure 6.2 shows a woman of the same parity and size but of Indo-Pakistani origins; the term birth weight expectation is reduced to 3600 grams, but the previous delivery is not classified as SGA (centile 19). The chart of a large European lady with the same obstetric history is shown in figure 6.3; the previous birth weight is given a centile value of 4. In contrast, a short and light lady with the same history would be given a centile value of 24 (figure 6.4). 6.4 Other functions The early versions of the customised growth charts also allowed the entry of fundal height measurements by including a fundal-height y- axis on the right side. This was calibrated to approximate the standard published by Pearce and Campbell (1987). An axis for the fetal abdominal circumference was also displayed, based on the standard of Deter and colleagues (1982). Previous deliveries and their birth weight centiles may be entered and displayed on the same chart. The x-axis displays gestation as exact weeks and also the calculated corresponding dates. The expected date of delivery, maternal height and weight, parity and ethnic origin are displayed on the top left hand corner of the chart. In the latest version of the chart, the maternal body mass index is
- 52. 52 displayed if this falls below the 10th centile for our pregnant population at booking, as this indicates the possibility of malnutrition in the periconceptional period. 6.5 Clinical performance The initial sample of 4179 deliveries contained 385 cases with a birth weight below the 10th centile by unadjusted criteria (SGA). Of these, only 278 were still below the 10th centile following adjustment for maternal characteristics. Hence 107 (28%) would have been given a false positive diagnosis of SGA by conventional standard. Adjustment 90 cases that would have been missed by conventional assessment. Babies that by the conventional standard only were deemed SGA had significantly fewer instances of low Apgar scores. 6.6 Discussion It is apparent from the foregoing that this method of producing an adjustable growth standard relies on many hypotheses on the physiology of fetal growth. Yet these are necessary if a model is to be developed. These may be summarised as follows: 1. The physiological variables affecting fetal weight at term are also effective in the antenatal period in proportion to the fetal weight. 2. The intrinsic shape of the normal fetal growth curve is the same for all subgroups, differing only by a scalar, or 'magnification' factor proportional to the predicted term weight. This postulate will be referred to as the ‘proportionality ‘ principle. 3. The average fetal growth curve entered in the program is close to the true population average.
- 53. 53 4. The distribution of fetal weights is approximately normal for all gestations. 5. The variance of fetal weights is a constant fraction of the gestational median , ie a constant coefficient of variation of 11% (derived from term birth weights). 6. The selected variables of maternal weight, height, parity and ethnic group have mainly a physiological rather than pathological significance. A major problem is to separate physiological from pathological effects e.g. to what extent is a low maternal weight at booking due to nutritional factors as opposed to constitutional factors. In view of the known adverse effects of malnutrition in early pregnancy on fetal growth, measures are needed to prevent the application of unduly small adjustments for maternal weight in cases where the low values are due to undernutrition at booking. While this is an infrequent problem in western populations, this is not the case in the developing world. To deal with this issue, the current version of the customised growth chart calculates the body mass index (BMI) at booking; if this is below the 10th centile the maternal weight at booking is corrected so that the BMI is at the 10th centile. The birthweight expectation is thus the one for a normally nourished individual at the lower end of the normal range. A similar algorithm is applied at the 90th centile of the BMI. The rationale for making adjustments on the basis of parity is an issue open to debate. The primigravid state, although 'natural', would be a relatively infrequent finding in a female population of reproductive age unaffected by contraceptive practices, as the statistics from a
- 54. 54 century ago show. Goldenberg and colleagues (1989) stated that the genetic potential for fetal growth in primigravidas and multigravidas is identical and that the differences noted between these two groups are attributable to growth-restricting factors operating in primigravidas. Henced they advocated a parity-independent standard derived from a population of mixed parity. On the other hand, Thomson and colleagues (1968) argued in favour of adjusting for parity, believing that the effect of parity is a physiological factor present in the fetal environment. The effects of smoking on birthweight are relatively large. An alternative method to obtaining regression coefficients applicable to the whole population would be to include non-smokers only. But this process could theoretically lead to the selection of a genetically 'supra-normal' population, and thus adjustment factors that may not be universally applicable. More robust estimates of the coefficients for the different ethnic groups would have required a much larger sample . We did not have sufficient numbers of Far Eastern women to separate them from the heterogenous 'others' grouping, and hence we do not have a reliable coefficient for these. In view of the known pathological effects of malnutrition on fetal growth, measures are needed to prevent the application of unduly small adjustments for maternal weight in cases where the low values are due to undernutrition at booking. While this is an infrequent problem in western populations, this is not the case in the developing world. In the current version of the customised growth program, a lower limit is entered for the weight adjustment. If the maternal booking weight is below this limit, the adjustment does not decrease; the birthweight expectation is thus the one for a normally nourished individual at the lower end of the normal range.
- 55. 55 Large databases containing maternal characteristics, accurate antenatal fetal weight estimates and birth weights would be needed to address these issues.
- 56. 56 Table 6.1 Multiple regression coefficients for the prediction of normal growth potential . CONSTANT 3409.853 STANDARD ERROR 389.032 ADJUSTED R SQUARE 0.31824 NUMBER OF CASES 38114 Coefficient GESTATION (from 280 days) Gest 1 20.667 Gest 2 -0.21289 Gest 3 -0.000167 SEX Male - 116.871 Female -233.742 MATERNAL HEIGHT (from 162 cm) 7.764 BOOKING WEIGHT (from 64.3 kg) Weight 1 8.676 Weight 2 -0.11740 Weight 3 0.000716 ETHNIC GROUP European 31.670 Indian Sub-cont. -154.263 Afro-Caribbean -95.789 Other -33.446 PARITY Para 0 4.898 Para 1 112.904 Para 2 153.458 Para 3 154.767 Para 4 154.690 SMOKING Non-smoker 31.9160 Smokes 1-10 -120.602 11-20 -182.568 > 20 -214.112
- 57. 57 7. METHODS OF GESTATIONAL AGE ESTIMATION 7.1 Introduction An accurate assessment of gestation is crucial in the development of fetal growth standards. It is also of importance in evaluating most of the variables in current use for fetal monitoring and in the management of post-term pregnancy. Gestational age may be estimated ultrasonically by measuring fetal parameters such as the crown-rump length (Robinson & Fleming, 1975) until 12 weeks and the biparietal diameter (Campbell & Newman, 1971) until about 20 weeks gestation. Measurement of the BPD in the mid-trimester has been shown to be 5% more accurate in predicting the date of delivery than impeccable dates (Pearce and Campbell,1983). In practice, most ultrasound departments follow either the '10-day rule' or the '7-day rule', whereby preference is given to menstrual dates if these are within 7 or 10 days of the ultrasound estimate by the BPD. Here we study the reliability of these methods by analysing the East Midlands Obstetric Database. 7.2 Materials and Methods The computerised obstetric records of three major maternity units in the East Midlands (City and University Hospitals in Nottingham and Derby City Hospital) date from 1986. So far more than 60000 cases are available for analysis. A significant drawback is that the database does not allow the reliable exclusion of induced labour. Multiple pregnancies, stillbirths, congenitally abnormal babies, late bookers (over 24 weeks), preterm deliveries (<37 weeks) and those with unknown menstrual dates were excluded. A total of 31747 cases with both menstrual and ultrasound data were retrieved for analysis. Gestational age at delivery was calculated in days from 1. The
- 58. 58 biparietal diameter according to the dating charts by Campbell (1971) if over 13 weeks at booking, otherwise the crown-rump length was used (Robinson & Fleming,1975) and 2. The last menstrual period. The error in predicting the EDD was calculated in days for three different dating methods: ultrasound data only, the 7-day rule and the 10-day rule as follows: Error (days) = estimated gestational age at delivery - 280 These were expressed as signed and as absolute values. Statistical analyses were performed with the 'SPSS for Windows' statistical package. 7.3 Results Table 7.1 shows the means, standard deviations and skewness of the errors for each method. The distribution of the error is weakly but significantly skewed to the left. Analysis of the signed errors suggests that ultrasound on its own and the 7-day rule tend to underestimate the EDD, whereas the 10-day rule overestimates it. Because of the significant skewness of the data, the differences between the methods were evaluated non-parametrically using Wilcoxon Matched -Pairs- Signed-Ranks Test; the results are shown in table 7.2 . The mean and the standard deviation of the absolute error using ultrasound alone is slightly smaller than the other methods. Dating by ultrasound only is significantly more accurate in predicting the EDD than either the 7- day or 10-day rules. 7.4 Discussion The length of gestation has traditionally been calculated from the first day of the last menstrual period using Naegele's rule -i.e., by adding 7 days and 9 months to the date of the last menstrual period. Although this formula has been attributed to Franz Karl Naegele (1778-1851), it was first proposed by professor Herman Boerhaave (1709) at the
- 59. 59 University of Leyden (Speert, 1958). The formula implies a mean duration of pregnancy of 274 days from the LMP, which is at variance with the observed value of 280 days (Doring,1962). If the dates were not 'reliable', gestation was estimated by clinical palpation. There is mounting evidence that even among women with 'reliable' menstrual dates, considerable error may arise in the calculation of gestation. This is because the onset of ovulation within the menstrual cycle is relatively erratic, particularly in younger women (Geirsson,1991), and may also vary from cycle to cycle. We have studied the error of menstrual dates using the BPD-derived gestation as the reference standard, in a database of 31561 cases (Gardosi & Mongelli, 1993). For 21.5% of pregnancies ultrasound scan dates were outside plus or minus 7 days from the dates based on menstrual dates. Furthermore, the distribution of the error associated with menstrual dates was significantly skewed, such that the 95% confidence interval for gestational age derived from menstrual history was -27 to +9 days. In our unit the ultrasound department calculates the EDD at booking by using the 10-day rule if reliable menstrual dates are available, otherwise the BPD or the FL is employed. About 6% of all cases are induced for post-maturity on this basis, but these cannot be identified reliably from the computerised records. Therefore one would expect that this iatrogenic interference on the normal duration of pregnancy would bias the statistics in favour of the 10-day rule. However, in spite of this bias, we found that dating by ultrasound alone appears the best method for predicting the EDD; bearing in mind the direction of the bias, it is likely that the advantage of using ultrasound only may be greater than what our figures indicate. It has been suggested that the use of the BPD alone in estimating gestational age is flawed, in that the larger babies would be assigned a longer gestation than the smaller babies (Henriksen & Wilcox, 1994). Persson and colleagues (1978) did find a relationship between birth
- 60. 60 weight centiles and the size of the BPD in early pregnancy, but the difference between the small (<10th centile) and large (>90th centile) babies amounted to only about 1.5 mm at 18 weeks. This difference is equivalent to less than one day's variation in gestational age by Campbell's dating standard. We recently investigated this issue using a database of 19 singleton pregnancies precisely dated from in-vitro fertilisation or artificial insemination. No significant correlation was found between the BPD centiles at the booking ultrasound examination and the birthweight centiles (Gardosi et al, 1994). In this study we assumed that the modal length of normal pregnancy of 280 days is equally applicable for all population subgroups. Only a limited number of studies have been published on this issue, all of them using menstrual dates. They report trivial differences in duration of pregnancy between social classes or ethnic groups (Butler & Bonham, 1963; Henderson, 1967). There is also some evidence that BPD standards do not vary appreciably between ethnic groups (Vialet et al, 1988; Simmons et al, 1985), and thus this should not be an important source of bias. Our findings do not support the use of the 7-day or 10-day rule in the assignment of gestational age when valid ultrasound measurements are available. Although the error associated with their use may not matter in clinical practice (Mongelli & Gardosi, 1994), these methods are best avoided in defining normal standards in pregnancy.
- 61. 61 Table 7.1 Descriptive statistics for the errors resulting from each dating method.Values expressed in days (N = 31747). Variable Mean SD Skew S.E. Skew Min Max Signed Errors Ultrasound only -0.72 8.50 -0.12 0.01 -20 28 7-day rule -0.20 8.65 -0.15 0.01 -27 28 10-day rule 0.18 8.79 -0.16 0.01 -30 30 Absolute Errors Ultrasound only 6.91 5.00 0.69 0.01 0 28 7-day rule 7.02 5.06 0.70 0.01 0 28 10-day rule 7.15 5.12 0.73 0.01 0 30
- 62. 62 Table 7.2 Significance of differences in absolute errors between dating methods. Wilcoxon Matched -Pairs Signed Ranks Test. Pairs: A Vs B Mean Rank A>B A<B Ties A=B Z-value 2-tailed P value Ultrasound only Vs 7-day rule 8443.96 8782.91 8251 8989 14507 -7.1 <0.00005 Ultrasound only Vs 10-day rule 9493.64 10137.31 9231 10438 12078 -11.4 <0.00005 10-day rule Vs 7-day rule 1265.5 1140.34 1449 980 29318 -10.4 <0.00005
- 63. 63 8. FORWARD PROJECTION OF FETAL WEIGHT ESTIMATE The proportionality principle applied to dynamic fetal weight estimation. 8.1 Introduction. Fetal weight estimation from ultrasound parameters or other methods is almost invariably made from static measurements. In practice, delivery often does not occur until days or weeks after the ultrasound examination, and the weight estimation is not corrected for this time interval. This problem was appreciated by Spinnato and colleagues (1988) who published a series of dynamic weight estimation formulae to allow forward projection of the fetal weight estimate to the expected date of delivery. Here we present an alternative method that, in addition to forward weight projection, should also allow for backward fetal weight interpolation from the birth weight. 8.2 Subjects and Methods. In order to compare our method with Spinnato’s method, we selected only those cases who delivered within 35 days of the last ultrasound examination. Two hundred forty two cases were available for analysis; these were liveborn infants, inclusive of adverse outcomes and congenital malformations. The forward projection equation was derived from the principle that the shape of the fetal growth curve is similar for all cases irrespective of the birth weight. It is in fact a form of proportional extrapolation, which we will refer to as the ‘prop-ex’ method. Hadlock’s growth formula was selected because: 1. The weight estimation formulae considered were also developed by Hadlock and colleagues and 2. This growth formula is close to the average of previously published growth formulae (Gardosi et al, 1994). If Hadlock is the growth function, EFW the ultrasound fetal
- 64. 64 weight estimation, u is the gestational age at ultrasound examination and d is the gestational age at delivery, the following relationship applies: EFWu : EFWd = Hadlock(u) : Hadlock(d) Therefore: Projected fetal weight at delivery: EFWd = EFWu * Hadlock(d)/ Hadlock(u) Likewise, Spinnato’s equivalent dynamic weight equation for the Hadlock weight formulae is: Log (EFWd) = 1.0009 * log (EFWu ) +0.0043(d -u) Both techniques were applied to our sample. Prediction errors were calculated both as signed and as absolute percentage errors of the birth weight (BWT) as follows: Percentage error = 100* (EFWd -BWT)/BWT Trends in the error in relationship to birth weight were examined using Spearman’s rank correlation coefficient. Differences between the two methods were tested by Wilcoxon’s matched pairs signed-ranks test. 8.3 Results The signed and absolute percentage errors for the two methods are shown in Table 8.1. Table 8.2 displays the statistical significance of the differences between these two methods. The errors from using Spinnato’s method were not significantly correlated with true weight ( R = -0.0880, P>0.05), whereas with our
- 65. 65 method there was a weak but statistically significant inverse correlation with the true weight (R= -0.23, P<0.0005). This correlation was not significant if birth weights below 3200g were excluded. For both techniques, there was no significant correlation between either the signed or absolute errors and the lag-time interval. 8.4 Discussion These statistics show that the proportional extrapolation method we describe for birth weight prediction from remote ultrasonographic examination is significantly better than Spinnato’s technique in our population. This may be because the latter uses the lag-time difference between ultrasound examination and delivery, without considering the actual values of the gestational ages of these events. The random errors described in Spinnato’s original paper are slightly lower than when his method was applied to our population (11 vs 12 %), with a tendency towards underestimation as opposed to overestimation in our sample. Two other advantages of the prop-ex technique are that: 1. It is applicable to any fetal weight estimation technique, whereas Spinnato’s method requires different equations for different weight estimating formulae. 2. It can be modified to allow for retrospective fetal weight estimation from the birth weight by interpolation as follows: IFWu = BWT* Hadlock(u)/ Hadlock(d) where IFWu is the interpolated fetal weight. This formula, however, cannot be validated without an independent, highly accurate method of fetal weight estimation such as NMR. The results of these studies validate the concept of incorporating a lapse-time factor in equations to predict the birth weight from remote
- 66. 66 ultrasonographic data. As the errors are not correlated with the lag- time interval, both methods are accurate throughout the range of time intervals measured. It is likely that accuracy will be lost in cases affected by growth disturbances, and this is reflected in the negative correlation between the signed errors and the birth weight, which is lost for birth weights over 3200 grams. These findings also support the ‘proportionality’principle - a key aspect of the customised growth chart program- which is the assumption that fetal growth in normal populations is essentially the same, once growth is expressed in terms independent of the actual birth weight.
- 67. 67 Table 8.1.Signed and absolute percentage errors for projected fetal weight estimation. Formula Systematic Error (%) Random Error (%) Prop-ex 6.01 11.0 Spinnato 8.56 12.0 Mean Absolute Error (%) Standard Deviation (%) Prop-ex 9.9 7.7 Spinnato 11.8 8.9 Table 8.2. Non-parametric comparison of the errors generated using the two methods on the same population. Wilcoxon Matched-Pairs Signed-Ranks Test. Differences in Ranks Mean Rank No Cases - Ranks (Spinnato < Prop-ex) 172.70 51 + Ranks (Spinnato > Prop-ex) 130.75 225 Ties (Spinnato = Prop-ex) 1 Total = 277 Z = -7.7646 2-Tailed P-value <0 .00005
- 68. 68 9. SELECTION OF ULTRASONIC WEIGHT FORMULA 9.1 Introduction The performance of ultrasound fetal weight estimation formulae may have important implications for growth standards and antenatal screening. In choosing the best formula, two main selection criteria need to be satisfied: (a) Minimal overall error. (b) Minimal bias in the error in relation to fetal weight. The first condition is self-evident. The significance of minimising error trends in relation to fetal size has been somewhat underestimated in the literature. If a particular formula has a strong tendency to overestimate the small and underestimate the large fetus, both the weight standard and screening performance may be adversely affected. One may argue that fetal growth standards should be weight formula- specific.If this was the case, then centres where a particular formula is either not in use or is not suitable will not be able to use the standard. In this study we examine the effect of different weight estimation formulae on apparent growth kinetics, and their clinical performance in our population is evaluated . 9.2 Patients and Methods Persson and colleagues (1986) have shown that the average fetal weight curve derived from the means of the ultrasound parameters for each gestation is very similar to that derived from the means of the individual weights. Hence, to illustrate the effect of different weight formulae on growth curves, we studied the means published by Chitty and Altman (1993) for individual ultrasound parameters. These were input for the following weight estimation formulae: - Hadlock (BPD, AC, FL)
- 69. 69 - Hadlock (AC, FL) - Warsof (BPD, AC) - Shepard (BPD, AC) - Campbell (AC) - Modified Persson (BPD, AC, FL) Persson's original formula used the abdominal diameter (AD); this was modified by converting the AD into AC as follows: log10 EFW (grams) = 0.972* log10 BPD + log10 (AC/3.1416) +0.367*log10 FL -2.646 The calculations were performed by computer software, and the different growth curves for each formula displayed graphically using Cricket Graph software. In order to determine the best formula for the population in our study, we selected those cases that delivered within 14 days of an ultrasound examination. A sample of 129 cases was retrieved, from a total of 171 cases that had been seen one year before the completion of the growth study. A correction for the interval growth between time of ultrasound examination and delivery was made by projecting forward the estimated fetal weight using Hadlock's fetal growth formula as follows: Predicted weight = EFW * H(gestation at delivery)/H(gestation at scan) where EFW is the ultrasound-estimated fetal weight and H is Hadlock's fetal growth function as described in chapters 4 and 8. Using the weight formulae listed above, the signed percentage error for each case was computed thus: Percentage error = (Predicted weight - Birth weight)/ Birth weight
- 70. 70 A positive value indicates overestimation whereas a negative value indicates underestimation of true fetal weight. The weight formulae were then corrected for systematic error by multiplying them by a correction factor as follows: Correction factor = 1/(1 + systematic error) where the systematic error is expressed in fractional terms. Statistical analyses were performed with the SPSS for Windows statistical package. The means, standard deviations, 95% confidence limits and the distributions of the errors were computed. The trends between error and true weight were expressed in terms of Pearson's moment correlation coefficients. 9.3 Results Figure 9.1 shows the fetal growth curves obtained for Chitty and Altman's data using different fetal weight estimation formulae . For our population, the mean and standard deviations of the errors for each formula and the correlation of the error with the observed weight are displayed in table 9.1. Table 9.2 shows the errors at the extremes of birth weight. All the formulae tested on our population tend to overestimate true weight, and this applies also to the extremes of fetal weight (except for Campbell's and Persson's formulae for weights>4000g). The errors were recalculated after applying the correction factor for systematic error and the results are shown in table 9.3. 9.4 Discussion For any given population, it is apparent from Figure 9.1 that from about 36 weeks onwards the type of fetal weight formula can have a marked effect on the apparent fetal growth kinetics, particularly at term. Hence it is important to select the weight formula that is most
- 71. 71 suitable for the operator and the population under study. This could explain some of the variability in the fetal growth kinetics exhibited by previously published standards, which also appears greatest after 36 weeks. In our sample all of the formulae studied tended to overestimate the true fetal weight. The error associated with the use of Hadlock's formula for BPD, AC and FL was not correlated with the true weight, whereas all of the other formulae produced errors that were significantly correlated. Robson and colleagues (1993) also found a trend to overestimate true fetal weight. They noted a significant correlation of the error with birth weight for all the formulae they tested, but these did not include the Hadlock formula included in our study. This systematic overestimation may arise from differences in ethnicity between North American and British populations, or in techniques and equipment. After applying the correction factor for overestimation, Hadlock's formula for the BPD, AC and FL showed the smallest SD of the error, and this was the formula selected for our study. If the BPD could not be measured because of suboptimal visualisation, the formula used was Hadlock's for the AC and FL. The modified weight formulae were then applied retrospectively to this sample and prospectively to the remaining half of the population. Our approach to selecting weight formulae and correcting for them makes the assumption that the errors observed at term are similar to those obtained in the preterm period. To verify this would require a substantial number of infants born preterm who had had an ultrasound examination. Another solution is to use echo-planar NMR for accurate weight estimation in the preterm period and to compare this with the ultrasonic weight estimates; but this is not as yet an economic proposition.
- 72. 72 Table 9.1 Errors of ultrasonic weight formulae in relation to birth weight for cases delivering within 14 days of examination (N =129). Formula Systematic Error (%) SD of Error Skew Correlation (R) with birth weight P-value of R Persson * 0.43 10.79 0.11 -0.2145 0.015 Campbell 0.89 11.85 0.06 -0.4226 0.000 Hadlock (AC, FL) 3.23 11.52 0.2 -0.1246 0.159 Warsof (BPD,AC) 3.78 11.76 0.08 -0.2299 0.009 Hadlock (BPD,AC,FL) 5.32 1.21 .17 -0.1230 0.165 Shepard (BPD,AC) 9.24 12.31 0.09 -0.2442 0.005 * original formula using the AD modified to include the AC as follows: log EFW = 0.972* log BPD + log (AC/3.1416) +0.367*log FL 2.646
- 73. 73 Table 9.2 Error of ultrasonic weight formulae at the extremes of birth weight (all cases). Formula Birthweight > 4000g (N = 37) Mean Error (SD) Birthweight < 2500g (N = 17) Mean Error (SD) Persson -1.3 (10.36) 7.2 (12.5) Campbell -3.2 (10.86) 14.0 (16.3) Hadlock (AC, FL) 0.9 (10.8) 6.4 (13.8) Warsof 2.7 (11.8) 11.2 (12.2) Hadlock (BPD,AC,FL) 3.4 (10.4) 8.3 (13.2) Shepard 7.9 (12.3) 17.4 (12.8)