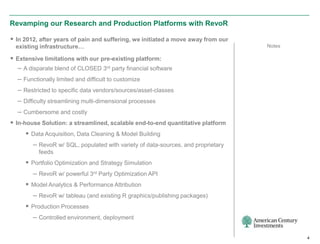
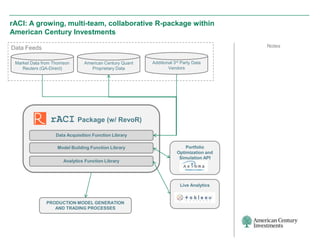
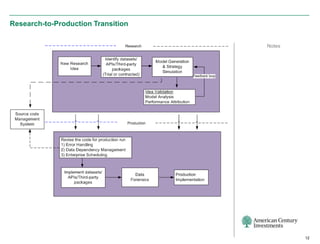
Presenters:
Tal Sansani, CFA (Quantitative Analyst / Portfolio Manager, American Century Investments)
Sampath Thummati (IT Manager / Advisor, American Century Investments)
Presentation Date: February 26, 2013
This presentation is about how American Century Investments revamped their research and production platforms with Revolution R Enterprise.
Applications in R - Success and Lessons Learned from the MarketplaceRevolution Analytics
Adoption of the R language has grown rapidly in the last few years, and is ranked as the number-one data science language in several surveys. This accelerating R adoption curve has been driven by the Big Data revolution, and the fact that so many data scientists — having learned R at university — are actively unlocking the secrets hidden in these new, vast data troves.
In this webinar David Smith, Chief Community Officer, will take a look at the growth of R and the innovative uses of R in business, government and non-profit sectors. Then Neera Talbert, Vice President, Professional Services will take you into the trenches of recent customer deployments and share best practices and pitfalls to avoid in deploying or expanding your own R applications.
[Presented to the 7th China R Users Conference, Beijing, May 2014.]
Adoption of the R language has grown rapidly in the last few years, and is ranked as the number-one data science language in several surveys. This accelerating R adoption curve has been driven by the Big Data revolution, and the fact that so many data scientists — having learned R at university — are actively unlocking the secrets hidden in these new, vast data troves.
In more than 6 years of writing for the Revolutions blog, I’ve discovered hundreds of applications of R in business, in government, and in the non-profit sector. Sometimes the use of R is obvious, and sometimes it takes a little bit of detective work to learn how R is operating behind the scenes. In this talk, I’ll begin by presenting some recent statistics on the growth of R. Then I’ll recount some of my favourite applications of R, and show how R is behind some amazing innovations in today’s world.
Big Data Predictive Analytics with Revolution R Enterprise (Gartner BI Summit...Revolution Analytics
Presented by David Smith, Chief Community Officer, Revolution Analytics at Garner Business Intelligence and Analytics Summit, April 2014.
In this presentation, I'll introduce the open source R language — the modern standard for Data Science — and the enhanced performance, scalability and ease-of-use capabilities of Revolution R Enterprise. Customer case studies will illustrate Revolution R Enterprise as a component of the real-time analytics deployment process, via integration with Hadoop, database warehousing systems and Cloud platforms, to implement data-driven end-user applications.
Adoption of the R language has grown rapidly in the last few years, and is ranked as the number-one data science language in several surveys. This accelerating R adoption curve has been driven by the Big Data revolution, and the fact that so many data scientists — having learned R at university — are actively unlocking the secrets hidden in these new, vast data troves. In more than 6 years of writing for the Revolutions blog, I’ve discovered hundreds of applications of R in business, in government, and in the non-profit sector. Sometimes the use of R is obvious, and sometimes it takes a little bit of detective work to learn how R is operating behind the scenes. In this talk, I'll recount some of my favourite applications of R, and show how R is behind some amazing innovations in today’s world.
Revolution Analytics was the first company dedicated to the R Project. This presentation from useR! 2014 covers the history of Revolution Analytics since its founding in 2007 and its contributions to the R project and community.
Performance and Scale Options for R with Hadoop: A comparison of potential ar...Revolution Analytics
R and Hadoop go together. In fact, they go together so well, that the number of options available can be confusing to IT and data science teams seeking solutions under varying performance and operational requirements.
Which configuration is faster for big files? Which is faster for sharing data and servers among groups? Which eliminates data movement? Which is easiest to manage? Which works best with iterative and multistep algorithms? What are the hardware requirements of each alternative?
This webinar is intended to help new users of R with Hadoop select their best architecture for integrating Hadoop and R, by explaining the benefits of several popular configurations, their performance potential, workload handling and programming model and administrative characteristics.
Presenters from Revolution Analytics will describe the options for using Revolution R Open and Revolution R Enterprise with Hadoop including servers, edge nodes, rHadoop and ScaleR. We’ll then compare the characteristics of each configuration as regards performance but also programming model, administration, data movement, ease of scaling, mixed workload handling, and performance for large individual analyses vs. mixed workloads.
In this webinar, Adam will explain the benefits and restrictions that are encountered when working with Big Data systems in a modern agile development approach. He will go on to present some of the approaches, both in automation and in their management of testing activities, that his team has successfully adopted in tackling the big data testing challenge.
Tell me more - http://testhuddle.com/resource/big-data-a-new-testing-challenge/
This lecture aims to give some food for thought regarding how the current High Performance Computing systems (hardware and software) tends to merge with Big Data ones (Machine Learning, Analytics and Enterprise workloads) in order to meet both workloads demands sharing the same clusters.
Big Data refers to a large amount of data both structured and unstructured. For managing and analyzing this amount of data we need technologies like Hadoop and language like R.
http://www.techsparks.co.in/thesis-in-big-data-with-r/
Presented by Jack Norris, SVP Data & Applications at Gartner Symposium 2016.
Jack presents how companies from TransUnion to Uber use event-driven processing to transform their business with agility, scale, robustness, and efficiency advantages.
More info: https://www.mapr.com/company/press-releases/mapr-present-gartner-symposiumitxpo-and-other-notable-industry-conferences
ML Workshop 1: A New Architecture for Machine Learning LogisticsMapR Technologies
Having heard the high-level rationale for the rendezvous architecture in the introduction to this series, we will now dig in deeper to talk about how and why the pieces fit together. In terms of components, we will cover why streams work, why they need to be persistent, performant and pervasive in a microservices design and how they provide isolation between components. From there, we will talk about some of the details of the implementation of a rendezvous architecture including discussion of when the architecture is applicable, key components of message content and how failures and upgrades are handled. We will touch on the monitoring requirements for a rendezvous system but will save the analysis of the recorded data for later. Listen to the webinar on demand: https://mapr.com/resources/webinars/machine-learning-workshop-1/
Leveraging Spark to Democratize Data for Omni-Commerce with Shafaq AbdullahDatabricks
Insnap, a hyper-personalized ML-based platform acquired by The Honest Company, has been used to build a real-time data platform based on Apache Spark, Cassandra and Redshift. Users’ behavioral and transactional data have been used to build data models and ML models, and to drive use cases for marketing, growth, finance and operations.
Learn how Honest Company has used Spark as a workhorse for 1) collecting, ETL and storing data from various sources including mysql, mongo, jde, Google analytics, Facebook, Localytics and REST API; 2) building data models and aggregating and generating reports of revenue, order fulfillment tracking, data pipeline monitoring and subscriptions; 3) Using ML to build model for user acquisitions, LTV and recommendations use cases. Spark replaced the monolithic codebase with flexible, scalable and robust pipelines. Databricks helped The Honest Company to focus on data instead of maintaining infrastructure. While Honest users got delightful recommendations to improve experience, data users at Honest understood users much better in terms of segmenting with behavioral information and advanced ML models, leading to increased revenue and retention.
DevOps and Machine Learning (Geekwire Cloud Tech Summit)Jasjeet Thind
DevOps and Machine Learning: How do you test and deploy real-time machine learning services given the challenge that machine learning algorithms produce nondeterministic behaviors even for the same input.
Advanced Analytics for Any Data at Real-Time Speeddanpotterdwch
The kenyote presentation from Predictive Analytics World entitled "Advanced Analytics for Any Data at Real-Time Speed" Dan Potter, CMO from Datawatch, presents a new approach to prepare, incorporate, enrich and visualize streaming data for advanced visual analysis is essential for making timelier, high-impact business decisions in tough competitive markets.
A changing market landscape and open source innovations are having a dramatic impact on the consumability and ease of use of data science tools. Join this session to learn about the impact these trends and changes will have on the future of data science. If you are a data scientist, or if your organization relies on cutting edge analytics, you won't want to miss this!
Using R for Analyzing Loans, Portfolios and Risk: From Academic Theory to Fi...Revolution Analytics
Dr. Sanjiv Das has held positions as at Citibank, Harvard University Professor and Program Director at the FDIC’s Center for Financial Research. His research relies heavily on R for analysis and decision-making. In this webinar, Dr. Das will present a mix of some of his more current and topical research that uses R-based models, and some pedagogical applications of R. He will present:
* An R-based model for optimizing loan modifications on distressed home loans, and the economics of these modifications.
* A goal-based portfolio optimization model for investors who use derivatives.
*Using network modeling tools in R to detect systemically risky financial institutions.
*Using R for web delivery of financial models and random generation of pedagogical problems.
Promising to be entertaining and enlightening, this webinar will emphasize the interplay of mathematical models, economic problems, and R.
An example of output from the R2DOCX package. See http://blog.revolutionanalytics.com/2013/06/create-word-documents-from-r-with-r2docx.html for details.
From the webinar presentation "Data Science: Not Just for Big Data", hosted by Kalido and presented by:
David Smith, Data Scientist at Revolution Analytics, and
Gregory Piatetsky, Editor, KDnuggets
These are the slides for David Smith's portion of the presentation.
Watch the full webinar at:
http://www.kalido.com/data-science.htm
Presented by David Smith, R Community Lead (Microsoft), at Monktoberfest October 2016.
The value of open source isn’t just in the software itself. The communities that form around open source software provide just as much value and sometimes even more: in ongoing development, in documentation, in support, in marketing, and as a supply of ready-trained employees. Companies who build on open source tend to focus on the software, but neglect communities at their peril.
In this talk, I share some of my experiences in building community for an open-source software company, Revolution Analytics, and perspectives since the acquisition by Microsoft in 2015.
27 Aug 2013 Webinar High Performance Predictive Analytics in Hadoop and R presented by Mario E. Inchiosa, PhD., US Data Scientist and Kathleen Rohrecker, Director of Product Marketing
R in finance: Introduction to R and Its Applications in FinanceLiang C. Zhang (張良丞)
This presentation is designed for experts in Finance but not familiar with R. I use some Finance applications (data mining, technical trading, and performance analysis) that you are probably most familiar with. In this short one-hour event, I focus on the "using R" rather than the Finance examples. Therefore, few interpretations of these examples will be provided. Instead, I would like you to use your field of knowledge to help yourself and hope that you can extend what you learn to other finance R packages.
2013 Future of Open Source - 7th Annual Survey resultsMichael Skok
The annual Future of Open Source Survey provides a report on the state of the open source industry and analysis of future trends. Now in its seventh year, this annual survey was supported by 30 collaborators, open source software industry leaders, and collaborating organizations, and compiles results from hundreds of respondents from the open source community.
Webinar: Survival Analysis for Marketing Attribution - July 17, 2013Revolution Analytics
A central question in advertising is how to measure the effectiveness of different ad campaigns. In online advertising, including social media, it is possible to create thousands of different variations on an ad, and serve millions of impressions to targeted audiences each day. Rather too often, digital advertisers use the last click attribution model to evaluate the success of campaigns. In other words, when a user clicks on an ad impression, only the very last event is deemed as significant. This is convenient but doesn't help in making good marketing decisions.
Survival analysis is widely used in the modeling of living organisms and time to failure of components, but Chandler-Pepelnjak (2010) proposed to use survival analysis for marketing attribution analysis. Listen to our webinar to learn more about this theory and a big data case study, showing how DataSong used Revolution Analytics.
Presentation given by US Chief Scientist, Mario Inchiosa, at the June 2013 Hadoop Summit in San Jose, CA.
ABSTRACT: Hadoop is rapidly being adopted as a major platform for storing and managing massive amounts of data, and for computing descriptive and query types of analytics on that data. However, it has a reputation for not being a suitable environment for high performance complex iterative algorithms such as logistic regression, generalized linear models, and decision trees. At Revolution Analytics we think that reputation is unjustified, and in this talk I discuss the approach we have taken to porting our suite of High Performance Analytics algorithms to run natively and efficiently in Hadoop. Our algorithms are written in C++ and R, and are based on a platform that automatically and efficiently parallelizes a broad class of algorithms called Parallel External Memory Algorithms (PEMA’s). This platform abstracts both the inter-process communication layer and the data source layer, so that the algorithms can work in almost any environment in which messages can be passed among processes and with almost any data source. MPI and RPC are two traditional ways to send messages, but messages can also be passed using files, as in Hadoop. I describe how we use the file-based communication choreographed by MapReduce and how we efficiently access data stored in HDFS.
From Business Idea to Successful Delivery by Serhiy Haziyev & Olha Hrytsay, S...SoftServe
If you`ve missed SoftServe`s presentation on “Big Data Analytics Projects: From a Business Idea to a Successful Delivery” at the 2014 Data & Analytics Innovation and Entrepreneurship event in London or would like to refresh your memory, please download the full version of the presentation in the PDF format.
SoftServe`s renowned experts on BI and Big Data, Serhiy Haziyev and Olha Hrytsay, explored skills and experience required to avoid unpleasant pitfalls as well as practical recommendations on how to properly start a Big Data analytics project with a software development partner.
Software engineering practices for the data science and machine learning life...DataWorks Summit
With the advent of newer frameworks and toolkits, data scientists are now more productive than ever and starting to prove indispensable to enterprises. Typical organizations have large teams of data scientists who build out key analytics assets that are used on a daily basis and an integral part of live transactions. However, there is also quite a lot of chaos and complexities that get introduced because of the state of the industry. Many packages used by data scientists are from open source, and even if they are well curated, there is a growing tendency to pick out the cutting-edge or unstable packages and frameworks to accelerate analytics. Different data scientists may use different versions of runtimes, different Python or R versions, or even different versions of the same packages. Predominantly data scientists work on their laptops and it becomes difficult to reproduce their environments for use by others. Since data science is now a team sport across multiple personas, involving non-practitioners, traditional application developers, execs, and IT operators, how does an enterprise create a platform for productive cross-role collaboration?
Enterprises need a very reliable and repeatable process, especially when it results in something that affects their production environments. They also require a well managed approach that enables the graduation of an asset from development through a testing and staging process to production. Given the pace of businesses nowadays, the process needs to be quite agile and flexible too—even enabling an easy path to reversing a change. Compliance and audit processes require clear lineage and history as well as approval chains.
In the traditional software engineering world, this lifecycle has been well understood and best practices have been followed for ages. But what does it mean when you have non-programmers or users who are not really trained in software engineering philosophies or who perceive all of this as "big process" roadblocks in their daily work ? How do you we engage them in a productive manner and yet support enterprise requirements for reliability, tracking, and a clear continuous integration and delivery practice? The presenters, in this session, will bring up interesting techniques based on their user research, real life customer interviews, and productized best practices. The presenters also invite the audience to share their stories and best practices to make this a lively conversation.
Speaker
Sriram Srinivasan, Senior Technical Staff Member, Analytics Platform Architect, IBM
Coca-Cola Hellenic, one of the largest Coca-Cola bottlers worldwide, has started a three year long project to substitute all legacy systems with a SAP implementation called Wave 2, in order to maximize efficiencies in use of resources and apply common best practices and polices accross the group.
S&OP as a service is a cloud solution that integrates demand planning, forecasting and Supply Planning functionality, with an external supply network optimization and digital twin simulation model, to help analyze multiple production scenarios and find the best plan to satisfy the demand, the inventory policies, with lead times, min batches, and production capacity and labor constrains. The output of the Supply Planning component include multiple analytic stories and planning capabilities as RCCP and Detailed Scheduling.
In this informative webinar, learn how migrating from a proprietary SCM solution such as Rational® ClearCase®, Serena PVCS®, CA® Harvest, etc., to Subversion or Git will make an impact on your organization and/or enterprise.
Join us as we take the lessons we've learned from successfully migrating thousands of users to today's market leading SCM solutions, and provide you with best practices in building an actionable business case and conducting a smooth transition.
Key Takeaways:
Build a business case to adopt Git and/or Subversion in your organization
How CollabNet's TeamForge platform can provide the enterprise capabilities to enable Git and/or Subversion in your enterprise
Our recommended migration strategy proven with thousands of users
Considerations for extending your SCM solution
Apache Hadoop Summit 2016: The Future of Apache Hadoop an Enterprise Architec...PwC
Hadoop Summit is an industry-leading Hadoop community event for business leaders and technology experts (such as architects, data scientists and Hadoop developers) to learn about the technologies and business drivers transforming data. PwC is helping organizations unlock their data possibilities to make data-driven decisions.
In this presentation from Revolution Analytics, Bill Jacobs presents: Are You Ready for Big Data Analytics?
"Revolution Analytics delivers advanced analytics software at half the cost of existing solutions. By building on open source R—the world's most powerful statistics software—with innovations in big data analysis, integration and user experience, Revolution Analytics meets the demands and requirements of modern data-driven businesses."
Learn more: http://www.revolutionanalytics.com
Watch the presentation video: http://wp.me/p3RLEV-12S
We are a IT consulting company providing services to clients across geographies in Data Engineering, AI/ML, Cloud & DevOps, Platform Engineering, and Process Hyper automation.
So you've just inherited several COBOL programs from a newly retired co-worker. These programs are huge, and you have only a slight idea what they do, or what they touch. How do you go about discovering how they work? This is where IBM Rational Developer for System Z (RDz) and IBM Rational Asset Analyzer (RAA) can help you understand what your source does, what it affects, and what risks are at play in changing those systems.
This was presented at the 2013 IBM Innovate Conference in Orlando, Florida.
RubiOne: Apache Spark as the Backbone of a Retail Analytics Development Envir...Databricks
The retail industry has a long history of fierce competition leading to innovations in marketing and operational efficiencies; however, this rapid advancement has not always kept pace with the latest advances in technology. This is evident by the abundance of business analysts at large enterprise retailers who are often constrained more by their own IT departments than by a lack of expertise or problems to solve.
RubiOne was designed as a vertically-integrated big data analytics development environment for retail business analysts and data scientists, with Apache Spark as the cornerstone of the product. It allows retailers to make data-driven decisions going beyond traditional analytics tools such as SQL and Excel. Using Apache Spark as one of the primary tools to query data and perform analytics, issues such as package installation, computational resources, and scalability are seamlessly handled by RubiOne.
In this session, you will learn how Apache Spark can serve as a shared backbone for an entire suite of enterprise services such as credential management, continuous integration, ad-hoc interactive data exploration, and task automation, while still maintaining hard enterprise requirements around security, availability, and cost. Learn from our war stories and best practices around transparently scaling Apache Spark clusters with Kubernetes, managing service and user isolation, and monitoring accurate enough for both debugging and billing. Beyond the technical aspects, we’ll also share our experiences of working with a global enterprise retailer to drive adoption of a modern big data technology stack centered around Apache Spark.
Presented to eRum (Budapest), May 2018
There are many common workloads in R that are "embarrassingly parallel": group-by analyses, simulations, and cross-validation of models are just a few examples. In this talk I'll describe the doAzureParallel package, a backend to the "foreach" package that automates the process of spawning a cluster of virtual machines in the Azure cloud to process iterations in parallel. This will include an example of optimizing hyperparameters for a predictive model using the "caret" package.
By David Smith. Presented at Microsoft Build (Seattle), May 7 2018.
Your data scientists have created predictive models using open-source tools, proprietary software, or some combination of both, and now you are interested in lifting and shifting those models to the cloud. In this talk, I'll describe how data scientists can transition their existing workflows — while using mostly the same tools and processes — to train and deploy machine learning models based on open source frameworks to Azure. I'll provide guidance on keeping connections to data sources up-to-date, evaluating and monitoring models, and deploying applications that make use of those models.
Presentation delivered by David Smith to NY R Conference https://www.rstats.nyc/, April 2018:
Minecraft is an open-world creativity game, and a hit with kids. To get kids interested in learning to program with R, we created the "miner" package. This package is a collection of simple functions that allow you to connect with a Minecraft instance, manipulate the world within by creating blocks and controlling the player, and to detect events within the world and react accordingly.
The miner package is intended mainly for kids, to inspire them to learn R while playing Minecraft. But the development of the package also provides some useful insights into how to build an R package to interface with a persistent API, and how to instruct others on its use. In this talk I'll describe how to set up your own Minecraft server, and how to use and extend the package. I'll also provide a few examples of the package in action in a live Minecraft session.
While Python is a widely-used tool for AI development, in this talk I'll make the case for considering R as a platform for developing models for intelligent applications. Firstly, R provides a first-class experience working deep learning frameworks with its keras integration. Equally importantly, it provides the most comprehensive suite of statistical data analysis tools, which are extremely useful for many intelligent applications such as transfer learning. I'll give a few high-level examples in this talk, and we'll go into further detail in the accompanying interactive code lab.
There are many common workloads in R that are "embarrassingly parallel": group-by analyses, simulations, and cross-validation of models are just a few examples. In this talk I'll describe several techniques available in R to speed up workloads like these, by running multiple iterations simultaneously, in parallel.
Many of these techniques require the use of a cluster of machines running R, and I'll provide examples of using cloud-based services to provision clusters for parallel computations. In particular, I will describe how you can use the SparklyR package to distribute data manipulations using the dplyr syntax, on a cluster of servers provisioned in the Azure cloud.
Presented by David Smith at Data Day Texas in Austin, January 27 2018.
A look at the changing perceptions of R, from the early days of the R project to today. Microsoft sponsor talk, presented by David Smith to the useR!2017 conference in Brussels, July 5 2017.
Predicting Loan Delinquency at One Million Transactions per SecondRevolution Analytics
Real-time applications of predictive models must be able to generate predictions at the rate that transactions are generated. Previously, such applications of models trained using R needed to be converted to other languages like C++ or Java to achieve the required throughput. In this talk, I’ll describe how to use the in-database R processing capabilities of Microsoft R Server to detect fraud in a SQL Server database of loan records at a rate exceeding one million transactions per second. I will also show the process of training the underlying gradient-boosted tree model on a large training set using the out-of-memory algorithms of Microsoft R.
Presented by David Smith at The Data Science Summit, Chicago, April 20 2017.
The ability to independently reproduce results is a critical issue within the scientific community today, and is equally important for collaboration and compliance in business. In this talk, I'll introduce several features available in R that help you make reproducibility a standard part of your data science workflow. The talk will include tips on working with data and files, combining code and output, and managing R's changing package ecosystem.
R is more than just a language. Many of the reasons why R has become such a popular tool for data science come from the ecosystem surrounding the R project. R users benefit from the many resources and packages created by the community, while commercial companies (including Microsoft) provide tools to extend and support R, and services to help people use R.
In this talk, I will give an overview of the R Ecosystem and describe how it has been a critical component of R’s success, and include several examples of Microsoft’s contributions to the ecosystem.
(Presented to EARL London, September 2016)
(Presented by David Smith at useR!2016, June 2016. Recording: https://channel9.msdn.com/Events/useR-international-R-User-conference/useR2016/R-at-Microsoft )
Since the acquisition of Revolution Analytics in April 2015, Microsoft has embarked upon a project to build R technology into many Microsoft products, so that developers and data scientists can use the R language and R packages to analyze data in their data centers and in cloud environments.
In this talk I will give an overview (and a demo or two) of how R has been integrated into various Microsoft products. Microsoft data scientists are also big users of R, and I'll describe a couple of examples of R being used to analyze operational data at Microsoft. I'll also share some of my experiences in working with open source projects at Microsoft, and my thoughts on how Microsoft works with open source communities including the R Project.
Hadoop is famously scalable. Cloud Computing is famously scalable. R – the thriving and extensible open source Data Science software – not so much. But what if we seamlessly combined Hadoop, Cloud Computing, and R to create a scalable Data Science platform? Imagine exploring, transforming, modeling, and scoring data at any scale from the comfort of your favorite R environment. Now, imagine calling a simple R function to operationalize your predictive model as a scalable, cloud-based Web Service. Learn how to leverage the magic of Hadoop on-premises or in the cloud to run your R code, thousands of open source R extension packages, and distributed implementations of the most popular machine learning algorithms at scale.
With rising business challenges in the aftermarket service areas, it becomes imperative for manufacturers to gain actionable intelligence across the warranty management life cycle.
Join Revolution Analytics and Tech Mahindra to hear how to reduce the information visibility gap:
• Identify statistically significant business drivers
• Forecast warranty costs and claims
• Improve Customer Satisfaction
Slack (or Teams) Automation for Bonterra Impact Management (fka Social Soluti...Jeffrey Haguewood
Sidekick Solutions uses Bonterra Impact Management (fka Social Solutions Apricot) and automation solutions to integrate data for business workflows.
We believe integration and automation are essential to user experience and the promise of efficient work through technology. Automation is the critical ingredient to realizing that full vision. We develop integration products and services for Bonterra Case Management software to support the deployment of automations for a variety of use cases.
This video focuses on the notifications, alerts, and approval requests using Slack for Bonterra Impact Management. The solutions covered in this webinar can also be deployed for Microsoft Teams.
Interested in deploying notification automations for Bonterra Impact Management? Contact us at sales@sidekicksolutionsllc.com to discuss next steps.
Elevating Tactical DDD Patterns Through Object CalisthenicsDorra BARTAGUIZ
After immersing yourself in the blue book and its red counterpart, attending DDD-focused conferences, and applying tactical patterns, you're left with a crucial question: How do I ensure my design is effective? Tactical patterns within Domain-Driven Design (DDD) serve as guiding principles for creating clear and manageable domain models. However, achieving success with these patterns requires additional guidance. Interestingly, we've observed that a set of constraints initially designed for training purposes remarkably aligns with effective pattern implementation, offering a more ‘mechanical’ approach. Let's explore together how Object Calisthenics can elevate the design of your tactical DDD patterns, offering concrete help for those venturing into DDD for the first time!
Generating a custom Ruby SDK for your web service or Rails API using Smithyg2nightmarescribd
Have you ever wanted a Ruby client API to communicate with your web service? Smithy is a protocol-agnostic language for defining services and SDKs. Smithy Ruby is an implementation of Smithy that generates a Ruby SDK using a Smithy model. In this talk, we will explore Smithy and Smithy Ruby to learn how to generate custom feature-rich SDKs that can communicate with any web service, such as a Rails JSON API.
Essentials of Automations: Optimizing FME Workflows with ParametersSafe Software
Are you looking to streamline your workflows and boost your projects’ efficiency? Do you find yourself searching for ways to add flexibility and control over your FME workflows? If so, you’re in the right place.
Join us for an insightful dive into the world of FME parameters, a critical element in optimizing workflow efficiency. This webinar marks the beginning of our three-part “Essentials of Automation” series. This first webinar is designed to equip you with the knowledge and skills to utilize parameters effectively: enhancing the flexibility, maintainability, and user control of your FME projects.
Here’s what you’ll gain:
- Essentials of FME Parameters: Understand the pivotal role of parameters, including Reader/Writer, Transformer, User, and FME Flow categories. Discover how they are the key to unlocking automation and optimization within your workflows.
- Practical Applications in FME Form: Delve into key user parameter types including choice, connections, and file URLs. Allow users to control how a workflow runs, making your workflows more reusable. Learn to import values and deliver the best user experience for your workflows while enhancing accuracy.
- Optimization Strategies in FME Flow: Explore the creation and strategic deployment of parameters in FME Flow, including the use of deployment and geometry parameters, to maximize workflow efficiency.
- Pro Tips for Success: Gain insights on parameterizing connections and leveraging new features like Conditional Visibility for clarity and simplicity.
We’ll wrap up with a glimpse into future webinars, followed by a Q&A session to address your specific questions surrounding this topic.
Don’t miss this opportunity to elevate your FME expertise and drive your projects to new heights of efficiency.
GDG Cloud Southlake #33: Boule & Rebala: Effective AppSec in SDLC using Deplo...James Anderson
Effective Application Security in Software Delivery lifecycle using Deployment Firewall and DBOM
The modern software delivery process (or the CI/CD process) includes many tools, distributed teams, open-source code, and cloud platforms. Constant focus on speed to release software to market, along with the traditional slow and manual security checks has caused gaps in continuous security as an important piece in the software supply chain. Today organizations feel more susceptible to external and internal cyber threats due to the vast attack surface in their applications supply chain and the lack of end-to-end governance and risk management.
The software team must secure its software delivery process to avoid vulnerability and security breaches. This needs to be achieved with existing tool chains and without extensive rework of the delivery processes. This talk will present strategies and techniques for providing visibility into the true risk of the existing vulnerabilities, preventing the introduction of security issues in the software, resolving vulnerabilities in production environments quickly, and capturing the deployment bill of materials (DBOM).
Speakers:
Bob Boule
Robert Boule is a technology enthusiast with PASSION for technology and making things work along with a knack for helping others understand how things work. He comes with around 20 years of solution engineering experience in application security, software continuous delivery, and SaaS platforms. He is known for his dynamic presentations in CI/CD and application security integrated in software delivery lifecycle.
Gopinath Rebala
Gopinath Rebala is the CTO of OpsMx, where he has overall responsibility for the machine learning and data processing architectures for Secure Software Delivery. Gopi also has a strong connection with our customers, leading design and architecture for strategic implementations. Gopi is a frequent speaker and well-known leader in continuous delivery and integrating security into software delivery.
UiPath Test Automation using UiPath Test Suite series, part 3DianaGray10
Welcome to UiPath Test Automation using UiPath Test Suite series part 3. In this session, we will cover desktop automation along with UI automation.
Topics covered:
UI automation Introduction,
UI automation Sample
Desktop automation flow
Pradeep Chinnala, Senior Consultant Automation Developer @WonderBotz and UiPath MVP
Deepak Rai, Automation Practice Lead, Boundaryless Group and UiPath MVP
Smart TV Buyer Insights Survey 2024 by 91mobiles.pdf91mobiles
91mobiles recently conducted a Smart TV Buyer Insights Survey in which we asked over 3,000 respondents about the TV they own, aspects they look at on a new TV, and their TV buying preferences.
Builder.ai Founder Sachin Dev Duggal's Strategic Approach to Create an Innova...Ramesh Iyer
In today's fast-changing business world, Companies that adapt and embrace new ideas often need help to keep up with the competition. However, fostering a culture of innovation takes much work. It takes vision, leadership and willingness to take risks in the right proportion. Sachin Dev Duggal, co-founder of Builder.ai, has perfected the art of this balance, creating a company culture where creativity and growth are nurtured at each stage.
JMeter webinar - integration with InfluxDB and GrafanaRTTS
Watch this recorded webinar about real-time monitoring of application performance. See how to integrate Apache JMeter, the open-source leader in performance testing, with InfluxDB, the open-source time-series database, and Grafana, the open-source analytics and visualization application.
In this webinar, we will review the benefits of leveraging InfluxDB and Grafana when executing load tests and demonstrate how these tools are used to visualize performance metrics.
Length: 30 minutes
Session Overview
-------------------------------------------
During this webinar, we will cover the following topics while demonstrating the integrations of JMeter, InfluxDB and Grafana:
- What out-of-the-box solutions are available for real-time monitoring JMeter tests?
- What are the benefits of integrating InfluxDB and Grafana into the load testing stack?
- Which features are provided by Grafana?
- Demonstration of InfluxDB and Grafana using a practice web application
To view the webinar recording, go to:
https://www.rttsweb.com/jmeter-integration-webinar
The Art of the Pitch: WordPress Relationships and SalesLaura Byrne
Clients don’t know what they don’t know. What web solutions are right for them? How does WordPress come into the picture? How do you make sure you understand scope and timeline? What do you do if sometime changes?
All these questions and more will be explored as we talk about matching clients’ needs with what your agency offers without pulling teeth or pulling your hair out. Practical tips, and strategies for successful relationship building that leads to closing the deal.
The Art of the Pitch: WordPress Relationships and Sales
American Century (Revolution Analytics Customer Day)
1. Revolution Analytics Customer Day
American Century Investments
February 26, 2013
Tal Sansani, CFA
Quantitative Analyst
Portfolio Manager
Sampath Thummati
IT Manager/Advisor
2. American Century Investments: Company Overview
American Century Investments | Kansas City, MO Notes
– Founded in 1958
– $125 billion assets under management*
– One of the 20 largest mutual fund companies
Quantitative Equity Group | Mountain View, CA
– $8.5 billion in assets under management across 22 mutual funds and separate
accounts
– This group takes an objective, systematic, and disciplined investment approach
– Combines quantitative stock-selection models with portfolio optimization
procedures, to systematically determine which stocks to buy or sell.
– Fully Transparent Process: Stock-selection models are founded on
economically sensible ideas and implemented using carefully calibrated
statistical methods.
The Team
– 10 experienced investment professionals with backgrounds in
finance, economics, accounting, mathematics, and statistics.
– Supported by a team of 4 IT professionals
2
3. About Me: Tal Sansani
Quantitative Research Analyst & Portfolio Manager Notes
With American Century Investments’ Quantitative Research Team for 7+
years.
Research Responsibilities
– Research and develop stock-selection signals (alpha) that systematically
inform our funds on which names to buy or sell.
– Research and develop portfolio construction techniques that help our funds
mitigate unintended risks and exposures.
– Monitor the performance dynamics of our models and asset positions with
proprietary analytics and attribution dashboards
– Currently putting research projects aside (briefly) to revamp our research and
production platforms:
Helping lead the design and development of an end-to-end quantitative
research platform, built atop an internal/collaborative R-package rACI
3
4. Revamping our Research and Production Platforms with RevoR
In 2012, after years of pain and suffering, we initiated a move away from our
existing infrastructure… Notes
Extensive limitations with our pre-existing platform:
– A disparate blend of CLOSED 3rd party financial software
– Functionally limited and difficult to customize
– Restricted to specific data vendors/sources/asset-classes
– Difficulty streamlining multi-dimensional processes
– Cumbersome and costly
In-house Solution: a streamlined, scalable end-to-end quantitative platform
Data Acquisition, Data Cleaning & Model Building
– RevoR w/ SQL, populated with variety of data-sources, and proprietary
feeds
Portfolio Optimization and Strategy Simulation
– RevoR w/ powerful 3rd Party Optimization API
Model Analytics & Performance Attribution
– RevoR w/ tableau (and existing R graphics/publishing packages)
Production Processes
– Controlled environment, deployment
4
5. rACI: A growing, multi-team, collaborative R-package within
American Century Investments
Data Feeds Notes
Market Data from Thomson American Century Quant Additional 3rd Party Data
Reuters (QA-Direct) Proprietary Data Vendors
rACI Package (w/ RevoR)
Data Acquisition Function Library
Model Building Function Library Portfolio
Optimization and
Simulation API
Analytics Function Library
Live Analytics
PRODUCTION MODEL GENERATION
AND TRADING PROCESSES
6. Immediate Research Benefits Gained By Infrastructure Revamp
Why Research likes RevoR? Notes
– We love R, and all the benefits of the fastest growing open-source statistical
programming language, but with $8 billion on the line, we sought a trusted
enterprise solution for research and production processes.
– Optimized performance: We’ve observed our simulations to be 20x faster than
with base-R, vastly improving research turnaround
Immediate Results: New RevoR-driven solution is a huge upgrade on our
pre-existing platform
– With improved analytics and streamlined research processes, we can better
understand the behavior of our models and more quickly adapt to material
market changes.
– Decoupling our investment processes from closed 3rd-party vendors has
allowed us to combine and analyze more types of financial assets (not just
stocks), leading to new investment products (combining credit
instruments, options, commodities, etc.)
– We can now leverage all the rapidly evolving libraries of R in our
research, leading to more proprietary and cutting-edge quantitative models.
6
7. Example 1: Streamlined Research Simulations/Diagnostics
A 3-Step Process: Notes
1) Construct a stock-selection
signal and submit it to the
database
2) Run customized simulations
and pre-packaged analytics
3) Visit the Quant Research
Portal for the results
7
8. Example 2: Opening up Our Research With R’s Rapidly Evolving Open-Source
Library
By integrating existing financial Notes
The Economic
datasets with new/unique Ecosystem
information, while leveraging a
variety of packages available in
R, our group can explore new
avenues of research.
In this example, we use
revenues between customers
and suppliers, to explore how
information travels through an
economic network.
Note: R’s igraph package was
used for much of the internal
analysis, while Gephi was used
to construct the chart you see on
the right.
8
9. About me: Sampath Thummati
Responsibilities Notes
– Architect and design investment management systems to support quantitative
research and portfolio management.
– Production support for quant model generation and other investment
management processes.
– Currently leading the implementation of quant roadmap to build efficient cross-
asset class research platform for alpha generation, back-testing and analytics.
R Experience
– R-user for couple of years now
– Integrating applications interfacing with R code
Database, Java Components, Batch Scheduling System and Custom
applications
– Building configuration functions
Error handling
Application logging
FOR INTERNAL USE ONLY
9
10. Technology’s Role in Innovative Quantitative Investment
Management
ACCESS TO UNIQUE DATA-SETS Notes
– New, innovative investment ideas are the life-blood of our group, and by
extension, so too is our ability to process new information. It’s absolutely
critical for us to rapidly adapt to complex data-sets and new technologies.
COMPUTATIONAL CAPACITY
– Controlled risk management and modern portfolio construction techniques
require sophisticated optimization toolsets.
CUSTOMIZED ANALYTICS
– Building proprietary models requires proprietary analytics/feedback into the
model
ROBUST DATA FORENSICS
– Proprietary data quality tools ensure inputs into trading processes go through a
battery of tests
INDUSTRIAL STRENGTH PRODUCTION PROCESSES
FOR INTERNAL USE ONLY
10
11. Immediate Production Benefits Gained By Infrastructure Revamp
Why Production likes RevoR? Notes
– Open-source tools generally avoided in large-scale money management
Revo support model
Package verification and certification eliminates risks of malicious code
– Optimized performance
Enables us to run overnight production processes in time for next business
day
– Business and production friendly programming language
Research and production now share a common language, reducing risk of
errors in code translation
Reduced time to production implementation
11
13. What we did on the production side?
Error handling Notes
– Intensive ‘try-catch’ use
– Storing images at the point of failure
Robust logging procedures
– Easy to use calls to log
– Rolling logs
Setup batch jobs
– Use of Rscript
– Handling return code
13
16. What we did on the production side?
Interface with dependency management system Notes
Controlled processes to stabilize production environment
– Third-party packages
– Deploying application and modified packages
– Use of Rprofile for enterprise settings
16
17. Current Status
We are about 75% complete with our transition to RevoR Notes
There is growing interest from other parts of the company to contribute and
employ rACI
So far, we haven’t experienced any setbacks and are very satisfied with what has
been accomplished with RevoR
17
18. Q&A
Notes
Sampath Thummati
st8@americancentury.com
Tal Sansani
t4s@americancentury.com
18