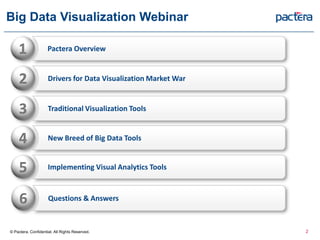
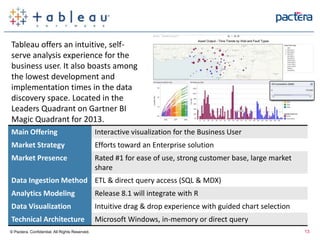
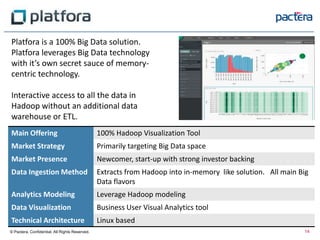
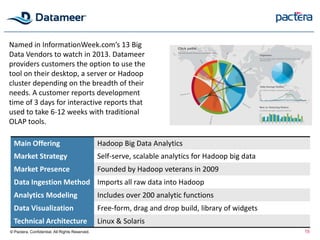
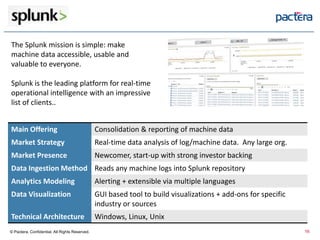
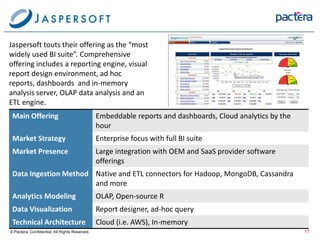
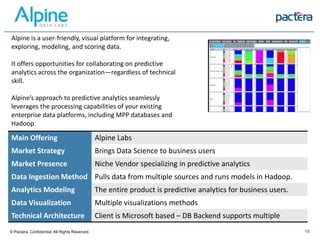
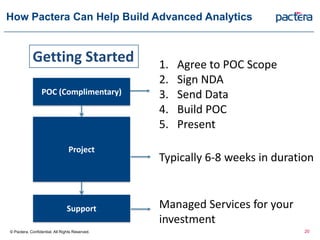
Big Data Visualization
Webinar
9/19/2013
Big Data Visualization Webinar
2© Pactera. Confidential. All Rights Reserved.
2 Drivers for Data Visualization Market War
3 Traditional Visualization Tools
4 New Breed of Big Data Tools
5 Implementing Visual Analytics Tools
1 Pactera Overview
6 Questions & Answers
3
Global Footprint and Flexible Delivery Capabilities
© Pactera. Confidential. All Rights Reserved.
North America & EU: 500 Asia Pacific: 800 Greater China: 22,000Global FTE: 23,300
Pactera is a global company strategically headquartered in China, enabling 360 partnerships
with global brands seeking to expand in one of the world’s largest and fastest-growing markets.
Criteria for (Big) Data Visualization
© Pactera. Confidential. All Rights Reserved. 4
Business Benefits of Data Visualization
Improves Decision Making
Supports natural ability to think and understand visually
Real-Time and Ad-Hoc Analysis
Get real-time results and build reports without advance setup
Self-Service for End Users
Makes data available to more users, no expertise required
Increase Productivity and Save Time
Quickly find and analyze relevant data
Improves Collaboration
Bridge decision gaps, create a shared view and align decision making
© Pactera. Confidential. All Rights Reserved. 5
Drivers for Market Demand & War
Traditional BI & Business Discovery Markets are colliding
© Pactera. Confidential. All Rights Reserved. 6
Closer Look at Selected Vendors
© Pactera. Confidential. All Rights Reserved. 7
Microsoft continues to enhance their reporting capabilities
with enhancements to their Excel, SharePoint, SSRS, SSAS
suite. The newest addition is Power View. The name for
this package of offerings is MS SQL Server Reporting
Services 2012.
Power View enables quick and easy visualization of your
data while allowing sharing and collaboration of business
insights in a familiar SharePoint Server environment.
Main Offering Power View
Market Strategy Primarily targeting Microsoft Shops with lower cost BI reporting
Market Presence Mega-Vendor with legacy of success
Data Ingestion Method Extracts from Hadoop via ODBC
Analytics Modeling N/A
Data Visualization Ad-Hoc visualization experience for end-users
Technical Architecture Microsoft based
© Pactera. Confidential. All Rights Reserved. 8
Microsoft Big Data Visualization
© Pactera. Confidential. All Rights Reserved. 9
Microsoft Big Data Visualization
© Pactera. Confidential. All Rights Reserved. 10
The QlikView Business Discovery
platform delivers true self-service BI
that empowers business users with a
Google like experience via in-memory
technology. Positioned in upper
quadrant in the Gartner Magic
Quadrant.
Main Offering In-Memory – Visual Analytics
Market Strategy Departmental solutions but moving to enterprise
Market Presence In-memory pioneer and now Business Discovery Gorilla
Data Ingestion Method QV Scripting language much like VB and SQL
Analytics Modeling On-par with Excel
Data Visualization Very Good built-in with ability to customize
Technical Architecture Microsoft – In-Memory
© Pactera. Confidential. All Rights Reserved. 11
TIBCO has a huge family of products that can create a very
powerful Visual Analytics environment that moves
significantly beyond pretty pictures.
TIBCO is one of the most enterprise ready visual analytic
tools in the market with strong in-memory/direct to
database, predictive analytics, geospatial, and
collaboration functionality.
Main Offering TIBCO Spotfire
Market Strategy More sophisticated Visual Analytics and Data Science Needs
Market Presence Mega-Vendor with legacy of success
Data Ingestion Method Extracts from Hadoop via Advanced Data Services
Analytics Modeling Strongest Visual analytics tool for Analytical modeling – R/SAS
Data Visualization Drag and drop visual analytics
Technical Architecture Microsoft based
© Pactera. Confidential. All Rights Reserved. 12
Main Offering Interactive visualization for the Business User
Market Strategy Efforts toward an Enterprise solution
Market Presence Rated #1 for ease of use, strong customer base, large market
share
Data Ingestion Method ETL & direct query access (SQL & MDX)
Analytics Modeling Release 8.1 will integrate with R
Data Visualization Intuitive drag & drop experience with guided chart selection
Technical Architecture Microsoft Windows, in-memory or direct query
Tableau offers an intuitive, self-
serve analysis experience for the
business user. It also boasts among
the lowest development and
implementation times in the data
discovery space. Located in the
Leaders Quadrant on Gartner BI
Magic Quadrant for 2013.
© Pactera. Confidential. All Rights Reserved. 13
Platfora is a 100% Big Data solution.
Platfora leverages Big Data technology
with it’s own secret sauce of memory-
centric technology.
Interactive access to all the data in
Hadoop without an additional data
warehouse or ETL.
Main Offering 100% Hadoop Visualization Tool
Market Strategy Primarily targeting Big Data space
Market Presence Newcomer, start-up with strong investor backing
Data Ingestion Method Extracts from Hadoop into in-memory like solution. All main Big
Data flavors
Analytics Modeling Leverage Hadoop modeling
Data Visualization Business User Visual Analytics tool
Technical Architecture Linux based
© Pactera. Confidential. All Rights Reserved. 14
Named in InformationWeek.com’s 13 Big
Data Vendors to watch in 2013. Datameer
providers customers the option to use the
tool on their desktop, a server or Hadoop
cluster depending on the breadth of their
needs. A customer reports development
time of 3 days for interactive reports that
used to take 6-12 weeks with traditional
OLAP tools.
Main Offering Hadoop Big Data Analytics
Market Strategy Self-serve, scalable analytics for Hadoop big data
Market Presence Founded by Hadoop veterans in 2009
Data Ingestion Method Imports all raw data into Hadoop
Analytics Modeling Includes over 200 analytic functions
Data Visualization Free-form, drag and drop build, library of widgets
Technical Architecture Linux & Solaris
© Pactera. Confidential. All Rights Reserved. 15
The Splunk mission is simple: make
machine data accessible, usable and
valuable to everyone.
Splunk is the leading platform for real-time
operational intelligence with an impressive
list of clients..
Main Offering Consolidation & reporting of machine data
Market Strategy Real-time data analysis of log/machine data. Any large org.
Market Presence Newcomer, start-up with strong investor backing
Data Ingestion Method Reads any machine logs into Splunk repository
Analytics Modeling Alerting + extensible via multiple languages
Data Visualization GUI based tool to build visualizations + add-ons for specific
industry or sources
Technical Architecture Windows, Linux, Unix
© Pactera. Confidential. All Rights Reserved. 16
Main Offering Embeddable reports and dashboards, Cloud analytics by the
hour
Market Strategy Enterprise focus with full BI suite
Market Presence Large integration with OEM and SaaS provider software
offerings
Data Ingestion Method Native and ETL connectors for Hadoop, MongoDB, Cassandra
and more
Analytics Modeling OLAP, Open-source R
Data Visualization Report designer, ad-hoc query
Technical Architecture Cloud (i.e. AWS), In-memory
Jaspersoft touts their offering as the “most
widely used BI suite”. Comprehensive
offering includes a reporting engine, visual
report design environment, ad hoc
reports, dashboards and in-memory
analysis server, OLAP data analysis and an
ETL engine.
© Pactera. Confidential. All Rights Reserved. 17
Main Offering Alpine Labs
Market Strategy Brings Data Science to business users
Market Presence Niche Vendor specializing in predictive analytics
Data Ingestion Method Pulls data from multiple sources and runs models in Hadoop.
Analytics Modeling The entire product is predictive analytics for business users.
Data Visualization Multiple visualizations methods
Technical Architecture Client is Microsoft based – DB Backend supports multiple
Alpine is a user-friendly, visual platform for integrating,
exploring, modeling, and scoring data.
It offers opportunities for collaborating on predictive
analytics across the organization—regardless of technical
skill.
Alpine’s approach to predictive analytics seamlessly
leverages the processing capabilities of your existing
enterprise data platforms, including MPP databases and
Hadoop.
© Pactera. Confidential. All Rights Reserved. 18
Alpine Data – Sample Views
© Pactera. Confidential. All Rights Reserved. 19
20
How Pactera Can Help Build Advanced Analytics
© Pactera. Confidential. All Rights Reserved.
POC (Complimentary)
Getting Started
Project
Support
Typically 6-8 weeks in duration
Managed Services for your
investment
1. Agree to POC Scope
2. Sign NDA
3. Send Data
4. Build POC
5. Present
Thank you
© Pactera. Confidential. All Rights Reserved.
Kurt Lueck
Managing Director, Business Intelligence & Analytics
Pactera
Email: Kurt.Lueck@pactera.com
Phone: 704.968.4061
Lauren Allen
Senior Consultant, BI & Analytics Practice
Email: Lauren.Allen@pactera.com

Using Visualization to Succeed with Big Data

  • 1.
  • 2.
    Big Data VisualizationWebinar 2© Pactera. Confidential. All Rights Reserved. 2 Drivers for Data Visualization Market War 3 Traditional Visualization Tools 4 New Breed of Big Data Tools 5 Implementing Visual Analytics Tools 1 Pactera Overview 6 Questions & Answers
  • 3.
    3 Global Footprint andFlexible Delivery Capabilities © Pactera. Confidential. All Rights Reserved. North America & EU: 500 Asia Pacific: 800 Greater China: 22,000Global FTE: 23,300 Pactera is a global company strategically headquartered in China, enabling 360 partnerships with global brands seeking to expand in one of the world’s largest and fastest-growing markets.
  • 4.
    Criteria for (Big)Data Visualization © Pactera. Confidential. All Rights Reserved. 4
  • 5.
    Business Benefits ofData Visualization Improves Decision Making Supports natural ability to think and understand visually Real-Time and Ad-Hoc Analysis Get real-time results and build reports without advance setup Self-Service for End Users Makes data available to more users, no expertise required Increase Productivity and Save Time Quickly find and analyze relevant data Improves Collaboration Bridge decision gaps, create a shared view and align decision making © Pactera. Confidential. All Rights Reserved. 5
  • 6.
    Drivers for MarketDemand & War Traditional BI & Business Discovery Markets are colliding © Pactera. Confidential. All Rights Reserved. 6
  • 7.
    Closer Look atSelected Vendors © Pactera. Confidential. All Rights Reserved. 7
  • 8.
    Microsoft continues toenhance their reporting capabilities with enhancements to their Excel, SharePoint, SSRS, SSAS suite. The newest addition is Power View. The name for this package of offerings is MS SQL Server Reporting Services 2012. Power View enables quick and easy visualization of your data while allowing sharing and collaboration of business insights in a familiar SharePoint Server environment. Main Offering Power View Market Strategy Primarily targeting Microsoft Shops with lower cost BI reporting Market Presence Mega-Vendor with legacy of success Data Ingestion Method Extracts from Hadoop via ODBC Analytics Modeling N/A Data Visualization Ad-Hoc visualization experience for end-users Technical Architecture Microsoft based © Pactera. Confidential. All Rights Reserved. 8
  • 9.
    Microsoft Big DataVisualization © Pactera. Confidential. All Rights Reserved. 9
  • 10.
    Microsoft Big DataVisualization © Pactera. Confidential. All Rights Reserved. 10
  • 11.
    The QlikView BusinessDiscovery platform delivers true self-service BI that empowers business users with a Google like experience via in-memory technology. Positioned in upper quadrant in the Gartner Magic Quadrant. Main Offering In-Memory – Visual Analytics Market Strategy Departmental solutions but moving to enterprise Market Presence In-memory pioneer and now Business Discovery Gorilla Data Ingestion Method QV Scripting language much like VB and SQL Analytics Modeling On-par with Excel Data Visualization Very Good built-in with ability to customize Technical Architecture Microsoft – In-Memory © Pactera. Confidential. All Rights Reserved. 11
  • 12.
    TIBCO has ahuge family of products that can create a very powerful Visual Analytics environment that moves significantly beyond pretty pictures. TIBCO is one of the most enterprise ready visual analytic tools in the market with strong in-memory/direct to database, predictive analytics, geospatial, and collaboration functionality. Main Offering TIBCO Spotfire Market Strategy More sophisticated Visual Analytics and Data Science Needs Market Presence Mega-Vendor with legacy of success Data Ingestion Method Extracts from Hadoop via Advanced Data Services Analytics Modeling Strongest Visual analytics tool for Analytical modeling – R/SAS Data Visualization Drag and drop visual analytics Technical Architecture Microsoft based © Pactera. Confidential. All Rights Reserved. 12
  • 13.
    Main Offering Interactivevisualization for the Business User Market Strategy Efforts toward an Enterprise solution Market Presence Rated #1 for ease of use, strong customer base, large market share Data Ingestion Method ETL & direct query access (SQL & MDX) Analytics Modeling Release 8.1 will integrate with R Data Visualization Intuitive drag & drop experience with guided chart selection Technical Architecture Microsoft Windows, in-memory or direct query Tableau offers an intuitive, self- serve analysis experience for the business user. It also boasts among the lowest development and implementation times in the data discovery space. Located in the Leaders Quadrant on Gartner BI Magic Quadrant for 2013. © Pactera. Confidential. All Rights Reserved. 13
  • 14.
    Platfora is a100% Big Data solution. Platfora leverages Big Data technology with it’s own secret sauce of memory- centric technology. Interactive access to all the data in Hadoop without an additional data warehouse or ETL. Main Offering 100% Hadoop Visualization Tool Market Strategy Primarily targeting Big Data space Market Presence Newcomer, start-up with strong investor backing Data Ingestion Method Extracts from Hadoop into in-memory like solution. All main Big Data flavors Analytics Modeling Leverage Hadoop modeling Data Visualization Business User Visual Analytics tool Technical Architecture Linux based © Pactera. Confidential. All Rights Reserved. 14
  • 15.
    Named in InformationWeek.com’s13 Big Data Vendors to watch in 2013. Datameer providers customers the option to use the tool on their desktop, a server or Hadoop cluster depending on the breadth of their needs. A customer reports development time of 3 days for interactive reports that used to take 6-12 weeks with traditional OLAP tools. Main Offering Hadoop Big Data Analytics Market Strategy Self-serve, scalable analytics for Hadoop big data Market Presence Founded by Hadoop veterans in 2009 Data Ingestion Method Imports all raw data into Hadoop Analytics Modeling Includes over 200 analytic functions Data Visualization Free-form, drag and drop build, library of widgets Technical Architecture Linux & Solaris © Pactera. Confidential. All Rights Reserved. 15
  • 16.
    The Splunk missionis simple: make machine data accessible, usable and valuable to everyone. Splunk is the leading platform for real-time operational intelligence with an impressive list of clients.. Main Offering Consolidation & reporting of machine data Market Strategy Real-time data analysis of log/machine data. Any large org. Market Presence Newcomer, start-up with strong investor backing Data Ingestion Method Reads any machine logs into Splunk repository Analytics Modeling Alerting + extensible via multiple languages Data Visualization GUI based tool to build visualizations + add-ons for specific industry or sources Technical Architecture Windows, Linux, Unix © Pactera. Confidential. All Rights Reserved. 16
  • 17.
    Main Offering Embeddablereports and dashboards, Cloud analytics by the hour Market Strategy Enterprise focus with full BI suite Market Presence Large integration with OEM and SaaS provider software offerings Data Ingestion Method Native and ETL connectors for Hadoop, MongoDB, Cassandra and more Analytics Modeling OLAP, Open-source R Data Visualization Report designer, ad-hoc query Technical Architecture Cloud (i.e. AWS), In-memory Jaspersoft touts their offering as the “most widely used BI suite”. Comprehensive offering includes a reporting engine, visual report design environment, ad hoc reports, dashboards and in-memory analysis server, OLAP data analysis and an ETL engine. © Pactera. Confidential. All Rights Reserved. 17
  • 18.
    Main Offering AlpineLabs Market Strategy Brings Data Science to business users Market Presence Niche Vendor specializing in predictive analytics Data Ingestion Method Pulls data from multiple sources and runs models in Hadoop. Analytics Modeling The entire product is predictive analytics for business users. Data Visualization Multiple visualizations methods Technical Architecture Client is Microsoft based – DB Backend supports multiple Alpine is a user-friendly, visual platform for integrating, exploring, modeling, and scoring data. It offers opportunities for collaborating on predictive analytics across the organization—regardless of technical skill. Alpine’s approach to predictive analytics seamlessly leverages the processing capabilities of your existing enterprise data platforms, including MPP databases and Hadoop. © Pactera. Confidential. All Rights Reserved. 18
  • 19.
    Alpine Data –Sample Views © Pactera. Confidential. All Rights Reserved. 19
  • 20.
    20 How Pactera CanHelp Build Advanced Analytics © Pactera. Confidential. All Rights Reserved. POC (Complimentary) Getting Started Project Support Typically 6-8 weeks in duration Managed Services for your investment 1. Agree to POC Scope 2. Sign NDA 3. Send Data 4. Build POC 5. Present
  • 21.
    Thank you © Pactera.Confidential. All Rights Reserved. Kurt Lueck Managing Director, Business Intelligence & Analytics Pactera Email: Kurt.Lueck@pactera.com Phone: 704.968.4061 Lauren Allen Senior Consultant, BI & Analytics Practice Email: Lauren.Allen@pactera.com