Download to read offline
![Accepted to the Astrophysical Journal
Preprint typeset using LATEX style emulateapj v. 5/2/11
ALMA MULTI–LINE IMAGING OF THE NEARBY STARBURST NGC 253
Meier, David S.1,2,3
, Walter, Fabian4,2
, Bolatto, Alberto D.5
, Leroy, Adam K.4
, Ott, J¨urgen2
, Rosolowsky,
Erik7
, Veilleux, Sylvain8,5
, Warren, Steven R.5
, Weiß, Axel9
, Zwaan, Martin A.10
, Zschaechner, Laura K.4
Draft version January 26, 2015
ABSTRACT
We present spatially resolved (⇠50 pc) imaging of molecular gas species in the central kilopar-
sec of the nearby starburst galaxy NGC 253, based on observations taken with the Atacama Large
Millimeter/submillimeter Array (ALMA). A total of 50 molecular lines are detected over a 13 GHz
bandwidth imaged in the 3 mm band. Unambiguous identifications are assigned for 27 lines. Based
on the measured high CO/C17
O isotopic line ratio (&350), we show that 12
CO(1 0) has moder-
ate optical depths. A comparison of the HCN and HCO+
with their 13
C–substituted isotopologues
shows that the HCN(1–0) and HCO+
(1–0) lines have optical depths at least comparable to CO(1–0).
H13
CN/H13
CO+
(and H13
CN/HN13
C) line ratios provide tighter constraints on dense gas properties
in this starburst. SiO has elevated abundances across the nucleus. HNCO has the most distinctive
morphology of all the bright lines, with its global luminosity dominated by the outer parts of the
central region. The dramatic variation seen in the HNCO/SiO line ratio suggests that some of the
chemical signatures of shocked gas are being erased in the presence of dominating central radiation
fields (traced by C2H and CN). High density molecular gas tracers (including HCN, HCO+
, and CN)
are detected at the base of the molecular outflow. We also detect hydrogen recombination lines that,
like their ↵ counterparts, show compact, centrally peaked morphologies, distinct from the molecular
gas tracers. A number of sulfur based species are mapped (CS, SO, NS, C2S, H2CS and CH3SH) and
have morphologies similar to SiO.
Subject headings: galaxies: formation — galaxies: evolution — individual galaxy (NGC 253) —
astrochemistry; ISM — radio lines
1. INTRODUCTION
Characterizing the physical properties of the molecular
gas phase in galaxies, the key phase for star formation
(review by Kennicutt & Evans 2012), is among the main
drivers in the studies of nearby galaxies. The 12
CO line
is by far the brightest millimeter–wave molecular line in
the interstellar medium (ISM) and has therefore been the
main tracer of the molecular medium in both low– and
high–redshift studies (e.g., reviews by Bolatto, Leroy &
Wolfire 2013 and Carilli & Walter 2013). Even though
CO emission is a reasonable tracer of the morphology
and mass associated with the molecular ISM, observa-
tions of other tracer molecules, that have di↵erent crit-
ical densities and excitation temperatures, provide key
information to constrain the physical processes in the
1 New Mexico Institute of Mining and Technology, 801 Leroy
Place, Socorro, NM, USA; E-mail: dmeier@nmt.edu
2 National Radio Astronomy Observatory, Pete V. Domenici
Array Science Center, P.O. Box O, Socorro, NM, 87801, USA
3 Adjunct Astronomer, National Radio Astronomy Observa-
tory
4 Max-Planck Institut f¨ur Astronomie, K¨onigstuhl 17, D-
69117, Heidelberg, Germany
5 University of Maryland, College Park, Department of As-
tronomy and Joint Space–Science Institute
6 National Radio Astronomy Observatory, 520 Edgemont
Road, Charlottesville, VA 22903, USA
7 Department of Physics, University of Alberta, Edmonton AB
T6G 2E1, Canada
8 Department of Astronomy, University of Maryland, College
Park, MD 20742, USA
9 Max Planck Institut f¨ur Radioastronomie, Auf dem Hgel 69,
53121 Bonn
10 European Southern Observatory, Karl-Schwarzschild-Str.
2, D-85748 Garching bei M¨unchen, Germany
ISM. Studying a whole suite of molecular line tracers
sheds light on the chemical state of the ISM, including
the gas cooling and ionization balance in the molecular
ISM. Ultimately, surveying provides the means by which
to characterize molecular cloud conditions that are af-
fected by the galactic environment, including feedback
and shocks caused by star formation, and dynamical pro-
cesses within a galaxy (e.g., Meier & Turner 2005).
Millimeter line surveys of nearby galaxies using single–
dish telescopes have shown that their spectra are rich in
molecular lines (e.g., Usero et al. 2004, Martin et al. 2006,
Costagliola et al. 2011, Snell et al. 2011, Aladro et al.
2011, 2013). However, given the resolution of single–dish
telescopes, most of these studies could only provide in-
tegrated measurements, making it di cult to investigate
spatial changes in chemical properties. Spatially resolved
surveys using millimeter interferometers have been lim-
ited to only a handful of transitions due to small band-
widths and low sensitivity (e.g., Meier & Turner 2005,
2012, Meier et al. 2014, Martin et al. 2014). These
studies demonstrate the presence of strong chemical dif-
ferentiation can exist within the molecular gas in nearby
galaxies and their usefulness for constraining the evolu-
tionary properties of the nucleus.
The newly commissioned ALMA facility is revolution-
izing chemical studies of galaxies. Its sensitivity, even
in ‘Early Science’ mode is unprecedented, and molecules
that are typically significantly fainter than the brightest
ones (i.e., CO, HCN, HCO+
, CN) can be detected in rea-
sonable integration times. In addition ALMA’s large in-
stantaneous bandwidth of ⌫ =8 GHz implies that mul-
tiple lines (in particular in the 3 mm band where ⌫/⌫ is
arXiv:1501.05694v1[astro-ph.GA]23Jan2015](https://image.slidesharecdn.com/almamultilineimagingofthenearbystarburstngc253-150218131941-conversion-gate02/85/Alma-multi-line_imaging_of_the_nearby_starburst_ngc_253-1-320.jpg)
![Accepted to the Astrophysical Journal
Preprint typeset using LATEX style emulateapj v. 5/2/11
ALMA MULTI–LINE IMAGING OF THE NEARBY STARBURST NGC 253
Meier, David S.1,2,3
, Walter, Fabian4,2
, Bolatto, Alberto D.5
, Leroy, Adam K.4
, Ott, J¨urgen2
, Rosolowsky,
Erik7
, Veilleux, Sylvain8,5
, Warren, Steven R.5
, Weiß, Axel9
, Zwaan, Martin A.10
, Zschaechner, Laura K.4
Draft version January 26, 2015
ABSTRACT
We present spatially resolved (⇠50 pc) imaging of molecular gas species in the central kilopar-
sec of the nearby starburst galaxy NGC 253, based on observations taken with the Atacama Large
Millimeter/submillimeter Array (ALMA). A total of 50 molecular lines are detected over a 13 GHz
bandwidth imaged in the 3 mm band. Unambiguous identifications are assigned for 27 lines. Based
on the measured high CO/C17
O isotopic line ratio (&350), we show that 12
CO(1 0) has moder-
ate optical depths. A comparison of the HCN and HCO+
with their 13
C–substituted isotopologues
shows that the HCN(1–0) and HCO+
(1–0) lines have optical depths at least comparable to CO(1–0).
H13
CN/H13
CO+
(and H13
CN/HN13
C) line ratios provide tighter constraints on dense gas properties
in this starburst. SiO has elevated abundances across the nucleus. HNCO has the most distinctive
morphology of all the bright lines, with its global luminosity dominated by the outer parts of the
central region. The dramatic variation seen in the HNCO/SiO line ratio suggests that some of the
chemical signatures of shocked gas are being erased in the presence of dominating central radiation
fields (traced by C2H and CN). High density molecular gas tracers (including HCN, HCO+
, and CN)
are detected at the base of the molecular outflow. We also detect hydrogen recombination lines that,
like their ↵ counterparts, show compact, centrally peaked morphologies, distinct from the molecular
gas tracers. A number of sulfur based species are mapped (CS, SO, NS, C2S, H2CS and CH3SH) and
have morphologies similar to SiO.
Subject headings: galaxies: formation — galaxies: evolution — individual galaxy (NGC 253) —
astrochemistry; ISM — radio lines
1. INTRODUCTION
Characterizing the physical properties of the molecular
gas phase in galaxies, the key phase for star formation
(review by Kennicutt & Evans 2012), is among the main
drivers in the studies of nearby galaxies. The 12
CO line
is by far the brightest millimeter–wave molecular line in
the interstellar medium (ISM) and has therefore been the
main tracer of the molecular medium in both low– and
high–redshift studies (e.g., reviews by Bolatto, Leroy &
Wolfire 2013 and Carilli & Walter 2013). Even though
CO emission is a reasonable tracer of the morphology
and mass associated with the molecular ISM, observa-
tions of other tracer molecules, that have di↵erent crit-
ical densities and excitation temperatures, provide key
information to constrain the physical processes in the
1 New Mexico Institute of Mining and Technology, 801 Leroy
Place, Socorro, NM, USA; E-mail: dmeier@nmt.edu
2 National Radio Astronomy Observatory, Pete V. Domenici
Array Science Center, P.O. Box O, Socorro, NM, 87801, USA
3 Adjunct Astronomer, National Radio Astronomy Observa-
tory
4 Max-Planck Institut f¨ur Astronomie, K¨onigstuhl 17, D-
69117, Heidelberg, Germany
5 University of Maryland, College Park, Department of As-
tronomy and Joint Space–Science Institute
6 National Radio Astronomy Observatory, 520 Edgemont
Road, Charlottesville, VA 22903, USA
7 Department of Physics, University of Alberta, Edmonton AB
T6G 2E1, Canada
8 Department of Astronomy, University of Maryland, College
Park, MD 20742, USA
9 Max Planck Institut f¨ur Radioastronomie, Auf dem Hgel 69,
53121 Bonn
10 European Southern Observatory, Karl-Schwarzschild-Str.
2, D-85748 Garching bei M¨unchen, Germany
ISM. Studying a whole suite of molecular line tracers
sheds light on the chemical state of the ISM, including
the gas cooling and ionization balance in the molecular
ISM. Ultimately, surveying provides the means by which
to characterize molecular cloud conditions that are af-
fected by the galactic environment, including feedback
and shocks caused by star formation, and dynamical pro-
cesses within a galaxy (e.g., Meier & Turner 2005).
Millimeter line surveys of nearby galaxies using single–
dish telescopes have shown that their spectra are rich in
molecular lines (e.g., Usero et al. 2004, Martin et al. 2006,
Costagliola et al. 2011, Snell et al. 2011, Aladro et al.
2011, 2013). However, given the resolution of single–dish
telescopes, most of these studies could only provide in-
tegrated measurements, making it di cult to investigate
spatial changes in chemical properties. Spatially resolved
surveys using millimeter interferometers have been lim-
ited to only a handful of transitions due to small band-
widths and low sensitivity (e.g., Meier & Turner 2005,
2012, Meier et al. 2014, Martin et al. 2014). These
studies demonstrate the presence of strong chemical dif-
ferentiation can exist within the molecular gas in nearby
galaxies and their usefulness for constraining the evolu-
tionary properties of the nucleus.
The newly commissioned ALMA facility is revolution-
izing chemical studies of galaxies. Its sensitivity, even
in ‘Early Science’ mode is unprecedented, and molecules
that are typically significantly fainter than the brightest
ones (i.e., CO, HCN, HCO+
, CN) can be detected in rea-
sonable integration times. In addition ALMA’s large in-
stantaneous bandwidth of ⌫ =8 GHz implies that mul-
tiple lines (in particular in the 3 mm band where ⌫/⌫ is
arXiv:1501.05694v1[astro-ph.GA]23Jan2015](https://image.slidesharecdn.com/almamultilineimagingofthenearbystarburstngc253-150218131941-conversion-gate02/75/Alma-multi-line_imaging_of_the_nearby_starburst_ngc_253-1-2048.jpg)
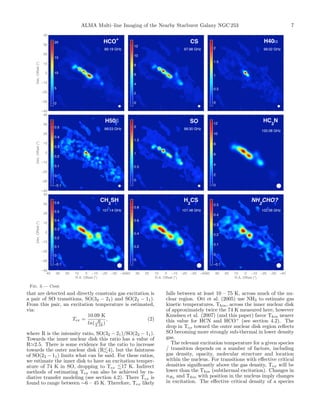
![2 Meier, Walter, Bolatto et al.
highest) are covered in each observation. The study pre-
sented here does not intend to discuss the details of every
detected line but instead present the data and highlight the
rich chemistry provided by ALMA’s new capabilities, in
the nearby starburst galaxy NGC 253. This paper com-
plements two other studies of NGC 253 using the same
dataset, one describing the molecular outflow revealed in
12
CO emission (Bolatto et al. 2013, hereafter B13) and
the other constraining the molecular clump properties in
the central starburst region using the brightest dense gas
tracers available (Leroy et al. 2014, hereafter L14).
The paper is structured as follows: Sec. 2 briefly sum-
marizes the observations, data reduction and data prod-
ucts. In Sec. 3 we present our identification of the rich
suite of molecular line emission in the galaxy. We then
proceed to sketch a simple picture of the conditions in the
central region of NGC 253, by focusing on several groups
of key molecular gas tracers (Sec. 4). We conclude by
providing a short summary in Sec. 5. Throughout the pa-
per we adopt a distance to NGC 253 of 3.5 Mpc (Rekola
et al. 2005), i.e., 1” corresponds to 17 pc at that distance.
The systemic velocity of NGC 253 is ⇠250 km s 1
(e.g.,
Houghton et al. 1997).
2. OBSERVATIONS AND DATA REDUCTION
Observations: We have mapped NGC 253 with ALMA
in cycle 0 (16 antenna array) in two di↵erent frequency
setups and configurations. Details regarding the obser-
vations and data reduction can be found in B13 and
L14 and we here summarize the observational parameters
that are most relevant for the current study. Both se-
tups covered an instantaneous bandwidth of 8 GHz each:
The first frequency setup, covering 85.6–89.6 GHz (lower
side–band, LSB) and 97.4–101.4 GHz (upper side–band,
USB), is a central 3–point mosaic along the major axis
in the extended configuration (average beam size: ⇠2”,
⇠35 pc). This mosaic covers the central 10
(1 kpc) of
NGC 253’s starburst. The second setup covers 99.8–
103.7 GHz (LSB) and 111.8–115.7 GHz (USB) and is a 7–
point mosaic of NGC 253’s center in the compact configu-
ration. This yields an average beam size of ⇠4” (⇠70 pc)
and a field of view of roughly 1.50
(⇠1.5 kpc).
Data reduction: All of the calibration and imaging of
the data cubes was completed within CASA, including
self–calibration to remove residual phase and flux calibra-
tion errors. After imaging, much of the remaining analy-
sis was performed with IDL scripts with some use of the
Miriad and Matlab software packages. Most of the data
presented here is based on the continuum–subtracted
cube, where the continuum was defined in those spec-
tral regions where no line emission was evident. Our
final cube has 20 km s 1
velocity resolution and a typical
RMS of ⇠2.0 mJy beam 1
(extended, LSB: 1.9 mJy, ex-
tended, USB: 2.1 mJy, compact, LSB: 2.0 mJy, compact,
USB: 3.3 mJy).
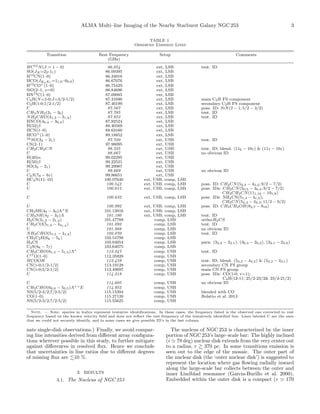
Final data cubes: We display the information in the
data cubes in two complementary fashions: through a
position–velocity (pV) diagram along the major axis of
NGC 253 in Fig. 1; a representation similar to long–slit
spectroscopy in optical/NIR astronomy (Fig. 1). The
second (Fig. 2) is a single spectrum taken toward a cen-
tral molecular peak (position 5). As outlined above, the
data consist of four final data cubes, the LSB and USB
cubes for the extended configuration, and those for the
compact configuration. Figs. 1 and 2 also show our line
identification (see also Tab. 1), as further discussed in
Sec. 3.
Integrated line maps: We created line cubes for each
line, and then blanked those with a mask derived from
the CO(1-0) line (by far the brightest line in the band-
pass). The integrated intensity map for a given line was
then derived by simply adding all data in the respective
data cube (without any further flux cuto↵). Integrated
line maps are corrected for primary beam attenuation
and are shown in Fig. 3.
Uncertainties: We calculated error maps by taking the
number of channels per pixel into account. An inspec-
tion of the data cubes revealed that these error maps
provide too optimistic uncertainties, as they do not ac-
count for artifacts (in particular the negative ‘bowl’ due
to the missing short spacings) in the current data. We
thus adopt a conservative 10% error for pixels that have
been detected at high S/N (> 10), where the noise N
is from taken from our error maps. For pixels that are
detected at lower S/N (5<S/N<10) we adopt an even
more conservative 30% uncertainty, to also account for
possible issues in baseline determination. We ignore all
pixels that have a S/N <5 in the analysis that follows.
We present our line intensity measurements towards 10
positions in NGC 253 (Fig. 4, coordinates in Tab. 1) in
Tab. 1. Toward the center of the galaxy (in particu-
lar region 6, Fig. 4) line emission is observed against
strong continuum (L14). Some resulting absorption will
decrease the integrated line signal at these locations. Be-
cause of this the fluxes toward this location should be
considered highly uncertain.
Spatial filtering: As ALMA is an interferometer it acts
as a spatial filter, sampling only a range of spatial scales.
So the observations will potentially resolve out some flux.
In the compact (extended) configuration spatial scales of
12 – 47 k (23 – 100 k ) [90th percentile] were sampled,
corresponding to 4.400
– 1800
(200
– 900
). Hence the observa-
tions should adequately sample fluxes uniform over ⇠1000
(in one channel). The one exception to this is 12
CO(1–0),
which has been zero-spacing corrected and therefore de-
tects all flux (see discussion in B13). It is not possible to
estimate the percentage of detected flux for every line in
the survey because suitable single-dish observations are
often not available. We do, however, determine this frac-
tion for a number of transitions where possible. For the
following transitions we calculate detected flux percent-
ages over single-dish beam of ⇠22 00
– ⇠2800
of: HCN(1–
0) — 100 % (Paglione et al 1995), HCO+
(1–0) — 55 %
(Martin et al. 2009), C17
O(1–0) — 60 % (Henkel et al.
2014), SiO(2–1) — 110 % (Martin et al. 2009), CN(1–0;3
2
– 1
2 ) — 60 % (Henkel et al. 2014), C2H(1–0;3
2 – 1
2 ) — 60
% (Nakajima et al. 2011) and HNCO(404–303) — 50 %
(Nguyen-Q-Rieu et al. 1991) [though this value is highly
uncertain because HNCO does not peak where Nguyen-
Q-Rieu et al. pointed]. Therefore, it appears that the
data consistently detect at least 50 % of their respective
single dish fluxes. Furthermore our discussion focuses on
the compact clumps of emission, where much higher frac-
tions of the flux are detected (&90 %). (In fact, spatial
filtering of the interferometer actually a↵ords advantages
because it allows the separation of these compact struc-
tures from any extended di↵use medium that can domi-](https://image.slidesharecdn.com/almamultilineimagingofthenearbystarburstngc253-150218131941-conversion-gate02/85/Alma-multi-line_imaging_of_the_nearby_starburst_ngc_253-2-320.jpg)
![ALMA Multi–line Imaging of the Nearby Starburst Galaxy NGC 253 9
Dec.Offset(")
CO
115.27 GHz
total molecular gas
−30
−20
−10
0
10
20
30
100
200
300
400
500
C17
O
112.36 GHz
!<1 molecular gas
0
0.5
1
1.5
C
2
H
87.32 GHz
PDR
0
1
2
3
4
5
6
7
1
2
3
4
5
6
7
8
910
R.A. Offset (")
Dec.Offset(")
H40"
99.02 GHz
RRL
−30−20−100102030
−30
−20
−10
0
10
20
30
0
0.2
0.4
0.6
0.8
1
1.2
1.4
1.6
R.A. Offset (")
HCN
88.63 GHz
dense gas
−30−20−100102030
0
2
4
6
8
10
12
14
R.A. Offset (")
HNCO
87.93 GHz
weak shocks
−30−20−100102030
0
0.5
1
1.5
2
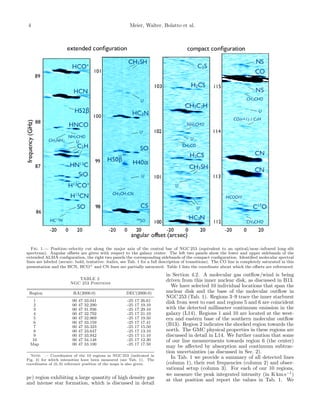
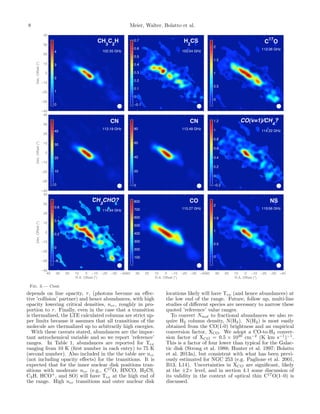
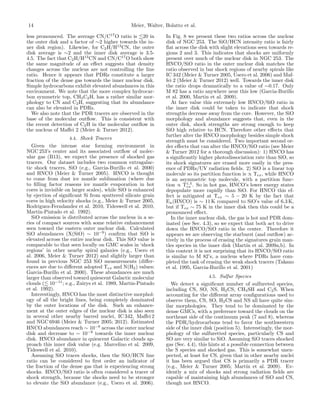
Fig. 4.— Collection of key molecular gas tracers in NGC 253. From top left to bottom right: CO(1–0) (main molecular gas tracer),
C17O(1–0) (optically thin tracer of the molecular gas), C2H (PDR tracer), H40↵ (radio recombination line), HCN (high density gas tracer),
HNCO (shock tracer). The crosses and labels (bottom left panel) mark the di↵erent regions defined in the galaxy. Logarithmic contours
start at 1 K km s 1 and increase/decrease (white/grey) by a factor of 3 from one contour to the next. The beam size is indicated in the
bottom left corner of each panel.
4. DISCUSSION
In the following we present a broad discussion of the
chemistry in the nuclear region of NGC 253. The primary
goal is to obtain spatially resolved views of the di↵erent
molecular environments in and around the starburst cen-
ter.
We begin our discussion by studying the main tracer of
the molecular gas, 12
CO, its isotopologues, and implied
molecular gas opacity in Sec. 4.1. In Sec. 4.2 we con-
tinue with a similar discussion of the isotopologues of the
main tracers of the dense molecular gas phase (H13
CN,
H13
CO+
, HN13
C). This is followed by a discussion of
tracers of PDRs, (Sec. 4.3), shock tracers (HNCO and
SiO; Sec. 4.4), Sulfur species (Sec. 4.5), hydrogen recom-
bination lines (Sec. 4.6), and other tentatively identified
species (Sec. 4.7) detected in our study. A schematic
picture summarizes the overall chemistry of the central
region of NGC 253 in the conclusions/summary section
(Sec. 5).
4.1. CO Isotopologues and Gas Opacity
Our data cover a number of isotopologues (i.e.
molecules where one atom is replaced with an isotope).
Given the fact that atomic isotopes are much less abun-
dant than the main atom, many of these isotopologue
lines have low optical depth compared to the main
species. Isotopologue ratios thus provide insights into the
optical depth of the main lines and can also be used to
constrain isotopic abundance ratios. The isotopic abun-
dance ratio ultimately can provide insights into stellar
nucleosynthesis and possible variations of the stellar ini-
tial mass function (IMF). In the discussion that follows
we do not interpret the sometimes anomalous line ratios
found for region 6 (i.e. the region that is coincident with
the central continuum emission) as it is likely that in
some cases our measurements are a↵ected by absorption
(Sec. 2).
A comparison of the brightness of the C17
O(1–0) tran-
sition to the 12
CO(1–0) transition [hereafter CO(1–0)]
can provide important constraints on the total H2 col-
umn. Being an optically thin version of CO, even in
this extreme star formation environment, it permits CO
abundances to be determined by ‘counting molecules’ if
the [CO/C17
O] abundance ratio is known.
The [CO/C17
O] abundance ratio is constrained based
on existing measurements and nucleosynthetic expecta-
tions. In the Galaxy, [CO/C17
O] is .1900 at the solar
radius and drops to ⇠900 in the Galactic center (e.g.,
Wilson & Rood 1994, Ladd 2004, Wouterloot et al. 2008).
This decrease in the [CO/C17
O] abundance is consistent
with 17
O being a secondary chemical evolution product
formed from reactions between primary 16
O and a pro-](https://image.slidesharecdn.com/almamultilineimagingofthenearbystarburstngc253-150218131941-conversion-gate02/85/Alma-multi-line_imaging_of_the_nearby_starburst_ngc_253-9-320.jpg)
![10 Meier, Walter, Bolatto et al.
ton in intermediate mass stars. Therefore, in a strongly
processed location like the center of a starburst, a low
value of the CO/C17
O abundance ratio is expected, so
we adopt [CO/C17
O] = 1000, which is approximately the
Galactic center value referenced above, as our nominal
value.
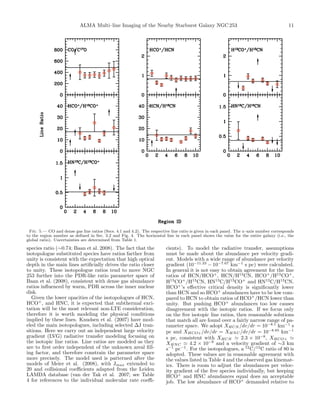
As shown in Fig. 5, this isotopologue line ratio is fairly
constant with position in NGC 253 and large (&350). For
a ratio 16
O/17
O of 1000 in NGC 253, the measured ratio
nominally implies a 12
CO opacity of ⇠2.5, a moderate
value for the main CO line. Raising the intrinsic 16
O/17
O
abundance to 2000 gives a 12
CO opacity of order ⇠5.5.
Various non-LTE e↵ects can occur in a starburst en-
vironment that could alter the observed CO/C17
O line
ratio. Examples that artificially inflate the CO/C17
O
line ratio include: 1) CO has a higher excitation tem-
perature than C17
O because CO has high opacity and
its emission is dominated by warmer, externally heated
edges of the GMCs while C17
O is dominated by the
cooler interiors. 2) Isotope–selective photo-dissociation
makes the cloud sizes smaller in C17
O than CO. Or,
3) due to the absence of radiative trapping in C17
O,
C17
O is subthermal relative to CO and therefore fainter
(e.g., Meier & Turner 2001). The first two would be
expected to be pronounced close to the nuclear star for-
mation. However, interestingly, no evidence is seen for
an increase in the CO/C17
O ratio towards the inner disk,
where PDRs are enhanced (Sec. 4.3) and warm gas dom-
inates. But if there is a decrease in density away from
the inner disk then the third option can operate in the
outer disk, partially compensating for the first two. For
CO/13
CO abundances [CO/13
CO] & 60 (Martin et al.
2010), CO opacities estimated from the CO/C13
O line
ratios are ⇠5 (e.g., Paglione et al. 2004, Sakamoto et al.
2011). This scenario is consistent with CO/C17
O data
(and CO/C18
O) if non-LTE e↵ects are at most a factor of
⇠2. We conclude that, despite the large column density
towards NGC 253’s nucleus, CO(1–0) is only modestly
opaque. It is likely that this low optical depth is due to
increased line widths due to turbulence, the molecular
outflow, non-circular motions and/or elevated gas tem-
peratures that reduce the CO opacity per unit velocity.
The moderate CO optical depth is also reflected in the
implied sub-Galactic CO-to-H2 conversion factor in star-
bursts like NGC 253 (Harrison et al. 1999, Downes &
Solomon 1998, Meier & Turner 2001; Bolatto, Leroy &
Wolfire 2013). A comparison of the LTE C17
O column to
the H2 column estimated by an XCO of 0.5 ⇥ 1020
cm 2
(K km s 1
) 1
, gives a value for [C17
O/H2] constant (to
within 20 %) of 1.9 ⇥ 10 7
across positions 3-10 (using
Eq. 1 and Tex=75 K, Sec. 3.4). If [CO/C17
O] = 1000
and [CO/H2] = 10 4
, then we would expect a value of
[C17
O/H2] ' 10 7
. The level of agreement between the
two methods of constraining N(H2) is reasonable, being
less than the uncertainties in each method. The small
di↵erences are an indicator of the uncertainty in N(H2).
Agreement could be made exact by raising [C17
O/H2]
and/or by lowering the adopted Tex.
4.2. Dense Gas Tracers and their Isotopologues
The commonly observed dense gas line ratios,
HCO+
/HCN, HNC/HCN and HCO+
/HNC ratios are
predicted to be sensitive to gas density, cosmic ray ion-
ization and possibly the X-ray versus UV ionization rate
or the present of mechanical heating (e.g., Kohno et
al. 2001, Meijerink & Spaans 2005, Gracia-Carpio et al.
2006, Knudsen et al. 2007, Papadopolous 2007, Krips et
al. 2008, Baan et al. 2008, Loenen et al. 2008, Meijerink
et al. 2011, Kazandjian et al. 2012). HCO+
(1–0) ef-
fective critical densities are nearly a factor of five lower
than HCN, so to first order, elevated HCO+
/HCN and
HCO+
/HNC ratios are expected in moderate density gas
(nH2 ⇠ 104.5
cm 3
). As densities increase, both transi-
tions thermalize and the ratio tends to unity. Moreover,
HNC/HCN ratios are expected to drop in energetic en-
vironments because HNC is preferential destroyed in hot
gas (e.g., Schilke et al. 1992, Meier & Turner 2005). If
these transitions have high optical depths, which is prob-
able given the large columns of dense gas, all ratios are
driven toward unity. As a result of the large inferred
optical depths, changes in these main isotopic line ra-
tios due to interesting physical/chemical changes will be
partially hidden.
Here we focus on the dense gas properties in the cen-
tral starburst region of NGC 253. The HCO+
/HCN
intensity ratio (Fig. 5) is observed to be slightly less
than unity and exhibits very little change over the in-
ner disk (except for position 2 and 3). This sug-
gests that both HCN(1–0) and HCO+
(1–0) are optically
thick and slightly subthermal across much of the nucleus
(Knudsen et al. 2007). Here we add new HCN/H13
CN,
HCO+
/H13
CO+
, H13
CO+
/H13
CN, and HN13
C/H13
CN
intensity ratios to further constrain dense gas properties.
The isotopologues of HCN, HCO+
, and HNC have lower
optical depths and allow estimates of the line opacity and
changes in the abundance ratio of these species.
The observed HCN/H13
CN and HCO+
/H13
CO+
both
have values of 10 - 15 over much of the inner nuclear disk
(Fig. 5). The fact that these ratios are much lower than
the expected [12
C/13
C] ratio of &60 (Mart´ın et al. 2010)
clearly demonstrates that both HCN(1–0) and HCO+
(1–
0) have opacities greater than one. This confirms the
conclusions of earlier work (Knudsen et al. 2007). For
A =12
C/13
C abundance ratios of 80 above and LTE as-
sumptions, both HCN and HCO+
have ⌧ ' 5 8. Inter-
estingly this is an optical depth similar or slightly larger
than inferred for CO(1–0) from C17
O. This is expected
because the HCN/H13
CN and HCO+
/H13
CO+
ratios are
quite similar to the observed CO/13
CO line ratios (e.g.,
Paglione et al. 2004; Sakamoto et al. 2011). Such optical
depths for HCN and HCO+
are large. For a Tex=75 K,
inferred optically thin HCN abundances are ⇠ 2.5⇥10 8
(Table 4). However, if the isotopologues of HCN, HCO+
and HNC have a lower excitation temperature than the
main species (likely true, see below), then LTE inferred
opacities are lower limits.
The H13
CO+
/H13
CN ratio in particular shows larger
variation (Fig. 5) than seen in the main isotopic ratios.
Moreover the average values of the ratios are di↵erent.
Toward the two main inner disk GMCs (positions 5 and
7) HCO+
/HCN and H13
CO+
/H13
CN have very similar
ratios, but toward the outer nuclear disk the isotopic
dense gas ratios decrease relative to their main versions.
Likewise the average HN13
C/H13
CN ratio of ⇠0.35 is
significantly lower than the single-dish value for the main](https://image.slidesharecdn.com/almamultilineimagingofthenearbystarburstngc253-150218131941-conversion-gate02/85/Alma-multi-line_imaging_of_the_nearby_starburst_ngc_253-10-320.jpg)
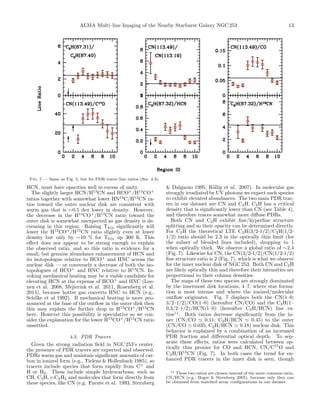
![12 Meier, Walter, Bolatto et al.
HCO /HCN+
n(H_2)
T_KIN
20 40 60 80 100 120 140 160 180 200
6.5
6.0
5.5
5.0
4.5
4.0
3.5
HCN/H CN13
n(H_2)
T_KIN
20 40 60 80 100 120 140 160 180 200
6.5
6.0
5.5
5.0
4.5
4.0
3.5
HCO / H CO+ 13 +
n(H_2)
T_KIN
20 40 60 80 100 120 140 160 180 200
6.5
6.0
5.5
5.0
4.5
4.0
3.5
H CO /H CN13 + 13
n(H_2)
T_KIN
20 40 60 80 100 120 140 160 180 200
6.5
6.0
5.5
5.0
4.5
4.0
3.5
HN C/H CO13 13 +
n(H_2)
T_KIN
20 40 60 80 100 120 140 160 180 200
6.5
6.0
5.5
5.0
4.5
4.0
3.5
HN C/H CN13 13
n(H_2)
T_KIN
20 40 60 80 100 120 140 160 180 200
6.5
6.0
5.5
5.0
4.5
4.0
3.5
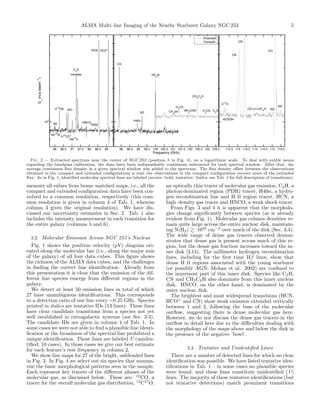
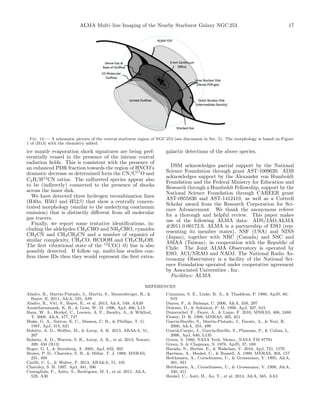
Fig. 6.— LVG modeling of the inner nuclear disk. The acceptable model predicted parameter space for (clockwise) HCN/HCO+
HCN/H13CN, HCO+/H13CO+, H13CO+/H13CN, HN13C/H13CO+, and HN13C/H13CN1–0 transitions. Contours are the ±1 observed
line ratio for the average of position 5 and 7. Tick marks indicate the direction of the favored parameter space if it is not obvious. Adopted
abundance per velocity gradient values from the six di↵erent species are discussed in section 4.2. The cross marks an example set of
parameters (Tkin = 80 K, nH2
= 104.75 cm 3) that is within 1 of with all five isotopic ratios. The HCN/HCO+ line ratio is not matched,
but is within 30 % of the predicted ratio.
HCN is a direct consequence of its lower e↵ective critical
density.
Figure 6 displays the acceptable parameter space for
the ratios observed toward the inner nuclear disk (av-
erage of the ratios toward positions 5 and 7) displayed
in Figure 5. When admitting uncertainties, good agree-
ment to all five ratios is obtained for nH2 = 104.5 5.0
cm 3
and Tkin = 60 120 K. The cross in Figure 6
marks the location of a representative good fit to all
lines. Its values are nH2
= 104.75
cm 3
and Tkin = 80
K. Tkin below 60 K challenges the observed ratios for
H13
CO+
/H13
CN and HN13
C/H13
CN , and Tkin > 120 K
begins to disagree with HCO+
/H13
CO+
. Strictly speak-
ing the HCO+
/HCN ratio is not matched, however the
disagreement is small (⇠30 %), and at the level that we
expect other complications such as line width variation
and transition depend filling factors to become impor-
tant. The degree of internal consistency obtained in these
simple uniform physical condition models is encouraging.
The favored densities and kinetic temperatures of the
dense gas isotopologues match well those previously
found in Knudsen et al. (2007), with a range overlap-
ping but favoring about 0.25 dex lower densities. These
results confirm Knudsen et al. (2007)’s conclusions that
HCN, HNC and (to a somewhat lesser degree) HCO+
are moderately subthermally excited. The dense gas iso-
topologues are even more strongly subthermal. For the
above favored model, we obtain Tex = 34 K and 44 K
for HCN and HCO+
, respectively. Corresponding opac-
ities ⌧ are 13 and 2.4 for HCN and HCO+
. For the
isotopologues, Tex [⌧] are 7.2 K [2.4], 16 K [0.27] and 5.3
K [0.71] for H13
CN, H13
CO+
and HN13
C, respectively.
LVG modeling demonstrates that while the main tran-
sition line opacities crudely match those predicted from
LTE, the isotopologue opacities are significantly larger
than 12
⌧/A. This stems from the fact that the e↵ective
critical density of a transition is dependent on its opac-
ity (radiative trapping), so the isotopologues are more
strongly subthermal. As a result, the level populations
of the isotopologues settle into the lowest J transitions
more e ciently, raising their opacity. This explains the
well known e↵ect that isotopic line ratios are gas den-
sity probes (e.g., Meier et al. 2001). Furthermore this
is strong evidence that the main species, particularly of](https://image.slidesharecdn.com/almamultilineimagingofthenearbystarburstngc253-150218131941-conversion-gate02/85/Alma-multi-line_imaging_of_the_nearby_starburst_ngc_253-12-320.jpg)
![16 Meier, Walter, Bolatto et al.
of para transitions at 103 GHz. The ortho-to-para ra-
tio of H2CS, the sulfur analog to formaldehyde H2CO, is
useful for constraining the formation conditions of H2CS
(Minh et al. 1991). Under optically thin, high-T (>15 K
in the case of H2CS), LTE case, the ratio of the ortho
species of H2CS (those with Ka [K 1] even, see Tab. 1)
to the para (those with Ka odd) should be 3.0. If the
temperature at the time of formation is 15 K then the
two forms of H2CS with not be thermalized to their sta-
tistical weights and hence have an abundance ratio less
than 3 — approaching unity at T=0 K. The intensity
ratio of the two types of transitions (Fig. 9) is approxi-
mately constant across the disc at a value of ⇠1.4. For
Tex = 75 K the measured ratio implies an ortho-to-para
ratio of 2.9. Therefore every position is consistent with
standard LTE, high temperature limit. Thus, at least
in the case of H2CS, this suggests that H2CS formed in
the high temperature gas phase after evaporation, or if
it was formed on the grain surfaces in an earlier epoch,
those surfaces were still significantly warmer than 15 K.
4.6. Millimeter Recombination Lines
We have detected three hydrogen recombination lines
in our observations (H40↵, H50 and H52 ). The mor-
phology of these recombination lines is very di↵erent
from all the molecular gas tracers (e.g., Figs. 1 and 3):
The emission is centrally concentrated, coincident with
the location of the underlying continuum emission (L14).
H radio recombination lines are reported outside the
Local Group for the first time here. The error bars are
significant for the lines, but the global H40↵/H50 ra-
tio is around 3.5, in good agreement with the LTE value
of 3.5 (=1/0.285) for ne = 104
cm 3
and Te = 104
K.
The lines would be fainter than the line by a factor of
2.3. Indeed, we do not clearly detect any lines. We also
do not detect any He↵ lines. Other radio/mm recombi-
nation lines mapped in NGC 253 have been discussed ex-
tensively elsewhere (e.g., Anantharamaiah & Goss 1996,
Mohan et al. 2002, 2005, Rodriguez-Rico et al. 2006,
Kepley et al. 2011). The morphology of both the ↵ and
lines mapped here are in excellent agreement with the
ones reported previously.
4.7. Tentatively Identified Species
We here briefly comment on other selected species de-
tected in our observations.
A large number of tentatively identified lines can
be attributed to carbon-rich complex species (e.g.,
CH3CH2CN, CH3CH2OH, CH2CN, CH2CO, CH3CHO
and NH2CHO (Tab. 1). These species represent the
next step in complexity beyond the molecules detected
in external galaxies up until now, and suggest that these
molecules may be fairly extended in NGC 253.
One unidentified feature detected is of particular inter-
est. This is the feature U-114.22 at ⇠114.218 GHz. This
spectral feature is within <4 MHz (<11 km s 1
) of both
C4H(N=12–11; J=23/2–21/2; F=12–11) and the v = 1
transition of CO(1–0). The upper energy state of the
CO(1–0; v = 1) line is 3089 K above ground, so the exci-
tation temperature of the gas must be >450 K in order to
explain the observed line ratio. The morphology of this
transition is very similar to the RRLs (accounting for
resolution di↵erences), as would be expected if it is trac-
ing molecular gas not associated with the cold molecular
phase. The C4H transition has a much lower upper en-
ergy level of 35.6 K, typical of the other transitions seen
here. Moreover, it is plausible to expect that the C4H
might trace PDR emission (like C2H), which are also con-
centrated towards the inner disk, though why it would be
significantly more compact than C2H is unexplained. We
consider C4H as the most likely identification, however
the observed morphology indicates that the possibility
this feature could be vibrationally excited CO deserves
further investigation.
5. SUMMARY AND CONCLUSIONS
We present the detection of a total of 50 molecular lines
in the nearby starburst galaxy NGC 253, based on early
science (cycle 0) observations taken with the Atacama
Large (Sub–)Millimeter Array (ALMA). For 27 lines we
have an unambiguous identification, and 13 lines have
tentative IDs (no plausible line identification was possible
in 10 cases).
We here describe a schematic picture of the central
starburst region of NGC 253 mapped by ALMA (Fig. 10):
As described in Sec. 3.1, the nucleus of NGC 253 is char-
acterized by the inner portion of NGC 253’s large–scale
bar. The outer part of the nuclear disk (the ‘outer nu-
clear disk’), likely represents the location where the gas
is flowing radially inward along the large-scale bar. In-
side this is a compact region exhibiting a large quantity of
high density gas and intense star formation, as evidenced
by the presence of dense gas (Sec. 4.2), PDR (Sec. 4.3)
and shock tracers (Sec. 4.4). This component (the ‘in-
ner nuclear disk’), dominates the morphology of most of
the spectral lines detected by the observations. We de-
tect high density molecular gas tracers (HCN, HCO+
and
CN) at the base of the molecular outflow first detected
in the 12
CO emission (B13).
In detail, we find moderate 12
CO opacities of ⇠2–5,
despite the large column density towards NGC 253’s nu-
cleus. This may be due to increased line–widths due
to turbulence, non–circular motions and/or elevated gas
temperatures that reduce the CO opacity per unit veloc-
ity. Comparing HCN(1–0) and HCO+
(1–0) with their
13
C–substituted isotopologues yields that the HCN(1–
0) and HCO+
(1–0) are also optically thick, with similar
(moderate) opacities to CO. These high HCN and HCO+
opacities imply that the main isotopologue HCN/HCO+
(and HCN/HNC) line ratios have less diagnostic power in
this starburst environment. Using the isotopically sub-
stituted versions of these high density tracers we measure
much more robust values for the popular ”HCO+
/HCN”,
”HNC/HCN” and ”HNC/HCO+
” ratios. All five of the
isotopic dense gas tracer ratios can be well fit by LVG
models with nH2
= 104.75
cm 3
, Tkin = 80 K and
X(HCN) ⇠ 5X(HCO+
) ⇠ 5X(HNC).
The weak shock tracer/ice mantle species HNCO has
the most distinctive morphology of all the bright lines be-
ing completely dominated by the outer locations of the
disk. This is at odds with what is seen in the strong
shock tracer, SiO. Attributing the dramatic variation in
the HNCO and SiO maps across the nucleus to chang-
ing shock strength is unsatisfactory because SiO is en-
hanced across the nucleus at a level that should imply
shocks are strong throughout the inner disk. A possible
explanation for the faintness of HNCO is that because
of its higher photodissociation rate relative to SiO, the](https://image.slidesharecdn.com/almamultilineimagingofthenearbystarburstngc253-150218131941-conversion-gate02/85/Alma-multi-line_imaging_of_the_nearby_starburst_ngc_253-16-320.jpg)
![18 Meier, Walter, Bolatto et al.
Houghton, S., Whiteoak, J. B., Koribalski, B., et al. 1997, A&A,
325, 923
Hunter, S. D., Bertsch, D. L., Catelli, J. R., et al. 1997, ApJ, 481,
205
Izumi, T., Kohno, K., Mart´ın, S., et al. 2013, PASJ, 65, 100
Kazandjian, M. V., Meijerink, R., Pelupessy, I., Israel, F. P., &
Spaans, M. 2012, A&A, 542, AA65
Kennicutt, R. C., & Evans, N. J. 2012, ARA&A, 50, 531
Kepley, A. A., Chomiuk, L., Johnson, K. E., et al. 2011, ApJ,
739, L24
bibitem[Kohno et al.(2001)]2001ASPC..249..672K Kohno, K.,
Matsushita, S., Vila-Vilar´o, B., et al. 2001, The Central
Kiloparsec of Starbursts and AGN: The La Palma Connection,
249, 672
Knudsen, K. K., Walter, F., Weiss, A., et al. 2007, ApJ, 666, 156
Krips, M., Neri, R., Garc´ıa-Burillo, S., et al. 2008, ApJ, 677, 262
Ladd, E. F. 2004, ApJ, 610, 320
Leroy, A. K., Walter, F., Sandstrom, K., et al. 2013, AJ, 146, 19
Leroy, A. K., Bolatto, A., et al. (2014), ApJ, in press,
astro-ph/1411.2836] (L14)
Lique, F., Spielfiedel, A., & Cernicharo, J. 2006, A&A, 451, 1125
Lique, F., Spielfiedel, A., Dhont, G., & Feautrier, N. 2006, A&A,
458, 331
Lique, F., Spielfiedel, A., Feautrier, N., et al. 2010,
J. Chem. Phys., 132, 024303
Loenen, A. F., Spaans, M., Baan, W. A., & Meijerink, R. 2008,
A&A, 488, L5
Marcelino, N., Cernicharo, J., Tercero, B., & Roue↵, E. 2009,
ApJ, 690, L27
Mart´ın, S., Kohno, K., Izumi, T., et al. 2014, arXiv:1410.2823
Mart´ın, S., Mauersberger, R., Mart´ın-Pintado, J., Garc´ıa-Burillo,
S., & Henkel, C. 2003, A&A, 411, L465
Mart´ın, S., Mart´ın-Pintado, J., Mauersberger, R., Henkel, C., &
Garc´ıa-Burillo, S. 2005, ApJ, 620, 210
Mart´ın, S., Mauersberger, R., Mart´ın-Pintado, J., Henkel, C., &
Garc´ıa-Burillo, S. 2006, ApJS, 164, 450
Mart´ın, S., Mart´ın-Pintado, J., & Mauersberger, R. 2009, ApJ,
694, 610
Mart´ın, S., Mart´ın-Pintado, J., & Viti, S. 2009, ApJ, 706, 1323
Mart´ın, S., Aladro, R., Mart´ın-Pintado, J., & Mauersberger, R.
2010, A&A, 522, A62
Martin-Pintado, J., Bachiller, R., & Fuente, A. 1992, A&A, 254,
315
McElroy, D., Walsh, C., Markwick, A. J., et al. 2013, A&A, 550,
A36
McGonagle, D., & Irvine, W. M. 1997, ApJ, 477, 711
Meier, D. S., & Turner, J. L. 2012, ApJ, 755, 104
Meier, D. S., & Turner, J. L. 2005, ApJ, 618, 259
Meier, D. S., & Turner, J. L. 2004, AJ, 127, 2069
Meier, D. S., & Turner, J. L. 2001, ApJ, 551, 687
Meier, D. S., Turner, J. L., & Beck, S. C. 2014, ApJ, 795, 107
Meier, D. S., Turner, J. L., & Hurt, R. L. 2008, ApJ, 675, 281
Meijerink, R., & Spaans, M. 2005, A&A, 436, 397
Meijerink, R., Spaans, M., Loenen, A. F., & van der Werf, P. P.
2011, A&A, 525, AA119
Minh, Y. C., Irvine, W. M., & Brewer, M. K. 1991, A&A, 244, 181
Mohan, N. R., Anantharamaiah, K. R., & Goss, W. M. 2002,
ApJ, 574, 701
Mohan, N. R., Goss, W. M., & Anantharamaiah, K. R. 2005,
A&A, 432, 1
Nakajima, T., Takano, S., Kohno, K., & Inoue, H. 2011, ApJ,
728, LL38
Nguyen-Q-Rieu, Henkel, C., Jackson, J. M., & Mauersberger, R.
1991, A&A, 241, L33
Nilsson, A., Hjalmarson, ˚A., Bergman, P., & Millar, T. J. 2000,
A&A, 358, 257
Ott, J., Weiss, A., Henkel, C., & Walter, F. 2005, ApJ, 629, 767
Paglione, T. A. D., Tosaki, T., & Jackson, J. M. 1995, ApJ, 454,
L117
Paglione, T. A. D., Yam, O., Tosaki, T., & Jackson, J. M. 2004,
ApJ, 611, 835
Papadopoulos, P. P. 2007, ApJ, 656, 792
Rekola, R., Richer, M. G., McCall, M. L., et al. 2005, MNRAS,
361, 330
Rodr´ıguez-Fern´andez, N. J., Tafalla, M., Gueth, F., & Bachiller,
R. 2010, A&A, 516, AA98
Rodr´ıguez-Rico, C. A., Goss, W. M., Zhao, J.-H., G´omez, Y., &
Anantharamaiah, K. R. 2006, ApJ, 644, 914
R¨ollig, M., Abel, N. P., Bell, T., et al. 2007, A&A, 467, 187
Rosenberg, M. J. F., Kazandjian, M. V., van der Werf, P. P., et
al. 2014, A&A, 564, AA126
Rydbeck, O. E. H., Hjalmarson, A., Rydbeck, G., et al. 1980,
ApJ, 235, L171
Sakamoto, K., Mao, R.-Q., Matsushita, S., et al. 2011, ApJ, 735,
19
Schilke, P., Walmsley, C. M., Pineau Des Forets, G., et al. 1992,
A&A, 256, 595
Snell, R. L., Narayanan, G., Yun, M. S., et al. 2011, AJ, 141, 38
Spielfiedel, A., Feautrier, N., Najar, F., et al. 2012, MNRAS, 421,
1891
Strong, A. W., Bloemen, J. B. G. M., Dame, T. M., et al. 1988,
A&A, 207, 1
Tideswell, D. M., Fuller, G. A., Millar, T. J., & Markwick, A. J.
2010, A&A, 510, AA85
Tielens, A. G. G. M., & Hollenbach, D. 1985, ApJ, 291, 722
Turner, B. E. 1991, ApJS, 76, 617
Usero, A., Garc´ıa-Burillo, S., Fuente, A., Mart´ın-Pintado, J., &
Rodr´ıguez-Fern´andez, N. J. 2004, A&A, 419, 897
Usero, A., Garc´ıa-Burillo, S., Mart´ın-Pintado, J., Fuente, A., &
Neri, R. 2006, A&A, 448, 457
van der Tak, F. F. S., Black, J. H., Sch¨oier, F. L., Jansen, D. J.,
& van Dishoeck, E. F. 2007, A&A, 468, 627
Viti, S., Caselli, P., Hartquist, T. W., & Williams, D. A. 2001,
A&A, 370, 1017
Wiesenfeld, L., & Faure, A. 2013, MNRAS, 432, 2573
Wilson, T. L., & Rood, R. 1994, ARA&A, 32, 191
Wouterloot, J. G. A., Henkel, C., Brand, J., & Davis, G. R. 2008,
A&A, 487, 237
Yang, B., Stancil, P. C., Balakrishnan, N., & Forrey, R. C. 2010,
ApJ, 718, 1062
Ziurys, L. M., Friberg, P., & Irvine, W. M. 1989, ApJ, 343, 201](https://image.slidesharecdn.com/almamultilineimagingofthenearbystarburstngc253-150218131941-conversion-gate02/85/Alma-multi-line_imaging_of_the_nearby_starburst_ngc_253-18-320.jpg)
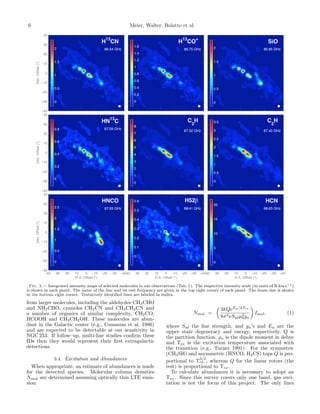
![20Meier,Walter,Bolattoetal.
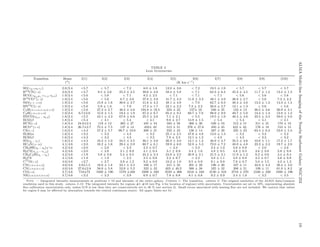
TABLE 4
LTE ’Reference’ Molecular Abundances for NGC 253a
Mol. ncr
b 1 2 3 4 5 6 7 8 9 10
H13CN 6.48 <0.2–<1(-9) 1–8(-10) 0.4–2(-9) 0.4–2(-9) 0.5–3(-9) <0.6–<3(-10) 0.6–3(-9) 0.5–3(-9) 2–9(-10) 0.2–1(-9)
H13CO+ 5.33 <0.1–<8(-10) 0.5–3(-9) 0.8–4(-10) 0.2–1(-9) 0.2–1(-9) 0.6–3(-10) 0.3–2(-9) 2–9(-10) <0.7–<4(-10) 0.7–4(-10)
SiO 5.48 <0.3–<1(-9) 0.3–1(-9) 0.7–3.0(-9) 0.5–2(-9) 0.5–2(-9) <0.8–<3(-10) 0.7–3(-9) 0.6–3(-9) 0.2–1(-9) 0/3–1(-9)
HN13C 5.62 <0.3–<2(-9) 1–6(-10) <1–<7(-10) 0.2–1(-9) 0.8–4(-9) 0.8–4(-10) 0.3–1(-9) 0.2–9(-10) <0.9–<5(-10) <<1–5(-10)
C2H 5.27 <0.4—<2(-8) 1–5(-8) 2–8(-8) 0.4–2(-7) 0.4–2(-7) 0.3–2(-7) 0.5–3(-7) 0.3-2(-7) 1–6(-8) 1–5(-8)
HNCO 5.20 <0.1–<1(-8) 0.4–3(-8) 0.6–5(-8) 0.1–1(-8) 0.3–3(-9) <0.3–<2(-9) 1–9(-9) 0.3–2(-8) 0.3–2(-8) 0.5–4(-8)
HCN 6.42 1–5(-9) 0.2–1(-8) 0.4–2(-8) 0.4–2(-8) 0.5–3(-8) 0.3–2(-8) 0.5–3(-8) 0.6–3(-8) 0.3–2(-8) 0.3–2(-8)
HCO+ 5.37 0.7–4(-9) 0.7–4(-9) 1–7(-9) 0.2–1(-8) 0.3–1(-8) 1–7(-9) 0.3–1(-8) 0.4–2(-8) 0.2–8(-9) 1–7(-9)
CS 5.78 <0.5–<2(-9) 2–9(-9) 0.4–2(-8) 0.5–2(-8) 0.5–2(-8) 0.3–1(-8) 0.7–3(-8) 0.6–3(-8) 0.3–1(-8) 2–9(-9)
SO 5.47 <2–<7(-9) 2–6(-9) 0.4—2(-8) 0.3–1(-8) 0.3–1(-8) 1–4(-9) 0.5–2(-8) 0.4–2(-8) 2–6(-9) 0.3–1(-8)
HC3N 5.71 <1–<0.7(-10) 3–2(-10) 6–4(-10) 7–5(-10) 7–4(-10) 6–4(-10) 9–5(-9) 7–4(-10) 4–3(-10) 4–2(-10)
CH3SH · · · <1–<7(-9) <0.4–<3(-9) <0.5–<3(-9) 0.3–2(-9) <0.2–<2(-9) <0.3–<2(-9) 0.4–3(-9) 0.4–3(-9) <0.3–<2(-9) <0.4–<3(-9)
H2CS 5.25 <2–<6(-9) <0.8–<2(-9) <0.9–<3(-9) 0.6–2(-9) 0.5–1(-9) 0.5–1(-9) 0.9–3(-9) 0.8–2(-9) 0.8–2(-9) 1–3(-9)
CN 6.24 0.4–2(-8) 0.4–2(-8) 0.4–2(-8) 1–6(-8) 1–6(-8) 2–7(-8) 1–7(-8) 1–5(-8) 0.6–3(-8) 0.5–2(-8)
NS · · · <0.3–<1(-8) <1–<4(-9) <1–<4(-9) 1–5(-9) 1–5(-9) 2–5(-9) 2–6(-9) 0.8–3(-9) <1–<3(-9) <1–<4(-9)
C17O 3.28 <0.6–<3(-7) <0.2–<1(-7) 0.3–2(-7) 0.4–2(-7) 0.4–2(-7) 0.4–2(-7) 0.4–2(-7) 0.4–2(-7) 0.4–2(-7) 0.3–2(-7)
N(H2) · · · 3.6(22) 9.6(22) 7.8(22) 1.6(23) 1.8(23) 1.7(23) 1.6(23) 1.4(23) 1.1(23) 9.6(22)
a Entries have the form: a(b) = a ⇥ 10b
. Molecular hydrogen column densities are determined from the CO(1–0) intensity assuming a conversion factor of XCO = 0.5 ⇥ 1020
cm 2
(K km s 1
) 1
(Bolatto et al. 2013a). Calculation of the column densities of individual species are calculated assuming LTE excitation. The range quoted for each entry corresponds to 10 - 75 K. Overall
systematic uncertainties, including the adopted excitation temperature (range shown), galactic position (positions 1-3 and 7-10 likely have excitation temperatures at the low end of the range),
and the CO conversion factor (uncertain to a factor of three; Bolatto et al. 2013a), dominate the error budget, so separate error bars are not presented for each position. Upper limits are 5 .
b The critical density (not including radiative trapping e↵ects), log(ncr = Aij /Cij [100K]). Rates are adapted from the Leiden LAMDA database, van der Tak et al. 2007, with Cij ’s:
HCN/H13
N/HN13
C: Dumouchel et al. (2010); HCO+
/H13
CO+
: Flower (1999); SiO: Dayou & Balanca (2006); C2H: Spielfiedel et al. (2012); HNCO: Green (1986); CS: Lique et al. (2006a); SO:
Lique et al. (2006b); HC3N Green & Chapman (1978); H2CS: Wiesenfeld & Faure (2013); CN: Lique et al. (2010); C17
O: Yang et al. (2010).](https://image.slidesharecdn.com/almamultilineimagingofthenearbystarburstngc253-150218131941-conversion-gate02/85/Alma-multi-line_imaging_of_the_nearby_starburst_ngc_253-20-320.jpg)

The document presents detailed imaging of molecular gas species in the starburst galaxy NGC 253 using ALMA, which covers a total of 50 molecular lines across a 13 GHz bandwidth. The study identifies diverse chemical properties of the galaxy, emphasizing line ratios that help constrain the characteristics of dense gas and chemical processes. Additionally, the findings showcase the elevated abundance of certain molecular species and the influence of central radiation fields on chemical signatures in the galaxy's nucleus.


![谷歌留痕技术 [ 𝙩𝙤𝙥 𝟮𝟯𝟯. 𝙘 𝙤𝙢 ]](https://cdn.slidesharecdn.com/ss_thumbnails/top233-260130174328-3833018c-thumbnail.jpg?width=640&height=640&fit=bounds)
