Download to read offline
![S. Ramstedt et al.: The wonderful complexity of the Mira AB system
250
200
150
100
50
0
35 40 45 50 55
Flux [Jy]
vlsr [km s−1]
12CO(3-2)
vl s r [km s−1]
Offset [arcsec]
38 40 42 44 46 48 50 52 54
6
4
2
0
−2
−4
−6
−8
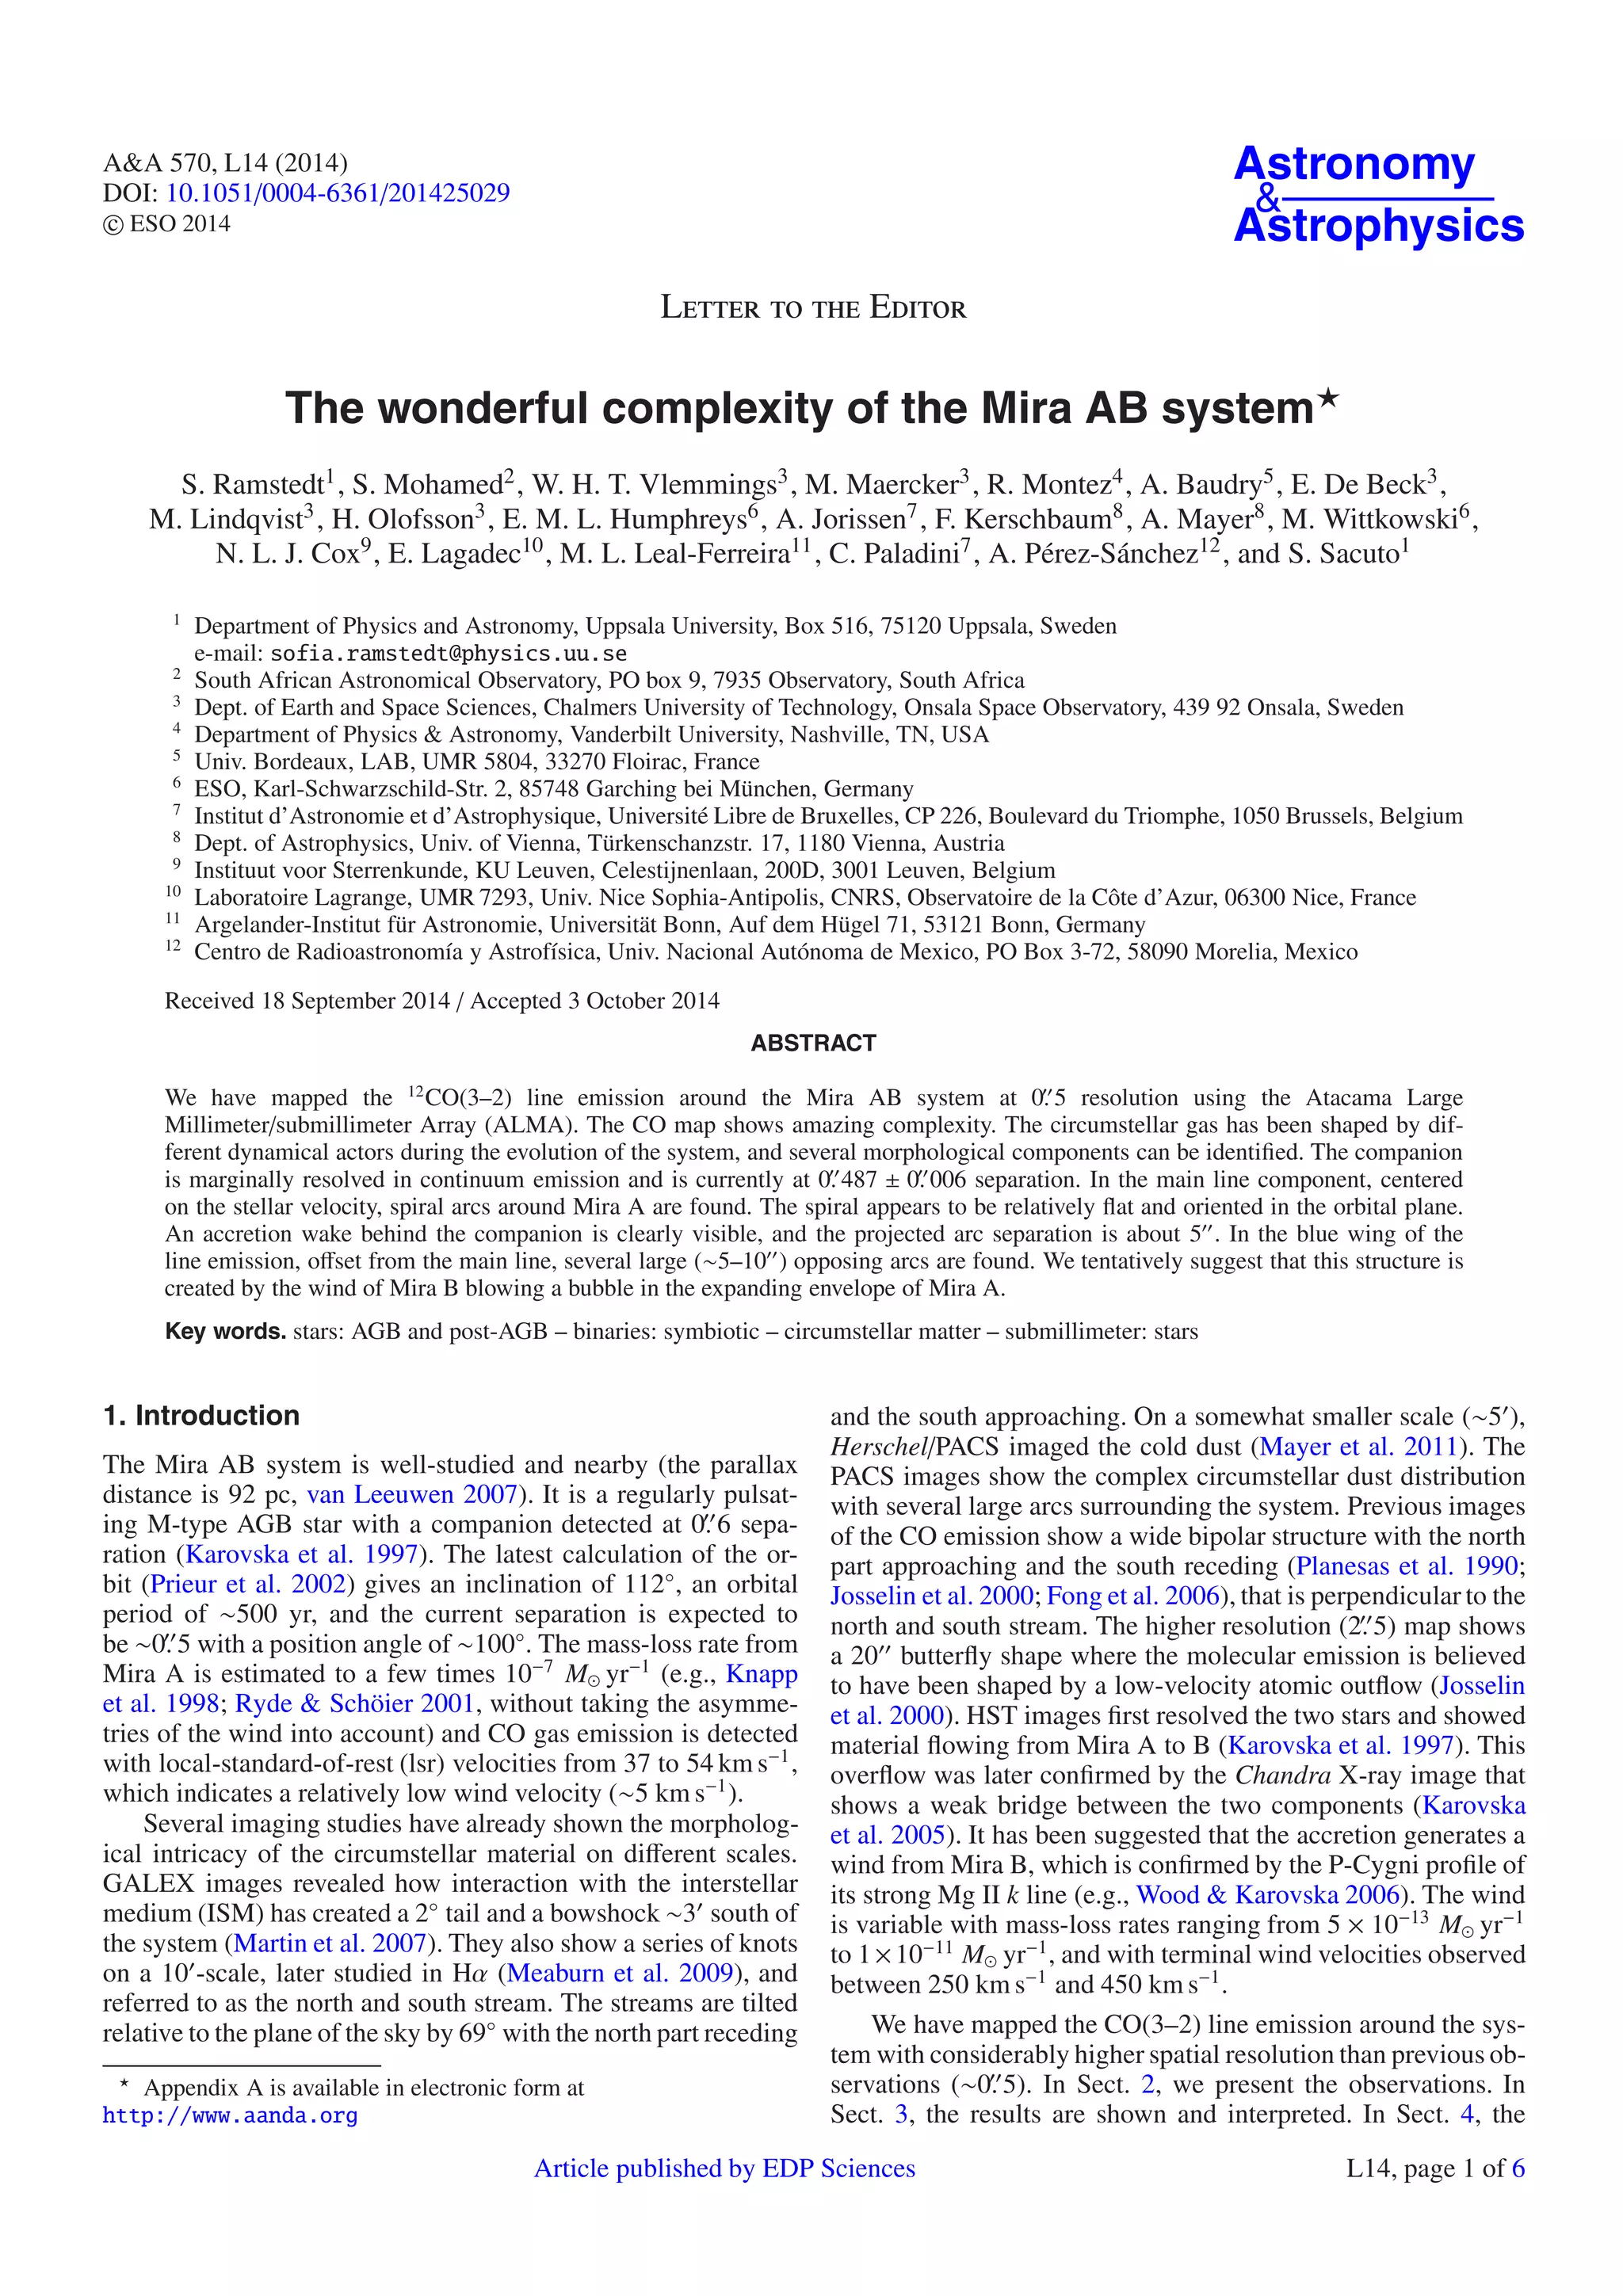
Fig. 1. Left: ALMA CO(3–2) line profile generated using an 25 beam centered on Mira A. Right: position-velocity diagram showing the positional
offset relative to the center of the bubble along a position angle of 38◦, as a function of lsr velocity.
East Offset [arcsec]
Offset [arcsec]
1 0 −1
1
0
−1
Fig. 2. Continuum emission at 338 GHz with the current positions of
Mira A (west) and B (east, marked by crosses). The contours are
drawn at 5, 10, 20, 40, 80, 160, and 320 times the rms noise level
at 0.6 mJy/beam. The beam is shown in the lower left corner.
velocity-integrated information, and detailed structures may not
be apparent (cf. PolCor and ALMA images of the spiral and shell
around R Scl, Maercker et al. 2014). The separation between the
dust arcs is about 15–30, which is significantly larger than in
the inner spiral detected with ALMA.
Finally, the interaction between the circumstellar material
and the ISM is seen in the GALEX images (Martin et al. 2007),
and an extended bow shock is detected ≈5 south of Mira AB.
While the large-scale dust distribution is clearly shaped by this
interaction (Mayer et al. 2011), this is not the case of the smaller-scale
gas distribution mapped by ALMA. The presence of the
bow shock much farther out means that the inner structures can-not
be explained by (hydrodynamic) interaction with the ISM.
4.2. Possible shaping scenarios
The bubble found on the southeastern side of Mira A is ∼800 AU
across, and there is a similar, filled structure on the opposite,
Table 1. Current positions (ep = J2000.0) and continuum flux density
at 338 GHz, S ν, of Mira A and B determined from the ALMA data.
Source RA Dec S ν
Mira A 02:19:20.784 –02:58:42.818 252.3 ± 0.3 mJy
Mira B 02:19:20.816 –02:58:42.887 15.3 ± 0.3 mJy
˙M
northwestern side of the star (Sect. 3.2 and Fig. 3, left). One
possible explanation for these shapes is that the wind from
Mira B is blowing a hole in the circumstellar envelope (CSE)
of Mira A. The time scale for a continuous wind (assuming the
higher Mira B mass-loss rate, 10−11 M− yr1, and wind velocity,
450km s−1, Wood Karovska 2006) to create a bubble of that
size is ∼380 years (assuming ∼ 10−7 Myr−1 from Mira A).
The terminal velocity of the shell surrounding the bubble would
be ≈5 kms−1 (e.g., the wind-wind interaction model for plane-tary
nebulae, Kwok 1983). The bubble is not centered onMira B
because, in the direction of Mira A, the CSE is too dense to be
significantly affected by the wind of Mira B. The wind will pre-dominantly
blow in the north-south direction since it is hindered
by the (almost edge-on) dense accretion disk around Mira B,
which might explain the bi-polar shape of the bubble. This sce-nario
is consistent with the shell radial velocity of 5 kms−1
(Fig. 1, right), and the mirrored shape on the opposite side of
Mira A, which may have been created half a period ago. The
northwestern bubble seems to be almost filled with material from
the wind ofMira A, which agrees with the time scales and an ex-pansion
velocity of 5 kms−1, but the time scale for the creation
of the bubble from these order-of-magnitude estimates (assum-ing
spherically symmetric winds) is slightly longer than the time
Mira B would stay on either side of Mira A if the orbital period
were 500 yr.
The two companions seem to be surrounded by a common
dense molecular envelope, and at red-shifted velocities, there
appears to be an accretion wake behind Mira B. Several arcs
centered on Mira A are found in the line emission from 45.5
to 54.5 kms−1 (Figs. 3, A.1 and A.2). Even though these arcs are
physically connected in a continuous spiral, they will appear as
separate arcs in velocity space, since different sections of the spi-ral
arms will have different velocities along the line of sight. The
relatively low wind velocity of Mira A (∼5 kms−1) will cause
L14, page 3 of 6](https://image.slidesharecdn.com/thewonderfulcomplexityofthemiraabsystem-141124083145-conversion-gate02/75/The-wonderful-complexity_of_the_mira_ab_system-3-2048.jpg)
![AA 570, L14 (2014)
43.0 km/s
East Offset [arcsec]
Offset [arcsec]
10 5 0 −5 −10
5
0
−5
Jy/beam
1.6
1.4
1.2
1
0.8
0.6
0.4
0.2
50.0 km/s
East Offset [arcsec]
Offset [arcsec]
5 0 −5
10
5
0
−5
−10
Jy/beam
1.1
1
0.9
0.8
0.7
0.6
0.5
0.4
0.3
0.2
0.1
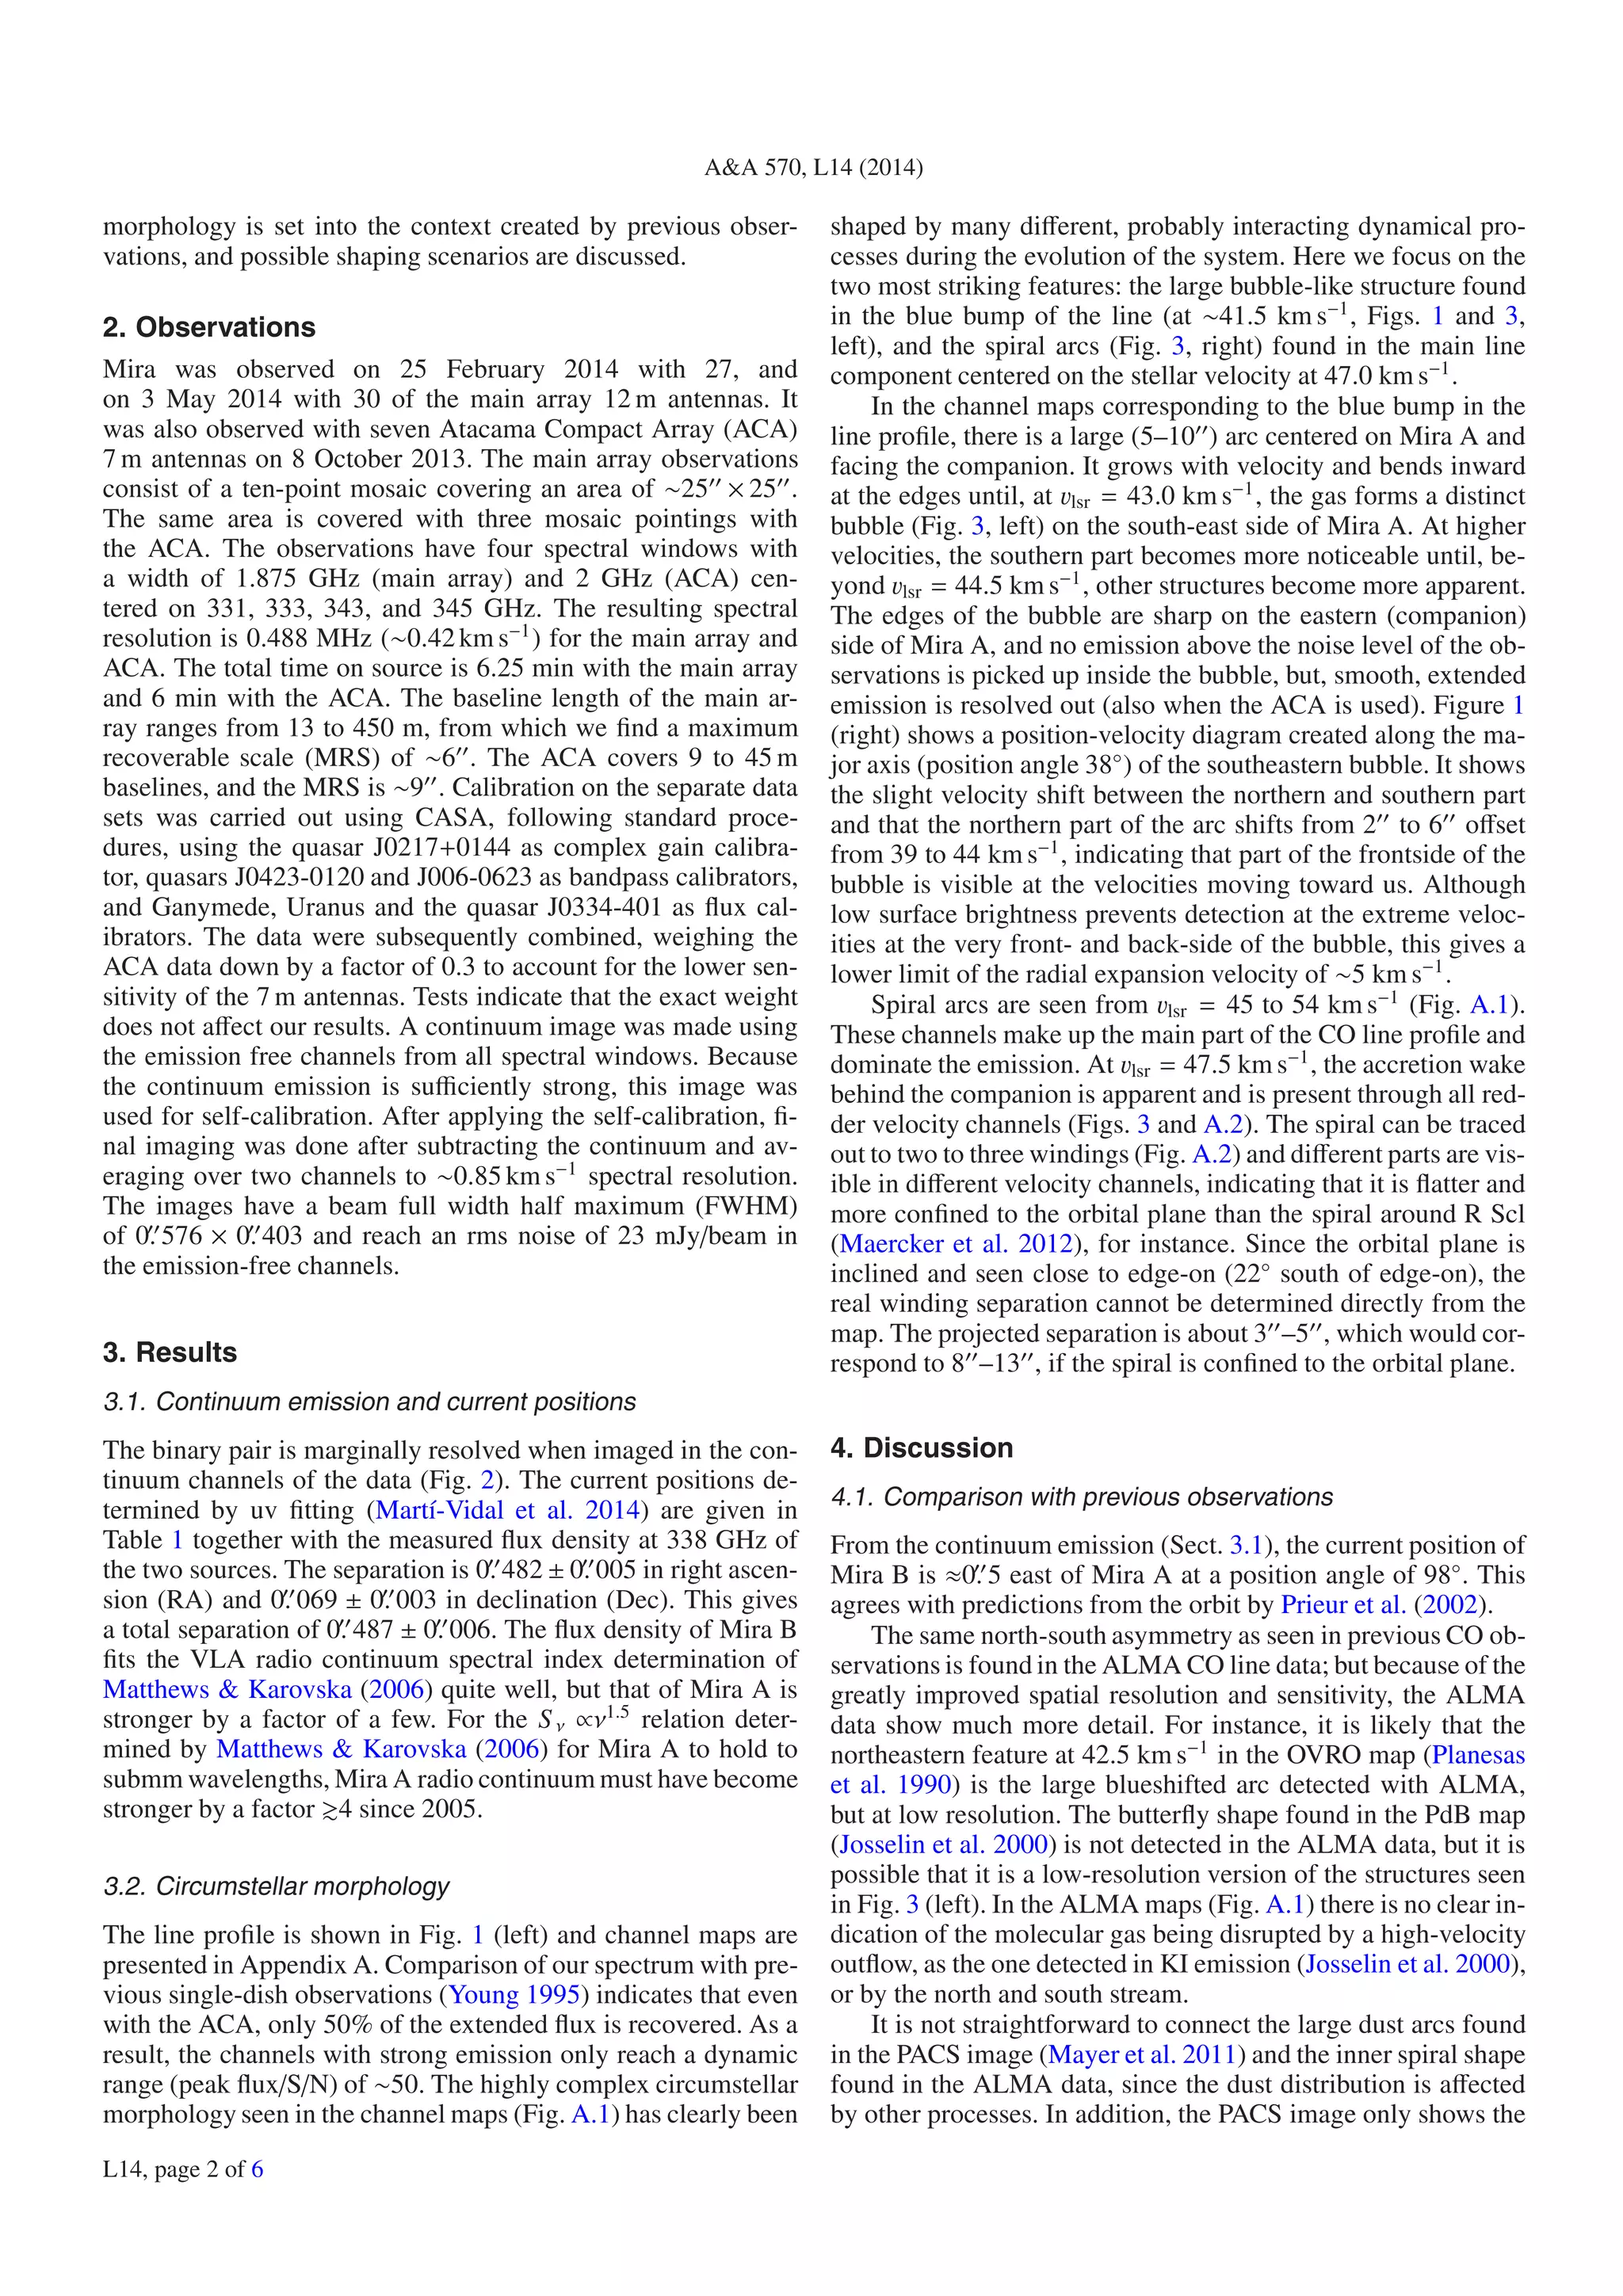
Fig. 3. CO(3–2) map averaged over 2 and 3 km s−1 around vlsr = 43.0 and 50.0 kms−1, respectively, showing the bubble structure (left) and the
spiral arcs (right) discussed in Sect. 3.2. The crosses mark the position of Mira A (west) and B (east). Contours are drawn at multiples of the rms
noise level. The beam is shown in the lower left corner.
the circumstellar material to slowly fill its Roche lobe and even-tually
fall ontoMira B through the inner Lagrangian point (wind
Roche-lobe overflow (WRLOF), Mohamed Podsiadlowski
2007). This will focus the outflow toward the orbital plane, and
the orbital motion will result in a rather flat spiral (Mohamed
Podsiadlowski 2012), unlike the case of R Scl for exam-ple
(Maercker et al. 2012), where the AGB wind has a much
higher expansion velocity (14.5 kms−1) resulting in a spiral
with greater vertical extension. Detailed modeling is beyond the
scope of this paper and will be presented in a future publication.
Preliminary results show that the spiral spacing will be on the or-der
of 500–1000 AU or roughly 5–10 for a distance of 100 pc
(assuming a gas outflow velocity of 5 kms−1 and an orbital pe-riod
between 500 and 1000 yr). The upper end of these theoreti-cal
estimates fit well within the observed spiral separation when
we allow for orbital inclination effects.
5. Conclusions
The CO(3–2) emission from the Mira AB system has been
mapped with ALMA in cycle 1. The maps show the circumstel-lar
molecular gas distribution in amazing detail with the high-est
spatial resolution achieved so far. The complex morphology
confirms that circumstellar material has been shaped by several
interacting dynamical processes (e.g., mass loss, binary shap-ing,
wind-wind interaction, accretion) during the evolution of
the star, and the data presented here can be analyzed to better
understand these processes.
The binary pair is marginally resolved in the continuum and
has a separation of ≈0. 5 at a position angle of 98◦. We suggest
that the features seen in the CO gas emission confirm the sce-nario
where the slow wind of the AGB star fills its Roche lobe
and flows onto the companion in the orbital plane (Mohamed
Podsiadlowski 2007). A relatively flat spiral is formed and seen
as separate arcs at different velocities. The spacing between the
spiral arms agrees with what is expected from the orbit and wind
properties of Mira A. The accretion of material onto the com-panion
gives rise to a varying wind already detected in UV line
emission (Wood Karovska 2004). A tentative explanation is
that this wind blows a large bubble in the circumstellar material
as seen at slightly blueshifted velocities in the ALMA data. The
wind from Mira B is pinched by the accretion disk and is there-fore
oriented preferentially in the north-south direction. Its flow
is also confined by the dense wind of Mira A to the east. Our
estimate of the radial velocity of the material in the shell around
the bubble fits this scenario, while the time scale for the creation
of the bubble is somewhat longer than the orbital period.
Acknowledgements. The authors would like to thank the staff of the Nordic
ALMA ARC node for their indispensable help and support. This paper makes
use of the following ALMA data: ADS/JAO.ALMA#2012.1.00524. S. ALMA
is a partnership of ESO (representing its member states), NSF (USA) and NINS
(Japan), together with NRC (Canada) and NSC and ASIAA (Taiwan), in coop-eration
with the Republic of Chile. The Joint ALMA Observatory is operated
by ESO, AUI/NRAO and NAOJ. W.V. acknowledges support from Marie Curie
Career Integration Grant 321691 and ERC consolidator grant 614264.
References
Fong, D., Meixner, M., Sutton, E. C., Zalucha, A., Welch, W. J. 2006, ApJ,
652, 1626
Josselin, E., Mauron, N., Planesas, P., Bachiller, R. 2000, AA, 362, 255
Karovska, M., Hack, W., Raymond, J., Guinan, E. 1997, ApJ, 482, L175
Karovska, M., Schlegel, E., Hack, W., Raymond, J. C., Wood, B. E. 2005,
ApJ, 623, L137
Knapp, G. R., Young, K., Lee, E., Jorissen, A. 1998, ApJS, 117, 209
Kwok, S. 1983, in Planetary Nebulae, ed. D. R. Flower, IAU Symp., 103, 293
Maercker, M., Mohamed, S., Vlemmings, W. H. T., et al. 2012, Nature, 490, 232
Maercker, M., Ramstedt, S., Leal-Ferreira, M. M. L., Olofsson, G., Florén,
H.-G. 2014 [arXiv:1409.4410]
Martí-Vidal, I., Vlemmings, W. H. T., Muller, S., Casey, S. 2014, AA, 563,
A136
Martin, D. C., Seibert, M., Neill, J. D., et al. 2007, Nature, 448, 780
Matthews, L. D., Karovska, M. 2006, ApJ, 637, L49
Mayer, A., Jorissen, A., Kerschbaum, F., et al. 2011, AA, 531, L4
Meaburn, J., López, J. A., Boumis, P., Lloyd, M., Redman, M. P. 2009, AA,
500, 827
Mohamed, S., Podsiadlowski, P. 2007, in 15th European Workshop on White
Dwarfs, eds. R. Napiwotzki, M. R. Burleigh, ASP Conf. Ser., 372, 397
Mohamed, S., Podsiadlowski, P. 2012, Baltic Astron., 21, 88
Planesas, P., Bachiller, R., Martin-Pintado, J., Bujarrabal, V. 1990, ApJ, 351,
263
Prieur, J. L., Aristidi, E., Lopez, B., et al. 2002, ApJS, 139, 249
Ryde, N., Schöier, F. L. 2001, ApJ, 547, 384
van Leeuwen, F. 2007, AA, 474, 653
Wood, B. E., Karovska, M. 2004, ApJ, 601, 502
Wood, B. E., Karovska, M. 2006, ApJ, 649, 410
Young, K. 1995, ApJ, 445, 872
Pages 5 to 6 are available in the electronic edition of the journal at http://www.aanda.org
L14, page 4 of 6](https://image.slidesharecdn.com/thewonderfulcomplexityofthemiraabsystem-141124083145-conversion-gate02/75/The-wonderful-complexity_of_the_mira_ab_system-4-2048.jpg)
![S. Ramstedt et al.: The wonderful complexity of the Mira AB system
Appendix A:
Maps of the CO(3–2) emission from 36.7 to 53.7 kms−1 at approximately 0.85 km s−1 spectral resolution. As the maps with strong
line emission are limited to a dynamic range of ∼50 because a significant amount of large scale (9) flux is not recovered, the rms
varies between 30 and 160 mJy in the different velocity channels.
36.7 km/s
East Offset [arcsec]
Offset [arcsec]
10 5 0 −5 −10
10
5
0
−5
−10
37.6 km/s
East Offset [arcsec]
Offset [arcsec]
10 5 0 −5 −10
10
5
0
−5
−10
38.4 km/s
East Offset [arcsec]
Offset [arcsec]
10 5 0 −5 −10
10
5
0
−5
−10
39.3 km/s
East Offset [arcsec]
Offset [arcsec]
10 5 0 −5 −10
10
5
0
−5
−10
40.1 km/s
East Offset [arcsec]
Offset [arcsec]
10 5 0 −5 −10
10
5
0
−5
−10
41.0 km/s
East Offset [arcsec]
Offset [arcsec]
10 5 0 −5 −10
10
5
0
−5
−10
41.8 km/s
East Offset [arcsec]
Offset [arcsec]
10 5 0 −5 −10
10
5
0
−5
−10
42.7 km/s
East Offset [arcsec]
Offset [arcsec]
10 5 0 −5 −10
10
5
0
−5
−10
43.5 km/s
East Offset [arcsec]
Offset [arcsec]
10 5 0 −5 −10
10
5
0
−5
−10
44.3 km/s
East Offset [arcsec]
Offset [arcsec]
10 5 0 −5 −10
10
5
0
−5
−10
45.2 km/s
East Offset [arcsec]
Offset [arcsec]
10 5 0 −5 −10
10
5
0
−5
−10
46.9 km/s
East Offset [arcsec]
Offset [arcsec]
10 5 0 −5 −10
10
5
0
−5
−10
47.7 km/s
East Offset [arcsec]
Offset [arcsec]
10 5 0 −5 −10
10
5
0
−5
−10
48.6 km/s
East Offset [arcsec]
Offset [arcsec]
10 5 0 −5 −10
10
5
0
−5
−10
49.4 km/s
East Offset [arcsec]
Offset [arcsec]
10 5 0 −5 −10
10
5
0
−5
−10
50.3 km/s
East Offset [arcsec]
Offset [arcsec]
10 5 0 −5 −10
10
5
0
−5
−10
51.1 km/s
East Offset [arcsec]
Offset [arcsec]
10 5 0 −5 −10
10
5
0
−5
−10
52.0 km/s
East Offset [arcsec]
Offset [arcsec]
10 5 0 −5 −10
10
5
0
−5
−10
52.8 km/s
East Offset [arcsec]
Offset [arcsec]
10 5 0 −5 −10
10
5
0
−5
−10
53.7 km/s
East Offset [arcsec]
Offset [arcsec]
10 5 0 −5 −10
10
5
0
−5
−10
Fig. A.1. CO(3–2) map at 0.9 km s−1 resolution. The crosses mark the positions of Mira A (west) and B (east). Contours are drawn at 3, 5, 10, 20,
40, and 80 times the rms noise level of the respective channel ranging from 30 to 160 mJy. The beam is shown in the lower left corner.
L14, page 5 of 6](https://image.slidesharecdn.com/thewonderfulcomplexityofthemiraabsystem-141124083145-conversion-gate02/75/The-wonderful-complexity_of_the_mira_ab_system-5-2048.jpg)
![AA 570, L14 (2014)
wake
East Offset [arcsec]
Offset [arcsec]
10 5 0 −5 −10
15
10
5
0
−5
−10
−15
Jy/beam
0.5
0.4
0.3
0.2
0.1
0
Fig. A.2. CO(3–2) map averaged from 49 to 54 kms−1. The crosses
mark the positions of Mira A (west) and B (east). Contours are drawn
at 3, 5, 10, 20, 40, and 80 times the rms noise level of the respective
channel ranging from 30 to 160 mJy. The beam is shown in the lower
left corner. A spiral is overplotted to clearly mark the spiral windings,
and the accretion wake behind the companion is indicated.
Figure A.2 shows an average from 49 to 54 kms−1 where the
spiral windings and the accretion wake discussed in Sects. 3.2
and 4.2 are clearly marked.
L14, page 6 of 6](https://image.slidesharecdn.com/thewonderfulcomplexityofthemiraabsystem-141124083145-conversion-gate02/75/The-wonderful-complexity_of_the_mira_ab_system-6-2048.jpg)

The ALMA observations of the Mira AB binary system reveal an amazingly complex circumstellar environment shaped by multiple dynamical processes. In the blue wing of the CO emission line, opposing large arcs form a bubble structure around Mira A, possibly created by the wind from Mira B blowing into Mira A's expanding envelope. In the main line component, spiral arcs are seen around Mira A that appear relatively flat and oriented in the orbital plane. An accretion wake is also visible trailing Mira B. The companion is marginally resolved with a separation of 0.487 arcseconds from Mira A.


