Download as PDF, PPTX

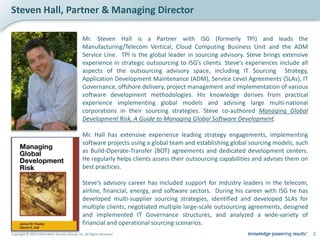
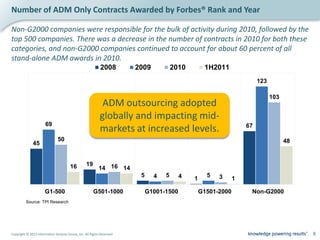
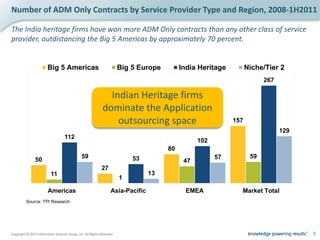
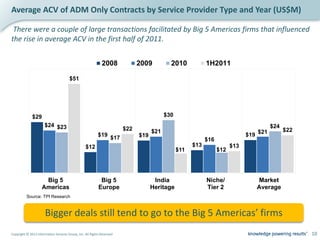
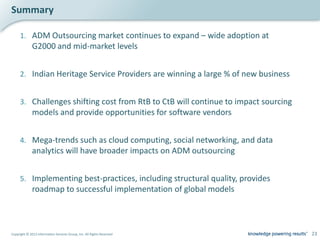
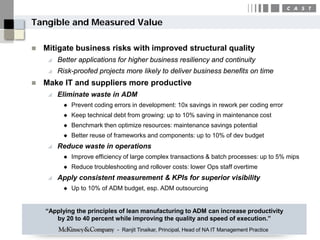


The document discusses the role of Steven Hall, a partner at ISG, in leading outsourcing strategies for various industries, with a particular focus on application development and maintenance (ADM). It highlights the increasing adoption of ADM outsourcing by businesses, particularly non-G2000 and mid-market companies, and the dominance of Indian heritage firms in the market. Additionally, it emphasizes the challenges and opportunities in transitioning to a change-the-business model and implementing best practices to enhance software quality and productivity.


