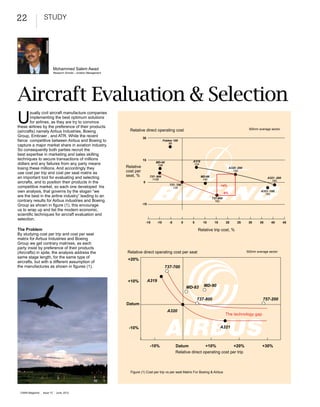
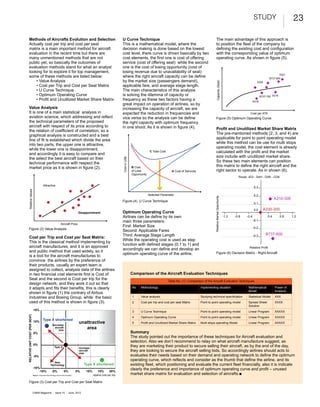
SlideShare a Scribd company logo
22                   study


                                Mohammed Salem Awad
                                Research Scholar – Aviation Management


Aircraft Evaluation & Selection
U
        sually civil aircraft manufacture companies
        implementing the best optimum solutions
        for airlines, as they are try to convince
these airlines by the preference of their products
                                                                           Relative direct operating cost                                                                   500nm average sector
(aircrafts) namely Airbus Industries, Boeing
Group, Embraer , and ATR. While the recent                                          30
fierce competitive between Airbus and Boeing to                                                        Fokker 100
                                                                                                           98
capture a major market share in aviation industry.
So consequently both parties recruit the
best expertise in marketing and sales skilling
techniques to secure transactions of millions                                       15                                      A319
dollars and any failures from any party means                                                  MD-95
                                                                                                                            124
losing these millions. And accordingly they                              Relative               106
                                                                                                                                                               A320 -200
use cost per trip and cost per seat matrix as                            cost per                                                                                150

an important tool for evaluating and selecting                           seat, %           737- 600                                MD-88                                                A321 -200
                                                                                             1108                                   142
aircrafts, and to position their products in the                                    0                                                                                                     183
                                                                                                           737- 700                              -14%
competitive market, so each one developed his                                                                126
own analysis, that governs by the slogan “we                                                                                                             -8%
                                                                                                                                                                                    A321 -100
                                                                                                                                                                                      183
are the best in the airline industry” leading to an                                                                                        737-800
contrary results for Airbus industries and Boeing
                                                                                                                                                     ‫و‬


                                                                                                                                             162
Group as shown in figure (1), this encourage                                        -15
us to wrap up and list the modern economic,
scientific techniques for aircraft evaluation and
selection.
                                                                                        -15      -10       -5         0     5       10      15            20        25      30     35     40        45

The Problem                                                                                                                     Relative trip cost, %
By studying cost per trip and cost per seat
matrix for Airbus Industries and Boeing
Group we get contrary matrixes, as each
party insist by preference of their products
(Aircrafts) in spite, the analysis address the                           Relative direct operating cost per seat                                                           500nm average sector
same stage length, for the same type of
                                                                          +20%
aircrafts, but with a different assumption of
the manufactures as shown in figures (1).                                                               737-700


                                                                          +10%            A319
                                                                                                                          MD-83     MD-90


                                                                                                                                737-800                                              757-200
                                                                         Datum
                                                                                                          A320
                                                                                                                                                          The technology gap


                                                                          -10%                                                                   A321


                                                                                           -10%                 Datum            +10%           +20%                                 +30%
                                                                                                                Relative direct operating cost per trip


                                                                           Figure (1) Cost per trip vs per seat Matrix For Boeing & Airbus


 CAMA Magazine   |   issue 15   |   June, 2012
study                         23

      Methods of Aircrafts Evolution and Selection                                                                               U Curve Technique                                                                   The main advantage of this approach is
      Actually cost per trip and cost per seat                                                                                   This is a mathematical model, where the                                             to position the fleet of the company by
      matrix is a main important method for aircraft                                                                             decision making is done based on the lowest                                         defining the existing cost and configuration
      evaluation in the recent time but there are                                                                                cost level, there curve is driven basically by two                                  with the corresponding value of optimum
      many unmentioned methods that are not                                                                                      cost elements, the first one is cost of offering                                    operating curve. As shown in figure (5).
      public yet, so basically the outcomes of                                                                                   service (cost of offering seat) while the second
      evaluation methods stand for what an analyst                                                                               one is the cost of losing opportunity (cost of
      looking for to explore it for top management,                                                                              losing revenue due to unavailability of seat)
                                                                                                                                                                                                                                                                                      A321
      some of these methods are listed below:                                                                                    where the right aircraft capacity can be define                                                                                               B737-800
          • Value Analysis                                                                                                       by the market size (passengers demand),


                                                                                                                                                                                                                    Capacity (Seat)
                                                                                                                                                                                                                                                                     A320
          • Cost per Trip and Cost per Seat Matrix                                                                               applicable fare, and average stage length.
          • U Curve Technique                                                                                                    The main characteristics of this analysis
          • Optimum Operating Curve                                                                                              is solving the dilemma of capacity or                                                                                                   B737-700 A319
          • Profit and Unutilized Market Share Matrix                                                                            frequency as these two factors having a                                                                                          A318
                                                                                                                                 great impact on operation of airlines, so by
      Value Analysis                                                                                                             increasing the capacity of aircraft, we are
      It is one of a main statistical analysis in                                                                                expected the reduction in frequencies and                                                                                    Cost per ATK
      aviation science, which addressing and reflect                                                                             vice versa so the analysis can be define                                            Figure (5) Optimum Operating Curve
      the technical parameters of the proposed                                                                                   the right capacity with optimum frequency
      aircraft with respect of its price according to                                                                            in one shoot. As it is shown in figure (4).
      the relation of coefficient of correlation, so a                                                                                                                                                               Profit and Unutilized Market Share Matrix
      graphical analysis is constructed and a best                                                                                                                                                                   The pre-mentioned methods (2, 3, and 4) are
      line of fit is established which divide the area                                                                                                                                                               applicable for point to point operating model
      into two parts, the upper one is attractive,                                                                                                                                                                   while this method can be use for multi stops
      while the lower one is disappointment,                                                                                                                                                                         operating model, the cost element is already
      and accordingly it is easy to compare and
                                                                                                                                                              C Total Cost                                           calculated with the profit and the market
      the select the best aircraft based on their                                                                                                                                                                    size include with unutilized market share.
                                                                                                                                 Cost in US$


      technical performance with respect the                                                                                                                                                                         So these two main elements can position
      market price as it is shown in figure (2).                                                                                               B Cost                                                                this matrix to define the right aircraft and the
                                                                                                                                               of Lose                         A Cost of Services                    right sector to operate. As in shown (6).
                                                                                                                                               Opportunity
                                                                                                                                                                                                                                                      Route: JED - SAH - DXB - CGK

                                              Attractive
                                                                                                                                                                                                                                                                  0.3
    Relative Values


                                                                                                                                                             Selected Parameter                                                                                   0.2


                                                                                                                                                                                                               Relative Market Opportunity
                                                                                                                                                                                                                                                                                    A310-300
                                                                                                                                 Figure.(4). U Curve Technique
                                                                                                                                                                                                                                                                  0.1

                                                                                                                                                                                                                                                                  0.0      A330-200
                                                                                            Disappointment                       Optimum Operating Curve
                                                                                                                                 Airlines can be define by its own                                                                           -1.2   -0.8   -0.4               0.4        0.8   1.2
                                                                                                                                 main three parameters:                                                                                                           -0.1
                                                                        Aircraft Price
                                                                                                                                 First: Market Size                                                                                                               -0.2
      Figure (2) Value Analysis
                                                                                                                                 Second: Applicable Fares
                                                                                                                                 Third: Average Stage Length                                                                                                      -0.3       B737-800
      Cost per Trip and Cost per Seat Matrix:
                                                                                                                                 While the operating cost is used as step
      This is the classical method implementing by
                                                                                                                                 function with defined stages (0.1 to 1) and
      aircraft manufactures, and it is an approved                                                                                                                                                                                                           Relative Profit
                                                                                                                                 accordingly we can define and develop an
      and public method that used widely, so it                                                                                                                                                                      Figure (6) Decision Matrix - Right Aircraft
                                                                                                                                 optimum operating curve of the airline.
      is a tool for the aircraft manufactures to
      convince the airlines by the preference of
      their products, usually an expert team is
      assigned to collect, analysis data of the airlines
      in two financial cost elements first is Cost of                                                                                          Comparison of the Aircraft Evaluation Techniques
      Seat and the second is Cost per trip for the                                                                                                                           Table No. (1): Comparison of the Aircraft Evaluation Techniques
      design network, and they work it out so that
      it adapts and fits their benefits, this is clearly                                                                                        No.   Methodology                                   Implementing situation                                  Mathematical            Power of
                                                                                                                                                                                                                                                            Model                   Analysis
      shown in figure (1) the contrary of Airbus
      Industries and Boeing Group, while the basic                                                                                              1     Value analysis                                Studying technical specification                        Statistical Model       XXX
      used of this method is shown in figure (3).                                                                                               2     Cost per trip and cost per seat Matrix        Point to point operating model                          Spread Sheet            XXXX
                                                                                                                                                                                                                                                            Solution
                                15%                                                                                                             3     U Curve Technique                             Point to point operating model                          Linear Program          XXXXX
RELATIVE UNIT COST (PER SEAT)


                                                                                                                                                4     Optimum Operating Curve                       Point to point operating model                          Linear Program          XXXXX
                                              Type X shortened
                                10%
                                                            Decrease
                                                                                            unattractive                                        5     Profit and Unutilized Market Share Matrix     Multi-stops operating Model                             Linear Program          XXXXX
                                                              aircraft
                                                                 size
                                                                                               area
                                5%                                                                                                             Summary
                                                                                                                                               The study pointed out the importance of these techniques for Aircraft evaluation and
                                                                                                                                               selection. Also we don’t recommend to relay on what aircraft manufacture suggest, as
                                0%                                                                                                             they are marketing their product to secure selling their aircraft, as by the end of the day,
                                                                 Type X                     Increase
                                                                                            aircraft                                           they are looking to secure the aircraft selling bids. So accordingly airlines should acts to
                                                                                            size
                                -5%                                                                                                            evaluates their needs based on their demand and operating network to define the optimum
                                                                                                                                               operating curve, which reflects and consider as the thumb that define the airline, and its
                                                            New
                                                         Technology                              Type X shortened                              existing fleet, which positioning and evaluate the current fleet financially, also it is indicate
                                -10%                                                                                                           clearly the preference and importance of optimum operating curve and profit – unused
                                    -10%                   -5%              0%             5%     10%       15%        20%
                                Source: Corporate Fleet Strategy and Aircraft Evaluation                relative cost per trip                 market share matrix for evaluation and selection of aircrafts.■
      Figure (3) Cost per Trip and Cost per Seat Matrix


                                CAMA Magazine                |   issue 15       |   June, 2012
Aircraft Evaluation & Selection

                                                                             Socotra Lovers Destination

                                                                             Airports Forecasting

Civil Aviation & Meteorology Authority (Yemen) April - June 2012, issue 15


    Emirates
                 United Arab


                                  Aviation Empire Invading the Sky


                                                                                      www.camamagazine.com

More Related Content

What's hot

Airline Business Models and Competitive Strategies - virtual simulation course
Airline Business Models and Competitive Strategies - virtual simulation courseAirline Business Models and Competitive Strategies - virtual simulation course
Airline Business Models and Competitive Strategies - virtual simulation course
IATA Training & Development Institute
 
HOW TO MEASURE AIRCRAFT TYPE CAPACITY? AN INNOCENT QUESTION WITH BIG CONSEQUE...
HOW TO MEASURE AIRCRAFT TYPE CAPACITY? AN INNOCENT QUESTION WITH BIG CONSEQUE...HOW TO MEASURE AIRCRAFT TYPE CAPACITY? AN INNOCENT QUESTION WITH BIG CONSEQUE...
HOW TO MEASURE AIRCRAFT TYPE CAPACITY? AN INNOCENT QUESTION WITH BIG CONSEQUE...
DanielSALLIER
 
Scheduling and Revenue Management
Scheduling and Revenue ManagementScheduling and Revenue Management
Scheduling and Revenue Management
nsihammou
 
Business plan presentation
Business plan presentationBusiness plan presentation
Business plan presentationHamed Jabbari
 
Thai vs Air Asia
Thai vs Air AsiaThai vs Air Asia
Thai vs Air Asia
Mohammed Awad
 
Is Low Cost Carrier Profitable - Norwegian article - Issue No. 1
Is Low Cost Carrier Profitable  - Norwegian article - Issue No. 1Is Low Cost Carrier Profitable  - Norwegian article - Issue No. 1
Is Low Cost Carrier Profitable - Norwegian article - Issue No. 1
Mohammed Awad
 
Revenue Management And Dynamic Pricing Part I
Revenue Management And Dynamic Pricing Part IRevenue Management And Dynamic Pricing Part I
Revenue Management And Dynamic Pricing Part I
Stenden Unversity
 
Route development
Route developmentRoute development
Route development
Mohammed Awad
 
A Regional Airline interconnecting the Middle East
A Regional Airline interconnecting the Middle EastA Regional Airline interconnecting the Middle East
A Regional Airline interconnecting the Middle East
Mohammed Awad
 
Shared aircraft spares holdings or pooling: To increase air carrier operation...
Shared aircraft spares holdings or pooling: To increase air carrier operation...Shared aircraft spares holdings or pooling: To increase air carrier operation...
Shared aircraft spares holdings or pooling: To increase air carrier operation...
Mersie Amha Melke
 
Standoutfromthe crowds
Standoutfromthe crowdsStandoutfromthe crowds
Standoutfromthe crowds
Mohammed Awad
 
Ryanair’s competitive strategy review (2013, UK)
Ryanair’s competitive strategy review (2013, UK) Ryanair’s competitive strategy review (2013, UK)
Ryanair’s competitive strategy review (2013, UK)
Yuri KIRPICHNIKOV
 
Ryanair - Accounting, finance & control project
Ryanair - Accounting, finance & control projectRyanair - Accounting, finance & control project
Ryanair - Accounting, finance & control project
filippo cheli
 
Aircraft Seating
Aircraft SeatingAircraft Seating
Aircraft Seating
Torben Haagh
 
Revenue passenger mile & Yield
Revenue passenger mile & YieldRevenue passenger mile & Yield
Revenue passenger mile & Yield
Prateek Garodia
 
Standout From The Crowds
Standout From The CrowdsStandout From The Crowds
Standout From The Crowds
Mohammed Awad
 
Ryanair Low-Cost Strategy Business Model
Ryanair Low-Cost Strategy Business ModelRyanair Low-Cost Strategy Business Model
Ryanair Low-Cost Strategy Business Model
Kevin Constant
 
Fleet repositioning
Fleet repositioningFleet repositioning
Fleet repositioning
Mohammed Awad
 
A classification and assessment of research streams on low cost modeling in c...
A classification and assessment of research streams on low cost modeling in c...A classification and assessment of research streams on low cost modeling in c...
A classification and assessment of research streams on low cost modeling in c...Alexander Decker
 

What's hot (20)

Airline Business Models and Competitive Strategies - virtual simulation course
Airline Business Models and Competitive Strategies - virtual simulation courseAirline Business Models and Competitive Strategies - virtual simulation course
Airline Business Models and Competitive Strategies - virtual simulation course
 
HOW TO MEASURE AIRCRAFT TYPE CAPACITY? AN INNOCENT QUESTION WITH BIG CONSEQUE...
HOW TO MEASURE AIRCRAFT TYPE CAPACITY? AN INNOCENT QUESTION WITH BIG CONSEQUE...HOW TO MEASURE AIRCRAFT TYPE CAPACITY? AN INNOCENT QUESTION WITH BIG CONSEQUE...
HOW TO MEASURE AIRCRAFT TYPE CAPACITY? AN INNOCENT QUESTION WITH BIG CONSEQUE...
 
Scheduling and Revenue Management
Scheduling and Revenue ManagementScheduling and Revenue Management
Scheduling and Revenue Management
 
Business plan presentation
Business plan presentationBusiness plan presentation
Business plan presentation
 
Thai vs Air Asia
Thai vs Air AsiaThai vs Air Asia
Thai vs Air Asia
 
Is Low Cost Carrier Profitable - Norwegian article - Issue No. 1
Is Low Cost Carrier Profitable  - Norwegian article - Issue No. 1Is Low Cost Carrier Profitable  - Norwegian article - Issue No. 1
Is Low Cost Carrier Profitable - Norwegian article - Issue No. 1
 
Revenue Management And Dynamic Pricing Part I
Revenue Management And Dynamic Pricing Part IRevenue Management And Dynamic Pricing Part I
Revenue Management And Dynamic Pricing Part I
 
CDM Aviation Point of View
CDM Aviation Point of View CDM Aviation Point of View
CDM Aviation Point of View
 
Route development
Route developmentRoute development
Route development
 
A Regional Airline interconnecting the Middle East
A Regional Airline interconnecting the Middle EastA Regional Airline interconnecting the Middle East
A Regional Airline interconnecting the Middle East
 
Shared aircraft spares holdings or pooling: To increase air carrier operation...
Shared aircraft spares holdings or pooling: To increase air carrier operation...Shared aircraft spares holdings or pooling: To increase air carrier operation...
Shared aircraft spares holdings or pooling: To increase air carrier operation...
 
Standoutfromthe crowds
Standoutfromthe crowdsStandoutfromthe crowds
Standoutfromthe crowds
 
Ryanair’s competitive strategy review (2013, UK)
Ryanair’s competitive strategy review (2013, UK) Ryanair’s competitive strategy review (2013, UK)
Ryanair’s competitive strategy review (2013, UK)
 
Ryanair - Accounting, finance & control project
Ryanair - Accounting, finance & control projectRyanair - Accounting, finance & control project
Ryanair - Accounting, finance & control project
 
Aircraft Seating
Aircraft SeatingAircraft Seating
Aircraft Seating
 
Revenue passenger mile & Yield
Revenue passenger mile & YieldRevenue passenger mile & Yield
Revenue passenger mile & Yield
 
Standout From The Crowds
Standout From The CrowdsStandout From The Crowds
Standout From The Crowds
 
Ryanair Low-Cost Strategy Business Model
Ryanair Low-Cost Strategy Business ModelRyanair Low-Cost Strategy Business Model
Ryanair Low-Cost Strategy Business Model
 
Fleet repositioning
Fleet repositioningFleet repositioning
Fleet repositioning
 
A classification and assessment of research streams on low cost modeling in c...
A classification and assessment of research streams on low cost modeling in c...A classification and assessment of research streams on low cost modeling in c...
A classification and assessment of research streams on low cost modeling in c...
 

Viewers also liked

Spill passengers article
Spill passengers articleSpill passengers article
Spill passengers article
Mohammed Hadi
 
Aviation statistical analysis
Aviation statistical analysisAviation statistical analysis
Aviation statistical analysis
Mohammed Hadi
 
Aviation Article : Getting The Right Picture
Aviation Article  : Getting The Right PictureAviation Article  : Getting The Right Picture
Aviation Article : Getting The Right Picture
Mohammed Hadi
 
Check interval escalation
Check interval escalationCheck interval escalation
Check interval escalation
Mohammed Hadi
 
All Roads lead to Sanna article
All Roads lead to Sanna  articleAll Roads lead to Sanna  article
All Roads lead to Sanna article
Mohammed Hadi
 
Cama Aviation Articles
Cama Aviation ArticlesCama Aviation Articles
Cama Aviation Articles
Mohammed Hadi
 
Overbooking policy for an Airline
Overbooking policy for an AirlineOverbooking policy for an Airline
Overbooking policy for an Airline
Mohammed Hadi
 
Overbooking policy revenue management1
Overbooking policy  revenue management1Overbooking policy  revenue management1
Overbooking policy revenue management1
Mohammed Awad
 
Airport forecasting
Airport forecastingAirport forecasting
Airport forecasting
Mohammed Hadi
 
Engine stock control article
Engine stock control article Engine stock control article
Engine stock control article
Mohammed Hadi
 

Viewers also liked (10)

Spill passengers article
Spill passengers articleSpill passengers article
Spill passengers article
 
Aviation statistical analysis
Aviation statistical analysisAviation statistical analysis
Aviation statistical analysis
 
Aviation Article : Getting The Right Picture
Aviation Article  : Getting The Right PictureAviation Article  : Getting The Right Picture
Aviation Article : Getting The Right Picture
 
Check interval escalation
Check interval escalationCheck interval escalation
Check interval escalation
 
All Roads lead to Sanna article
All Roads lead to Sanna  articleAll Roads lead to Sanna  article
All Roads lead to Sanna article
 
Cama Aviation Articles
Cama Aviation ArticlesCama Aviation Articles
Cama Aviation Articles
 
Overbooking policy for an Airline
Overbooking policy for an AirlineOverbooking policy for an Airline
Overbooking policy for an Airline
 
Overbooking policy revenue management1
Overbooking policy  revenue management1Overbooking policy  revenue management1
Overbooking policy revenue management1
 
Airport forecasting
Airport forecastingAirport forecasting
Airport forecasting
 
Engine stock control article
Engine stock control article Engine stock control article
Engine stock control article
 

Similar to Aircraft evaluation article

Evaluation short operation segment
Evaluation short operation segmentEvaluation short operation segment
Evaluation short operation segment
Mohammed Awad
 
An overview of the engine market: forecasts, analyses and plans ahead. George...
An overview of the engine market: forecasts, analyses and plans ahead. George...An overview of the engine market: forecasts, analyses and plans ahead. George...
An overview of the engine market: forecasts, analyses and plans ahead. George...
Fionabenharoosh
 
2X 1 1GENERAL FAMILIARIZATION TRAINING INTRO.pdf
2X 1 1GENERAL FAMILIARIZATION TRAINING INTRO.pdf2X 1 1GENERAL FAMILIARIZATION TRAINING INTRO.pdf
2X 1 1GENERAL FAMILIARIZATION TRAINING INTRO.pdf
briannolasco102506
 
goodrich MasterJefferiesConfFinal
goodrich  MasterJefferiesConfFinalgoodrich  MasterJefferiesConfFinal
goodrich MasterJefferiesConfFinalfinance44
 
goodrich MasterJefferiesConfFinal
goodrich  MasterJefferiesConfFinalgoodrich  MasterJefferiesConfFinal
goodrich MasterJefferiesConfFinalfinance44
 
Airbus a330 200 f
Airbus a330 200 fAirbus a330 200 f
Airbus a330 200 fEXPAIRTISE
 
REFASHIOND - Aerotrax 2022.pdf
REFASHIOND - Aerotrax 2022.pdfREFASHIOND - Aerotrax 2022.pdf
REFASHIOND - Aerotrax 2022.pdf
REFASHIOND
 
DESIGN OF AVIONICS ARCHITECTURE
DESIGN OF AVIONICS ARCHITECTUREDESIGN OF AVIONICS ARCHITECTURE
DESIGN OF AVIONICS ARCHITECTURE
MIbrar4
 
goodrich AllMasterBW
goodrich  AllMasterBWgoodrich  AllMasterBW
goodrich AllMasterBWfinance44
 
goodrich AllMasterBW
goodrich  AllMasterBWgoodrich  AllMasterBW
goodrich AllMasterBWfinance44
 
goodrich 1206csfb
goodrich  1206csfbgoodrich  1206csfb
goodrich 1206csfbfinance44
 
goodrich 1206csfb
goodrich  1206csfbgoodrich  1206csfb
goodrich 1206csfbfinance44
 
2014 25-52 emergency
2014 25-52 emergency2014 25-52 emergency
frankfinn Aviation Merit & Disctinction ppt by TAHER SALIM (INDORE)
frankfinn  Aviation Merit &  Disctinction ppt by TAHER SALIM (INDORE)frankfinn  Aviation Merit &  Disctinction ppt by TAHER SALIM (INDORE)
frankfinn Aviation Merit & Disctinction ppt by TAHER SALIM (INDORE)Taher Salim
 
goodrich CSFB_11.07
goodrich  CSFB_11.07goodrich  CSFB_11.07
goodrich CSFB_11.07finance44
 
goodrich CSFB_11.07
goodrich  CSFB_11.07goodrich  CSFB_11.07
goodrich CSFB_11.07finance44
 
Aviation Feed - Airbus A320_ Aircraft Condition Monitoring Systems.pdf
Aviation Feed - Airbus A320_ Aircraft Condition Monitoring Systems.pdfAviation Feed - Airbus A320_ Aircraft Condition Monitoring Systems.pdf
Aviation Feed - Airbus A320_ Aircraft Condition Monitoring Systems.pdf
k.m.sathiskumar
 
Jet blue airways managing growth
Jet blue airways managing growthJet blue airways managing growth
Jet blue airways managing growth
Abhishek Mishra
 
Crisis In Regional Aviation
Crisis In Regional AviationCrisis In Regional Aviation
Crisis In Regional Aviation
Andrew_Watterson
 

Similar to Aircraft evaluation article (20)

Evaluation short operation segment
Evaluation short operation segmentEvaluation short operation segment
Evaluation short operation segment
 
An overview of the engine market: forecasts, analyses and plans ahead. George...
An overview of the engine market: forecasts, analyses and plans ahead. George...An overview of the engine market: forecasts, analyses and plans ahead. George...
An overview of the engine market: forecasts, analyses and plans ahead. George...
 
2X 1 1GENERAL FAMILIARIZATION TRAINING INTRO.pdf
2X 1 1GENERAL FAMILIARIZATION TRAINING INTRO.pdf2X 1 1GENERAL FAMILIARIZATION TRAINING INTRO.pdf
2X 1 1GENERAL FAMILIARIZATION TRAINING INTRO.pdf
 
goodrich MasterJefferiesConfFinal
goodrich  MasterJefferiesConfFinalgoodrich  MasterJefferiesConfFinal
goodrich MasterJefferiesConfFinal
 
goodrich MasterJefferiesConfFinal
goodrich  MasterJefferiesConfFinalgoodrich  MasterJefferiesConfFinal
goodrich MasterJefferiesConfFinal
 
Airbus a330 200 f
Airbus a330 200 fAirbus a330 200 f
Airbus a330 200 f
 
REFASHIOND - Aerotrax 2022.pdf
REFASHIOND - Aerotrax 2022.pdfREFASHIOND - Aerotrax 2022.pdf
REFASHIOND - Aerotrax 2022.pdf
 
DESIGN OF AVIONICS ARCHITECTURE
DESIGN OF AVIONICS ARCHITECTUREDESIGN OF AVIONICS ARCHITECTURE
DESIGN OF AVIONICS ARCHITECTURE
 
goodrich AllMasterBW
goodrich  AllMasterBWgoodrich  AllMasterBW
goodrich AllMasterBW
 
goodrich AllMasterBW
goodrich  AllMasterBWgoodrich  AllMasterBW
goodrich AllMasterBW
 
goodrich 1206csfb
goodrich  1206csfbgoodrich  1206csfb
goodrich 1206csfb
 
goodrich 1206csfb
goodrich  1206csfbgoodrich  1206csfb
goodrich 1206csfb
 
2014 25-52 emergency
2014 25-52 emergency2014 25-52 emergency
2014 25-52 emergency
 
frankfinn Aviation Merit & Disctinction ppt by TAHER SALIM (INDORE)
frankfinn  Aviation Merit &  Disctinction ppt by TAHER SALIM (INDORE)frankfinn  Aviation Merit &  Disctinction ppt by TAHER SALIM (INDORE)
frankfinn Aviation Merit & Disctinction ppt by TAHER SALIM (INDORE)
 
Airbus A330
Airbus A330Airbus A330
Airbus A330
 
goodrich CSFB_11.07
goodrich  CSFB_11.07goodrich  CSFB_11.07
goodrich CSFB_11.07
 
goodrich CSFB_11.07
goodrich  CSFB_11.07goodrich  CSFB_11.07
goodrich CSFB_11.07
 
Aviation Feed - Airbus A320_ Aircraft Condition Monitoring Systems.pdf
Aviation Feed - Airbus A320_ Aircraft Condition Monitoring Systems.pdfAviation Feed - Airbus A320_ Aircraft Condition Monitoring Systems.pdf
Aviation Feed - Airbus A320_ Aircraft Condition Monitoring Systems.pdf
 
Jet blue airways managing growth
Jet blue airways managing growthJet blue airways managing growth
Jet blue airways managing growth
 
Crisis In Regional Aviation
Crisis In Regional AviationCrisis In Regional Aviation
Crisis In Regional Aviation
 

More from Mohammed Hadi

Winners and Losers
Winners and LosersWinners and Losers
Winners and Losers
Mohammed Hadi
 
Route Profitability - SAH-BAH-SAH
Route Profitability - SAH-BAH-SAHRoute Profitability - SAH-BAH-SAH
Route Profitability - SAH-BAH-SAH
Mohammed Hadi
 
Bcg article
Bcg articleBcg article
Bcg article
Mohammed Hadi
 
Story of success
Story of successStory of success
Story of success
Mohammed Hadi
 
Value analysis aircrafts
Value analysis   aircraftsValue analysis   aircrafts
Value analysis aircrafts
Mohammed Hadi
 
Breif of my book
Breif of my bookBreif of my book
Breif of my book
Mohammed Hadi
 
Spill analysis cama
Spill analysis camaSpill analysis cama
Spill analysis cama
Mohammed Hadi
 
Forecasting article cama
Forecasting article camaForecasting article cama
Forecasting article cama
Mohammed Hadi
 
Engine stock control
Engine stock controlEngine stock control
Engine stock control
Mohammed Hadi
 
Check interval escalation
Check interval escalationCheck interval escalation
Check interval escalation
Mohammed Hadi
 
Bcg matrix article
Bcg matrix articleBcg matrix article
Bcg matrix article
Mohammed Hadi
 
All routes lead to sanaa
All routes lead to sanaaAll routes lead to sanaa
All routes lead to sanaa
Mohammed Hadi
 
Airport forecasting 1
Airport forecasting 1Airport forecasting 1
Airport forecasting 1
Mohammed Hadi
 
Route profitability bahrain
Route profitability bahrainRoute profitability bahrain
Route profitability bahrain
Mohammed Hadi
 
Statistical analysis article
Statistical analysis articleStatistical analysis article
Statistical analysis article
Mohammed Hadi
 
Airlines also have their own words
Airlines also have their own wordsAirlines also have their own words
Airlines also have their own words
Mohammed Hadi
 

More from Mohammed Hadi (16)

Winners and Losers
Winners and LosersWinners and Losers
Winners and Losers
 
Route Profitability - SAH-BAH-SAH
Route Profitability - SAH-BAH-SAHRoute Profitability - SAH-BAH-SAH
Route Profitability - SAH-BAH-SAH
 
Bcg article
Bcg articleBcg article
Bcg article
 
Story of success
Story of successStory of success
Story of success
 
Value analysis aircrafts
Value analysis   aircraftsValue analysis   aircrafts
Value analysis aircrafts
 
Breif of my book
Breif of my bookBreif of my book
Breif of my book
 
Spill analysis cama
Spill analysis camaSpill analysis cama
Spill analysis cama
 
Forecasting article cama
Forecasting article camaForecasting article cama
Forecasting article cama
 
Engine stock control
Engine stock controlEngine stock control
Engine stock control
 
Check interval escalation
Check interval escalationCheck interval escalation
Check interval escalation
 
Bcg matrix article
Bcg matrix articleBcg matrix article
Bcg matrix article
 
All routes lead to sanaa
All routes lead to sanaaAll routes lead to sanaa
All routes lead to sanaa
 
Airport forecasting 1
Airport forecasting 1Airport forecasting 1
Airport forecasting 1
 
Route profitability bahrain
Route profitability bahrainRoute profitability bahrain
Route profitability bahrain
 
Statistical analysis article
Statistical analysis articleStatistical analysis article
Statistical analysis article
 
Airlines also have their own words
Airlines also have their own wordsAirlines also have their own words
Airlines also have their own words
 

Recently uploaded

VAT Registration Outlined In UAE: Benefits and Requirements
VAT Registration Outlined In UAE: Benefits and RequirementsVAT Registration Outlined In UAE: Benefits and Requirements
VAT Registration Outlined In UAE: Benefits and Requirements
uae taxgpt
 
Project File Report BBA 6th semester.pdf
Project File Report BBA 6th semester.pdfProject File Report BBA 6th semester.pdf
Project File Report BBA 6th semester.pdf
RajPriye
 
ikea_woodgreen_petscharity_cat-alogue_digital.pdf
ikea_woodgreen_petscharity_cat-alogue_digital.pdfikea_woodgreen_petscharity_cat-alogue_digital.pdf
ikea_woodgreen_petscharity_cat-alogue_digital.pdf
agatadrynko
 
Sustainability: Balancing the Environment, Equity & Economy
Sustainability: Balancing the Environment, Equity & EconomySustainability: Balancing the Environment, Equity & Economy
Sustainability: Balancing the Environment, Equity & Economy
Operational Excellence Consulting
 
Tata Group Dials Taiwan for Its Chipmaking Ambition in Gujarat’s Dholera
Tata Group Dials Taiwan for Its Chipmaking Ambition in Gujarat’s DholeraTata Group Dials Taiwan for Its Chipmaking Ambition in Gujarat’s Dholera
Tata Group Dials Taiwan for Its Chipmaking Ambition in Gujarat’s Dholera
Avirahi City Dholera
 
Brand Analysis for an artist named Struan
Brand Analysis for an artist named StruanBrand Analysis for an artist named Struan
Brand Analysis for an artist named Struan
sarahvanessa51503
 
Unveiling the Secrets How Does Generative AI Work.pdf
Unveiling the Secrets How Does Generative AI Work.pdfUnveiling the Secrets How Does Generative AI Work.pdf
Unveiling the Secrets How Does Generative AI Work.pdf
Sam H
 
Discover the innovative and creative projects that highlight my journey throu...
Discover the innovative and creative projects that highlight my journey throu...Discover the innovative and creative projects that highlight my journey throu...
Discover the innovative and creative projects that highlight my journey throu...
dylandmeas
 
Business Valuation Principles for Entrepreneurs
Business Valuation Principles for EntrepreneursBusiness Valuation Principles for Entrepreneurs
Business Valuation Principles for Entrepreneurs
Ben Wann
 
Putting the SPARK into Virtual Training.pptx
Putting the SPARK into Virtual Training.pptxPutting the SPARK into Virtual Training.pptx
Putting the SPARK into Virtual Training.pptx
Cynthia Clay
 
ikea_woodgreen_petscharity_dog-alogue_digital.pdf
ikea_woodgreen_petscharity_dog-alogue_digital.pdfikea_woodgreen_petscharity_dog-alogue_digital.pdf
ikea_woodgreen_petscharity_dog-alogue_digital.pdf
agatadrynko
 
April 2024 Nostalgia Products Newsletter
April 2024 Nostalgia Products NewsletterApril 2024 Nostalgia Products Newsletter
April 2024 Nostalgia Products Newsletter
NathanBaughman3
 
Maksym Vyshnivetskyi: PMO Quality Management (UA)
Maksym Vyshnivetskyi: PMO Quality Management (UA)Maksym Vyshnivetskyi: PMO Quality Management (UA)
Maksym Vyshnivetskyi: PMO Quality Management (UA)
Lviv Startup Club
 
What is the TDS Return Filing Due Date for FY 2024-25.pdf
What is the TDS Return Filing Due Date for FY 2024-25.pdfWhat is the TDS Return Filing Due Date for FY 2024-25.pdf
What is the TDS Return Filing Due Date for FY 2024-25.pdf
seoforlegalpillers
 
5 Things You Need To Know Before Hiring a Videographer
5 Things You Need To Know Before Hiring a Videographer5 Things You Need To Know Before Hiring a Videographer
5 Things You Need To Know Before Hiring a Videographer
ofm712785
 
FINAL PRESENTATION.pptx12143241324134134
FINAL PRESENTATION.pptx12143241324134134FINAL PRESENTATION.pptx12143241324134134
FINAL PRESENTATION.pptx12143241324134134
LR1709MUSIC
 
Search Disrupted Google’s Leaked Documents Rock the SEO World.pdf
Search Disrupted Google’s Leaked Documents Rock the SEO World.pdfSearch Disrupted Google’s Leaked Documents Rock the SEO World.pdf
Search Disrupted Google’s Leaked Documents Rock the SEO World.pdf
Arihant Webtech Pvt. Ltd
 
20240425_ TJ Communications Credentials_compressed.pdf
20240425_ TJ Communications Credentials_compressed.pdf20240425_ TJ Communications Credentials_compressed.pdf
20240425_ TJ Communications Credentials_compressed.pdf
tjcomstrang
 
Improving profitability for small business
Improving profitability for small businessImproving profitability for small business
Improving profitability for small business
Ben Wann
 
Introduction to Amazon company 111111111111
Introduction to Amazon company 111111111111Introduction to Amazon company 111111111111
Introduction to Amazon company 111111111111
zoyaansari11365
 

Recently uploaded (20)

VAT Registration Outlined In UAE: Benefits and Requirements
VAT Registration Outlined In UAE: Benefits and RequirementsVAT Registration Outlined In UAE: Benefits and Requirements
VAT Registration Outlined In UAE: Benefits and Requirements
 
Project File Report BBA 6th semester.pdf
Project File Report BBA 6th semester.pdfProject File Report BBA 6th semester.pdf
Project File Report BBA 6th semester.pdf
 
ikea_woodgreen_petscharity_cat-alogue_digital.pdf
ikea_woodgreen_petscharity_cat-alogue_digital.pdfikea_woodgreen_petscharity_cat-alogue_digital.pdf
ikea_woodgreen_petscharity_cat-alogue_digital.pdf
 
Sustainability: Balancing the Environment, Equity & Economy
Sustainability: Balancing the Environment, Equity & EconomySustainability: Balancing the Environment, Equity & Economy
Sustainability: Balancing the Environment, Equity & Economy
 
Tata Group Dials Taiwan for Its Chipmaking Ambition in Gujarat’s Dholera
Tata Group Dials Taiwan for Its Chipmaking Ambition in Gujarat’s DholeraTata Group Dials Taiwan for Its Chipmaking Ambition in Gujarat’s Dholera
Tata Group Dials Taiwan for Its Chipmaking Ambition in Gujarat’s Dholera
 
Brand Analysis for an artist named Struan
Brand Analysis for an artist named StruanBrand Analysis for an artist named Struan
Brand Analysis for an artist named Struan
 
Unveiling the Secrets How Does Generative AI Work.pdf
Unveiling the Secrets How Does Generative AI Work.pdfUnveiling the Secrets How Does Generative AI Work.pdf
Unveiling the Secrets How Does Generative AI Work.pdf
 
Discover the innovative and creative projects that highlight my journey throu...
Discover the innovative and creative projects that highlight my journey throu...Discover the innovative and creative projects that highlight my journey throu...
Discover the innovative and creative projects that highlight my journey throu...
 
Business Valuation Principles for Entrepreneurs
Business Valuation Principles for EntrepreneursBusiness Valuation Principles for Entrepreneurs
Business Valuation Principles for Entrepreneurs
 
Putting the SPARK into Virtual Training.pptx
Putting the SPARK into Virtual Training.pptxPutting the SPARK into Virtual Training.pptx
Putting the SPARK into Virtual Training.pptx
 
ikea_woodgreen_petscharity_dog-alogue_digital.pdf
ikea_woodgreen_petscharity_dog-alogue_digital.pdfikea_woodgreen_petscharity_dog-alogue_digital.pdf
ikea_woodgreen_petscharity_dog-alogue_digital.pdf
 
April 2024 Nostalgia Products Newsletter
April 2024 Nostalgia Products NewsletterApril 2024 Nostalgia Products Newsletter
April 2024 Nostalgia Products Newsletter
 
Maksym Vyshnivetskyi: PMO Quality Management (UA)
Maksym Vyshnivetskyi: PMO Quality Management (UA)Maksym Vyshnivetskyi: PMO Quality Management (UA)
Maksym Vyshnivetskyi: PMO Quality Management (UA)
 
What is the TDS Return Filing Due Date for FY 2024-25.pdf
What is the TDS Return Filing Due Date for FY 2024-25.pdfWhat is the TDS Return Filing Due Date for FY 2024-25.pdf
What is the TDS Return Filing Due Date for FY 2024-25.pdf
 
5 Things You Need To Know Before Hiring a Videographer
5 Things You Need To Know Before Hiring a Videographer5 Things You Need To Know Before Hiring a Videographer
5 Things You Need To Know Before Hiring a Videographer
 
FINAL PRESENTATION.pptx12143241324134134
FINAL PRESENTATION.pptx12143241324134134FINAL PRESENTATION.pptx12143241324134134
FINAL PRESENTATION.pptx12143241324134134
 
Search Disrupted Google’s Leaked Documents Rock the SEO World.pdf
Search Disrupted Google’s Leaked Documents Rock the SEO World.pdfSearch Disrupted Google’s Leaked Documents Rock the SEO World.pdf
Search Disrupted Google’s Leaked Documents Rock the SEO World.pdf
 
20240425_ TJ Communications Credentials_compressed.pdf
20240425_ TJ Communications Credentials_compressed.pdf20240425_ TJ Communications Credentials_compressed.pdf
20240425_ TJ Communications Credentials_compressed.pdf
 
Improving profitability for small business
Improving profitability for small businessImproving profitability for small business
Improving profitability for small business
 
Introduction to Amazon company 111111111111
Introduction to Amazon company 111111111111Introduction to Amazon company 111111111111
Introduction to Amazon company 111111111111
 

Aircraft evaluation article

  • 1. 22 study Mohammed Salem Awad Research Scholar – Aviation Management Aircraft Evaluation & Selection U sually civil aircraft manufacture companies implementing the best optimum solutions for airlines, as they are try to convince these airlines by the preference of their products Relative direct operating cost 500nm average sector (aircrafts) namely Airbus Industries, Boeing Group, Embraer , and ATR. While the recent 30 fierce competitive between Airbus and Boeing to Fokker 100 98 capture a major market share in aviation industry. So consequently both parties recruit the best expertise in marketing and sales skilling techniques to secure transactions of millions 15 A319 dollars and any failures from any party means MD-95 124 losing these millions. And accordingly they Relative 106 A320 -200 use cost per trip and cost per seat matrix as cost per 150 an important tool for evaluating and selecting seat, % 737- 600 MD-88 A321 -200 1108 142 aircrafts, and to position their products in the 0 183 737- 700 -14% competitive market, so each one developed his 126 own analysis, that governs by the slogan “we -8% A321 -100 183 are the best in the airline industry” leading to an 737-800 contrary results for Airbus industries and Boeing ‫و‬ 162 Group as shown in figure (1), this encourage -15 us to wrap up and list the modern economic, scientific techniques for aircraft evaluation and selection. -15 -10 -5 0 5 10 15 20 25 30 35 40 45 The Problem Relative trip cost, % By studying cost per trip and cost per seat matrix for Airbus Industries and Boeing Group we get contrary matrixes, as each party insist by preference of their products (Aircrafts) in spite, the analysis address the Relative direct operating cost per seat 500nm average sector same stage length, for the same type of +20% aircrafts, but with a different assumption of the manufactures as shown in figures (1). 737-700 +10% A319 MD-83 MD-90 737-800 757-200 Datum A320 The technology gap -10% A321 -10% Datum +10% +20% +30% Relative direct operating cost per trip Figure (1) Cost per trip vs per seat Matrix For Boeing & Airbus CAMA Magazine | issue 15 | June, 2012
  • 2. study 23 Methods of Aircrafts Evolution and Selection U Curve Technique The main advantage of this approach is Actually cost per trip and cost per seat This is a mathematical model, where the to position the fleet of the company by matrix is a main important method for aircraft decision making is done based on the lowest defining the existing cost and configuration evaluation in the recent time but there are cost level, there curve is driven basically by two with the corresponding value of optimum many unmentioned methods that are not cost elements, the first one is cost of offering operating curve. As shown in figure (5). public yet, so basically the outcomes of service (cost of offering seat) while the second evaluation methods stand for what an analyst one is the cost of losing opportunity (cost of looking for to explore it for top management, losing revenue due to unavailability of seat) A321 some of these methods are listed below: where the right aircraft capacity can be define B737-800 • Value Analysis by the market size (passengers demand), Capacity (Seat) A320 • Cost per Trip and Cost per Seat Matrix applicable fare, and average stage length. • U Curve Technique The main characteristics of this analysis • Optimum Operating Curve is solving the dilemma of capacity or B737-700 A319 • Profit and Unutilized Market Share Matrix frequency as these two factors having a A318 great impact on operation of airlines, so by Value Analysis increasing the capacity of aircraft, we are It is one of a main statistical analysis in expected the reduction in frequencies and Cost per ATK aviation science, which addressing and reflect vice versa so the analysis can be define Figure (5) Optimum Operating Curve the technical parameters of the proposed the right capacity with optimum frequency aircraft with respect of its price according to in one shoot. As it is shown in figure (4). the relation of coefficient of correlation, so a Profit and Unutilized Market Share Matrix graphical analysis is constructed and a best The pre-mentioned methods (2, 3, and 4) are line of fit is established which divide the area applicable for point to point operating model into two parts, the upper one is attractive, while this method can be use for multi stops while the lower one is disappointment, operating model, the cost element is already and accordingly it is easy to compare and C Total Cost calculated with the profit and the market the select the best aircraft based on their size include with unutilized market share. Cost in US$ technical performance with respect the So these two main elements can position market price as it is shown in figure (2). B Cost this matrix to define the right aircraft and the of Lose A Cost of Services right sector to operate. As in shown (6). Opportunity Route: JED - SAH - DXB - CGK Attractive 0.3 Relative Values Selected Parameter 0.2 Relative Market Opportunity A310-300 Figure.(4). U Curve Technique 0.1 0.0 A330-200 Disappointment Optimum Operating Curve Airlines can be define by its own -1.2 -0.8 -0.4 0.4 0.8 1.2 main three parameters: -0.1 Aircraft Price First: Market Size -0.2 Figure (2) Value Analysis Second: Applicable Fares Third: Average Stage Length -0.3 B737-800 Cost per Trip and Cost per Seat Matrix: While the operating cost is used as step This is the classical method implementing by function with defined stages (0.1 to 1) and aircraft manufactures, and it is an approved Relative Profit accordingly we can define and develop an and public method that used widely, so it Figure (6) Decision Matrix - Right Aircraft optimum operating curve of the airline. is a tool for the aircraft manufactures to convince the airlines by the preference of their products, usually an expert team is assigned to collect, analysis data of the airlines in two financial cost elements first is Cost of Comparison of the Aircraft Evaluation Techniques Seat and the second is Cost per trip for the Table No. (1): Comparison of the Aircraft Evaluation Techniques design network, and they work it out so that it adapts and fits their benefits, this is clearly No. Methodology Implementing situation Mathematical Power of Model Analysis shown in figure (1) the contrary of Airbus Industries and Boeing Group, while the basic 1 Value analysis Studying technical specification Statistical Model XXX used of this method is shown in figure (3). 2 Cost per trip and cost per seat Matrix Point to point operating model Spread Sheet XXXX Solution 15% 3 U Curve Technique Point to point operating model Linear Program XXXXX RELATIVE UNIT COST (PER SEAT) 4 Optimum Operating Curve Point to point operating model Linear Program XXXXX Type X shortened 10% Decrease unattractive 5 Profit and Unutilized Market Share Matrix Multi-stops operating Model Linear Program XXXXX aircraft size area 5% Summary The study pointed out the importance of these techniques for Aircraft evaluation and selection. Also we don’t recommend to relay on what aircraft manufacture suggest, as 0% they are marketing their product to secure selling their aircraft, as by the end of the day, Type X Increase aircraft they are looking to secure the aircraft selling bids. So accordingly airlines should acts to size -5% evaluates their needs based on their demand and operating network to define the optimum operating curve, which reflects and consider as the thumb that define the airline, and its New Technology Type X shortened existing fleet, which positioning and evaluate the current fleet financially, also it is indicate -10% clearly the preference and importance of optimum operating curve and profit – unused -10% -5% 0% 5% 10% 15% 20% Source: Corporate Fleet Strategy and Aircraft Evaluation relative cost per trip market share matrix for evaluation and selection of aircrafts.■ Figure (3) Cost per Trip and Cost per Seat Matrix CAMA Magazine | issue 15 | June, 2012
  • 3. Aircraft Evaluation & Selection Socotra Lovers Destination Airports Forecasting Civil Aviation & Meteorology Authority (Yemen) April - June 2012, issue 15 Emirates United Arab Aviation Empire Invading the Sky www.camamagazine.com