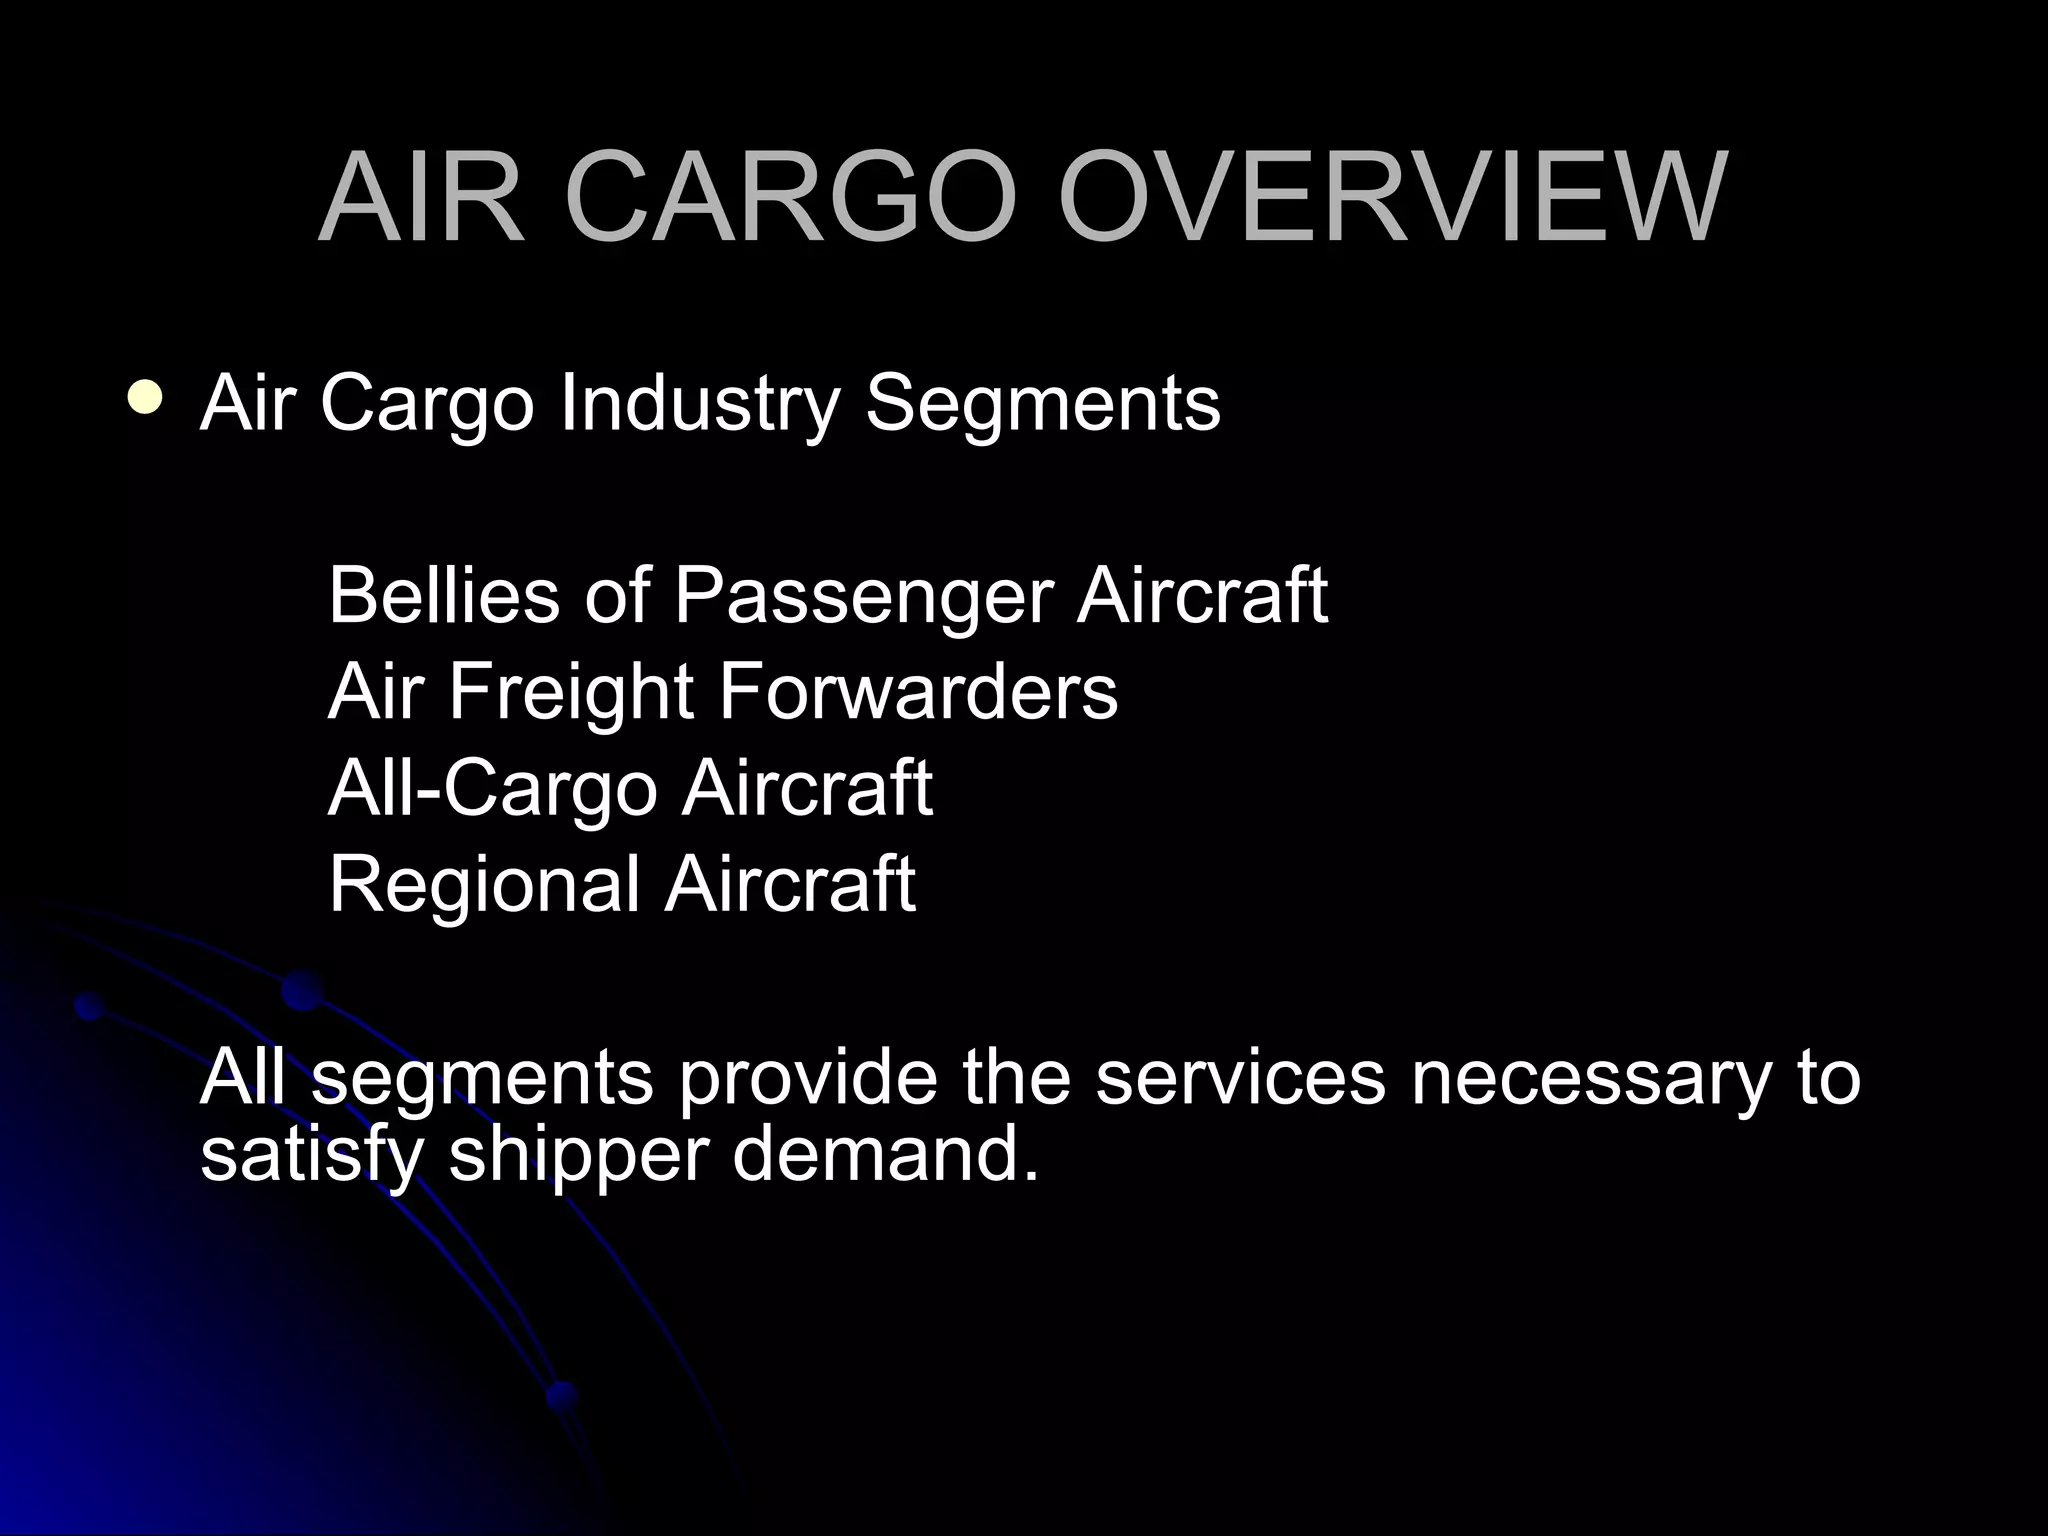
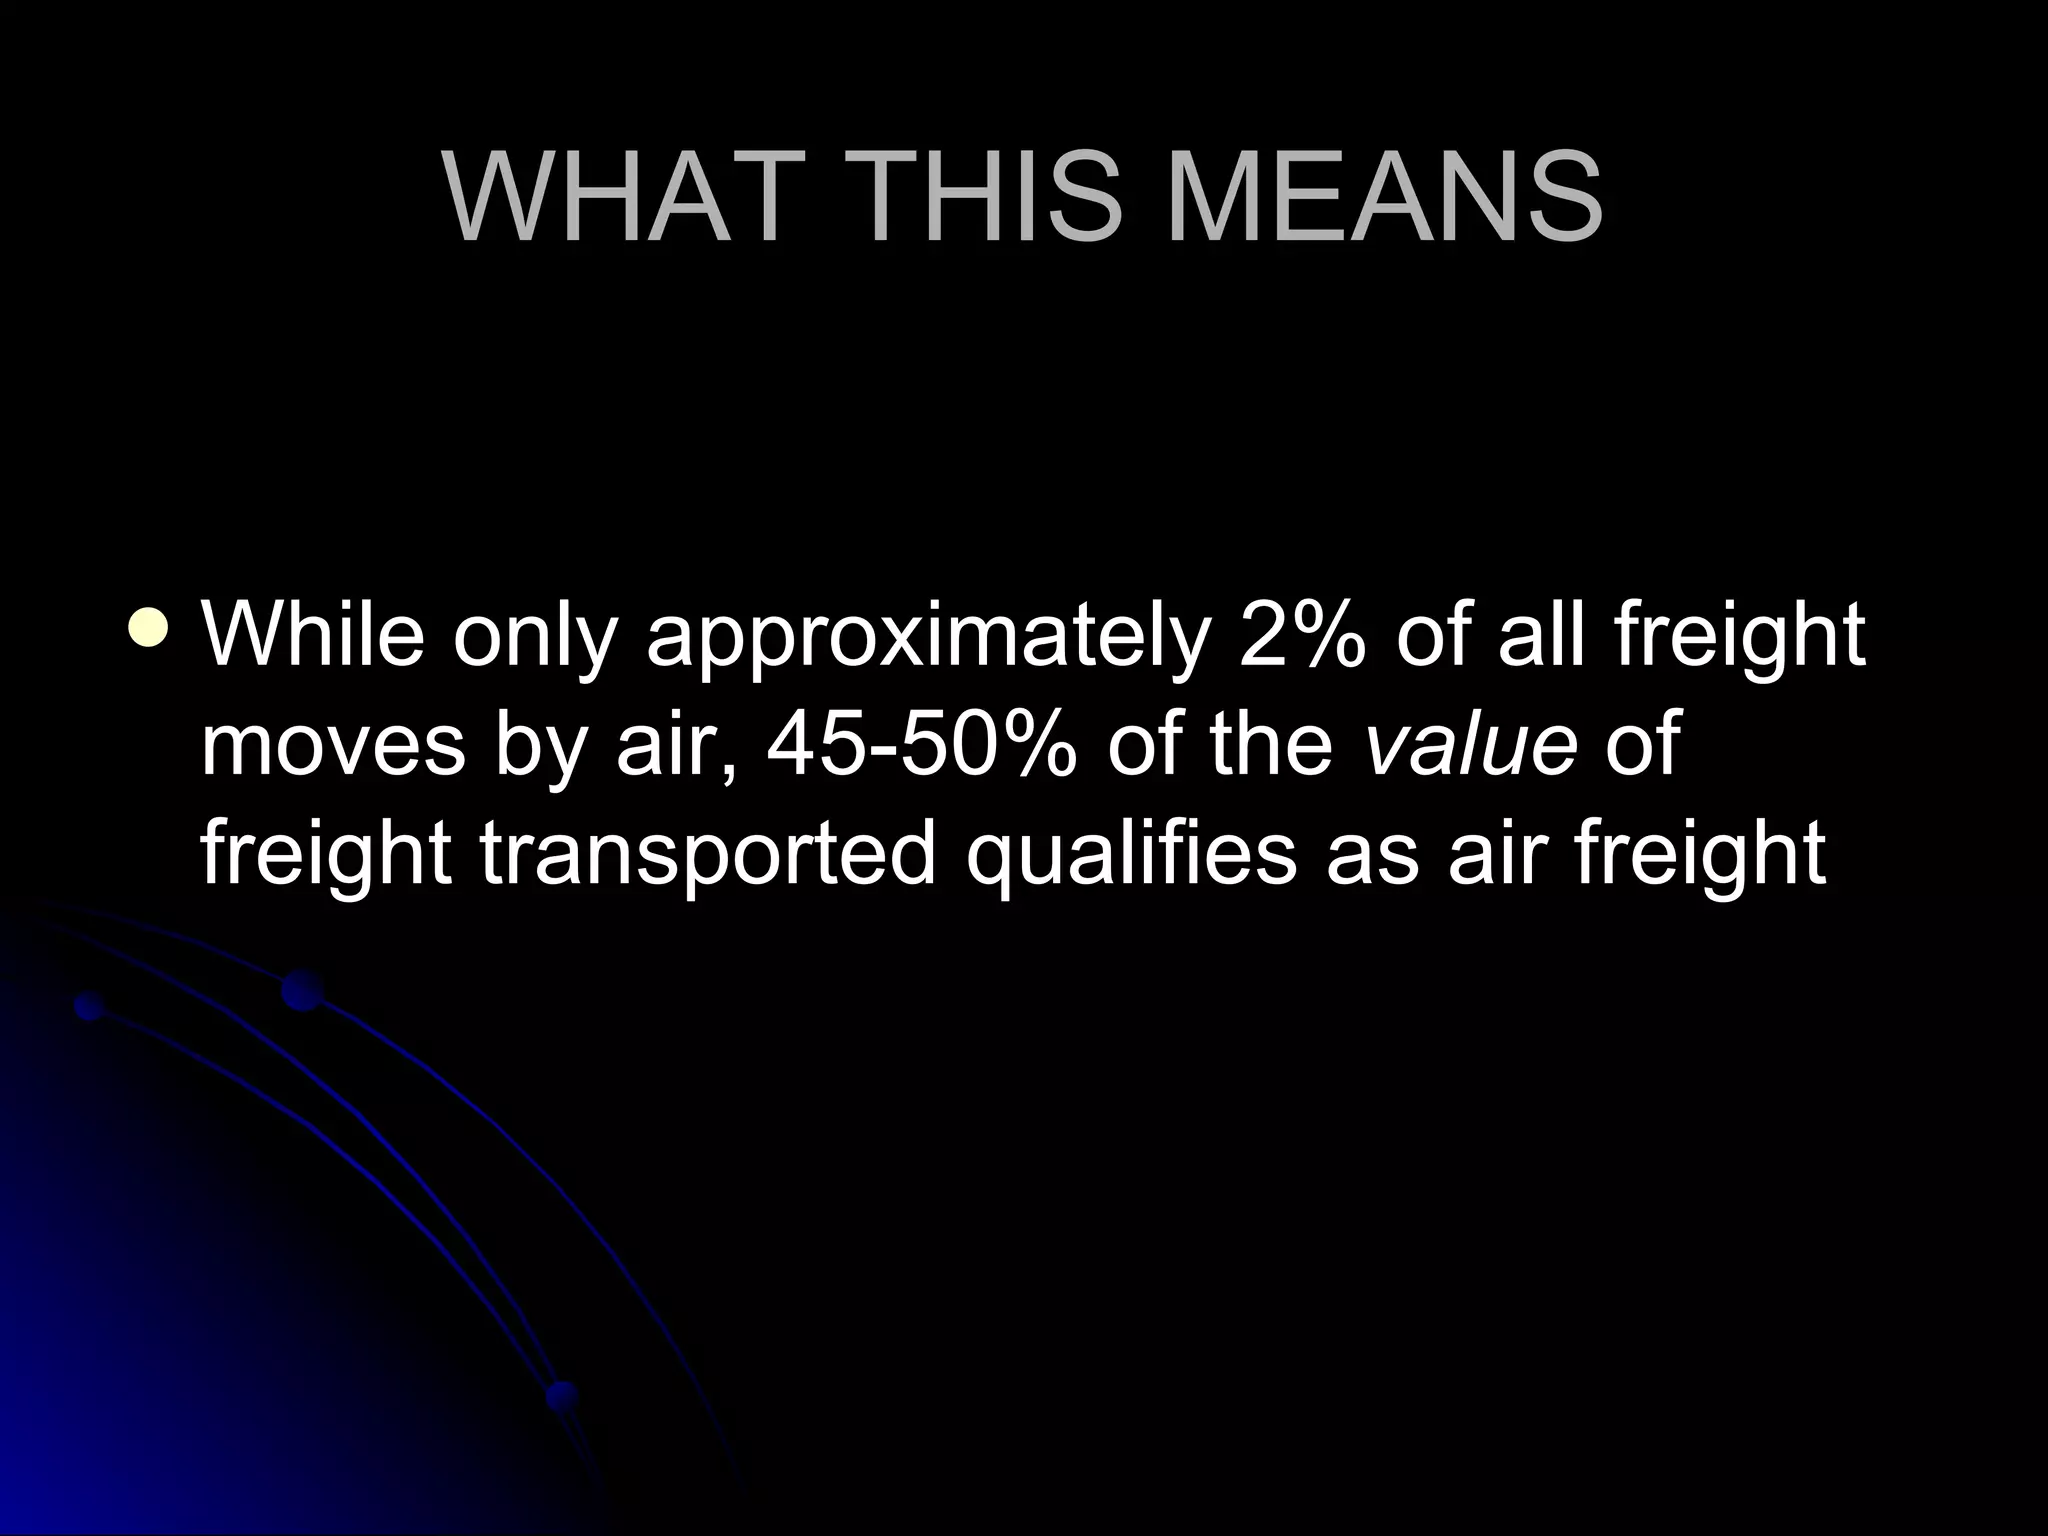
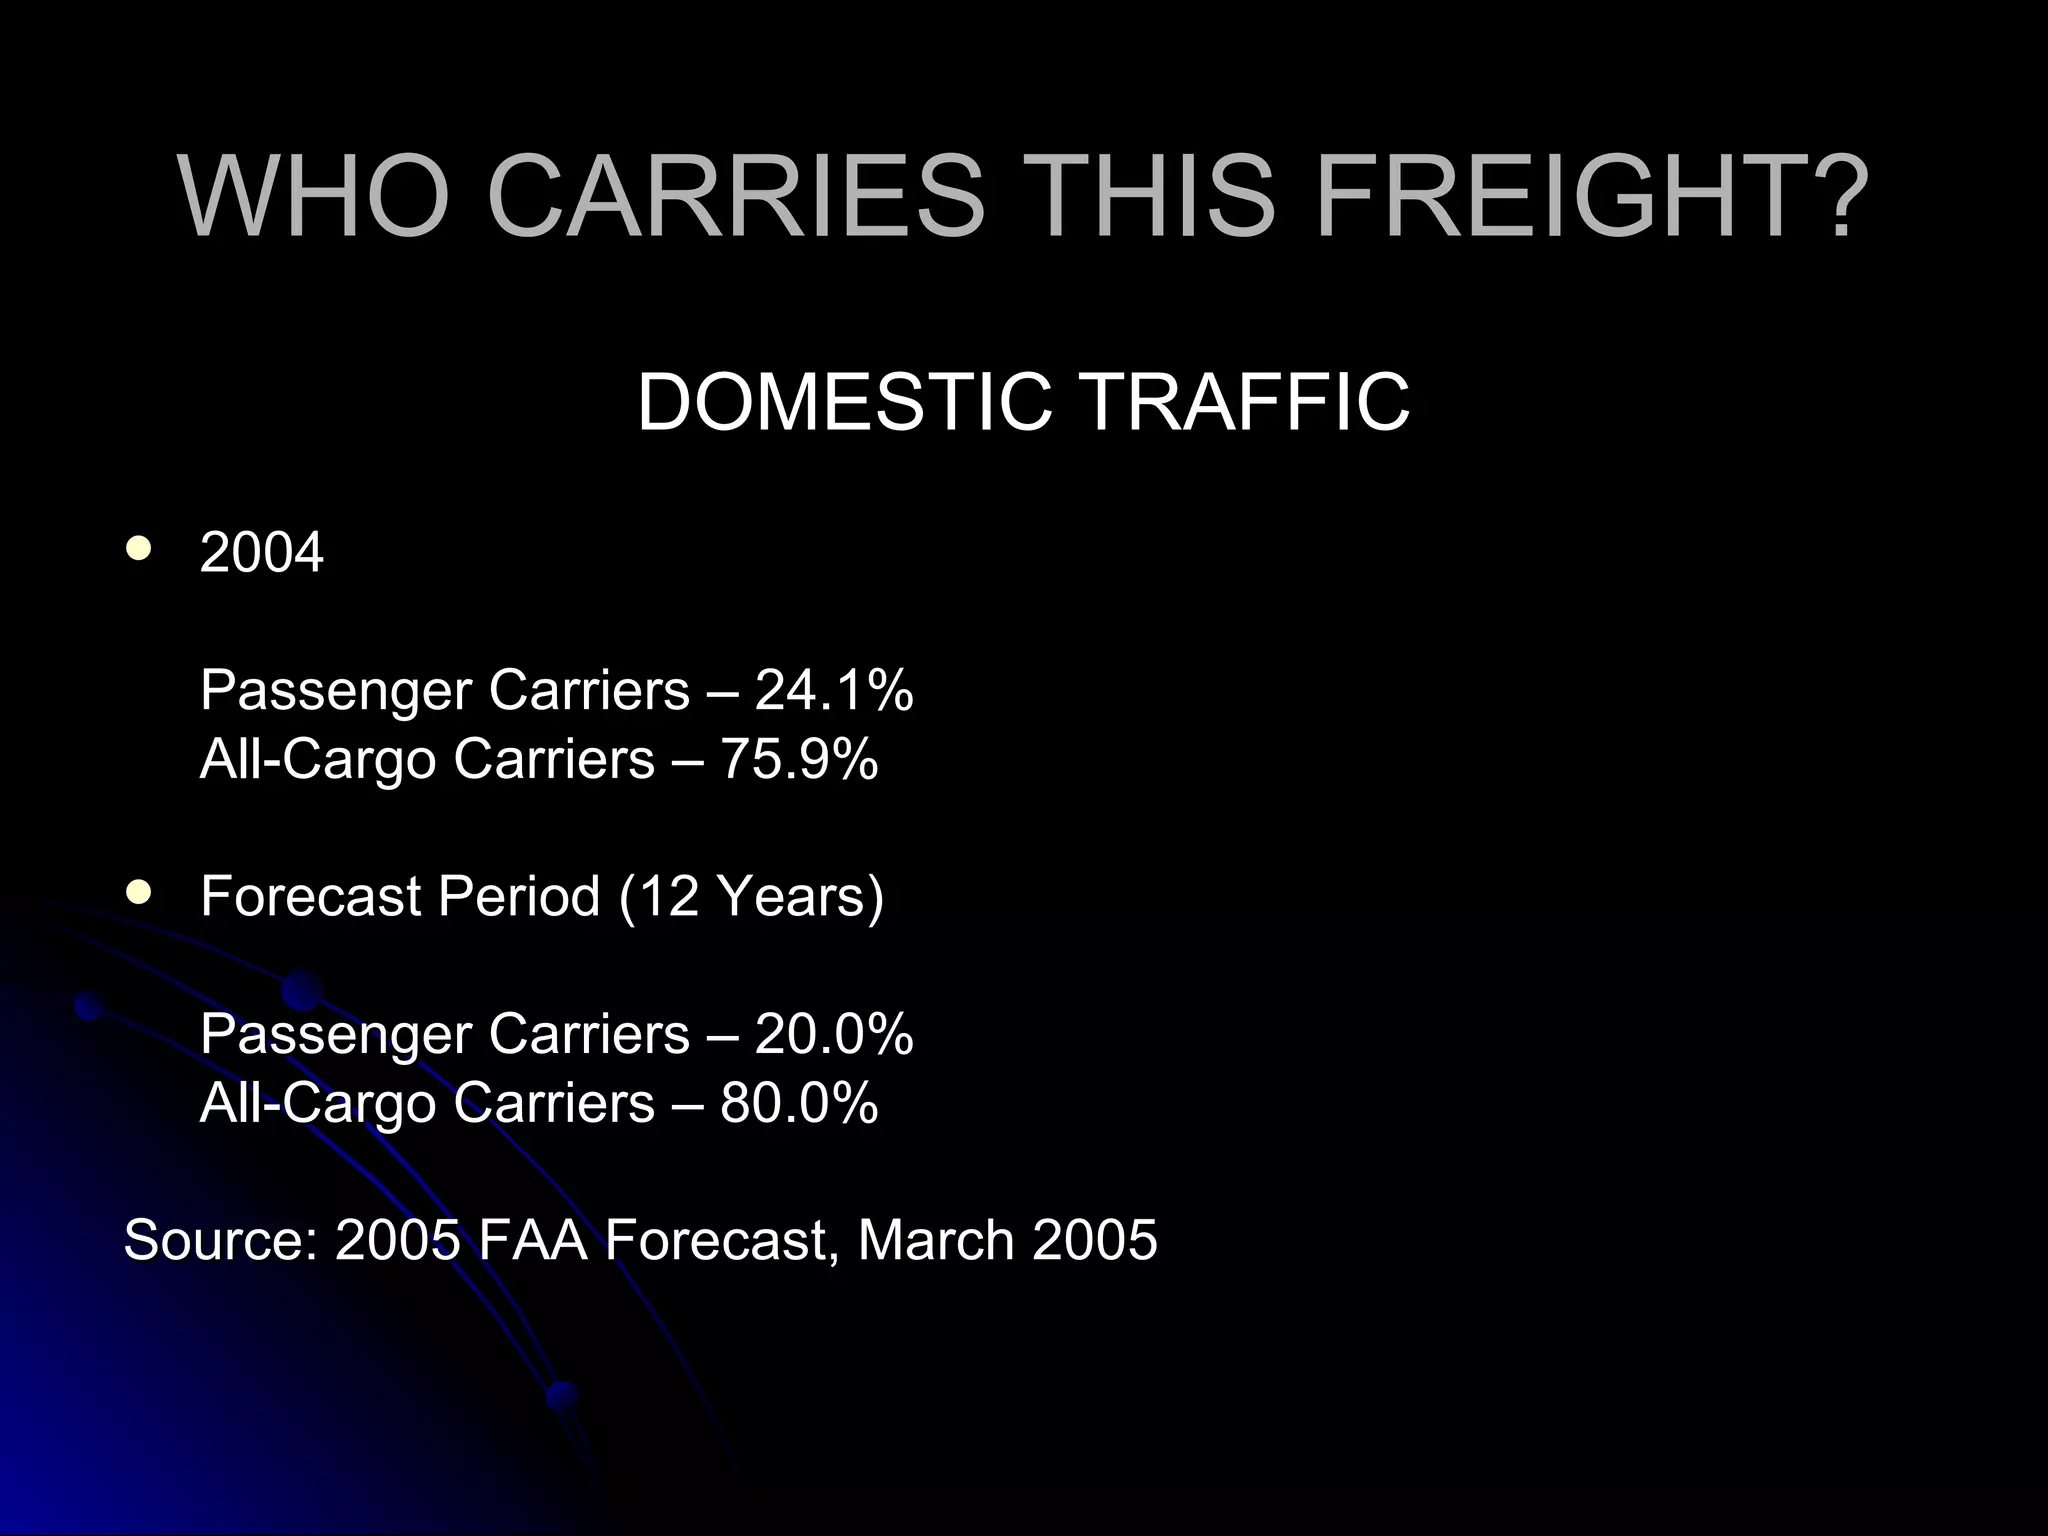
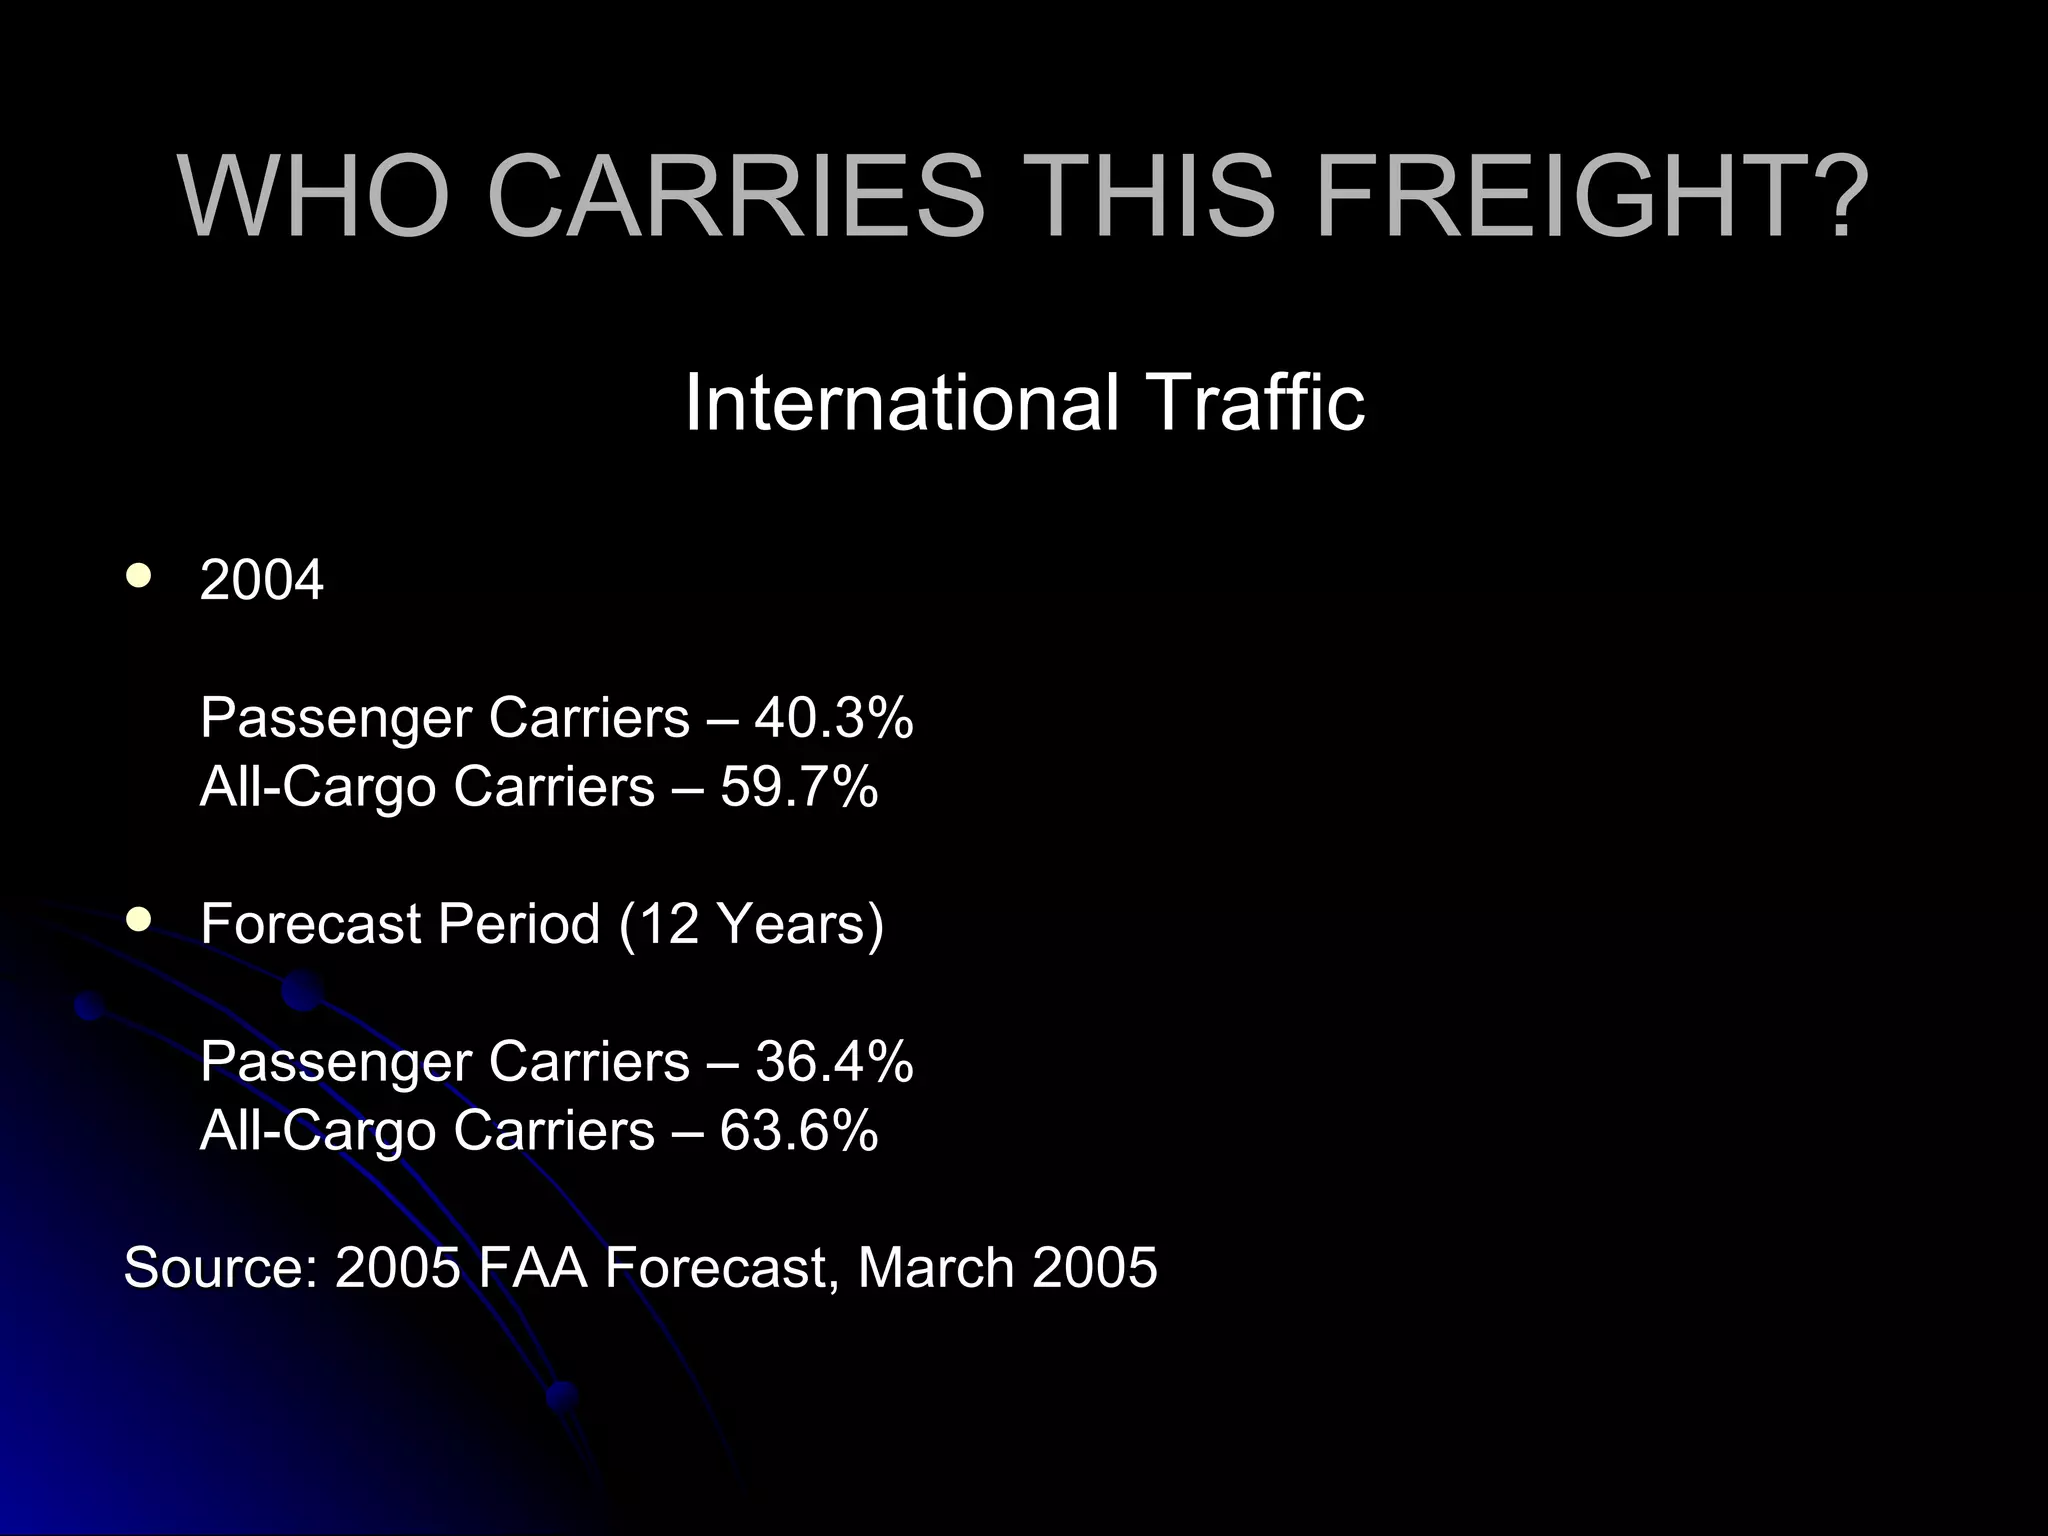
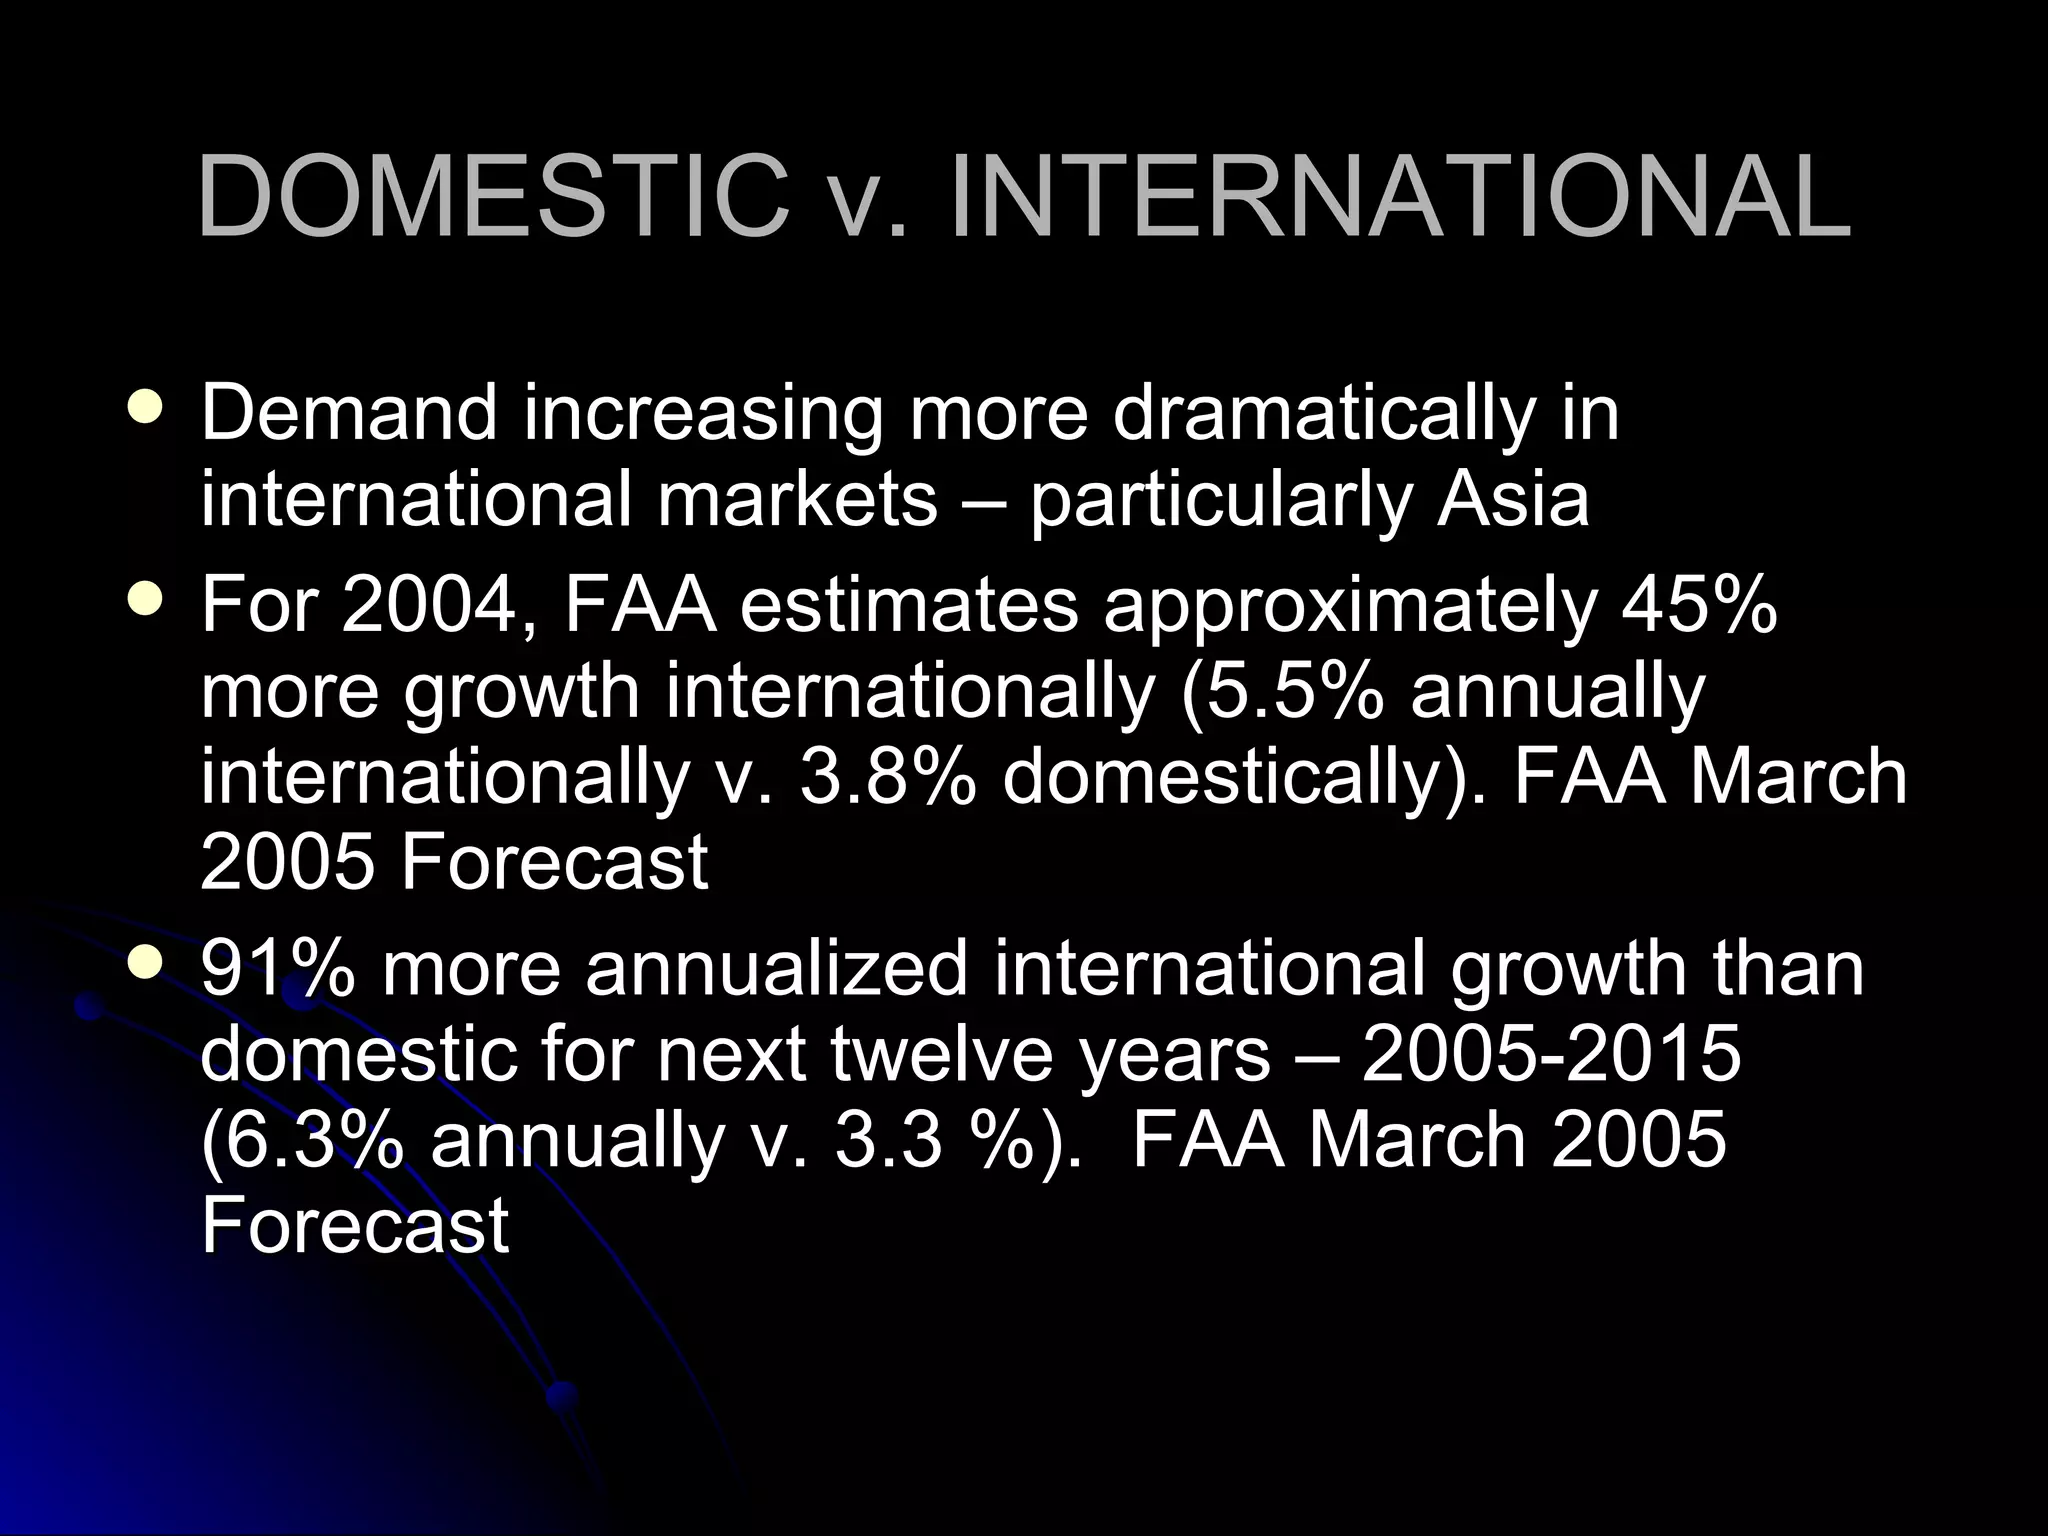
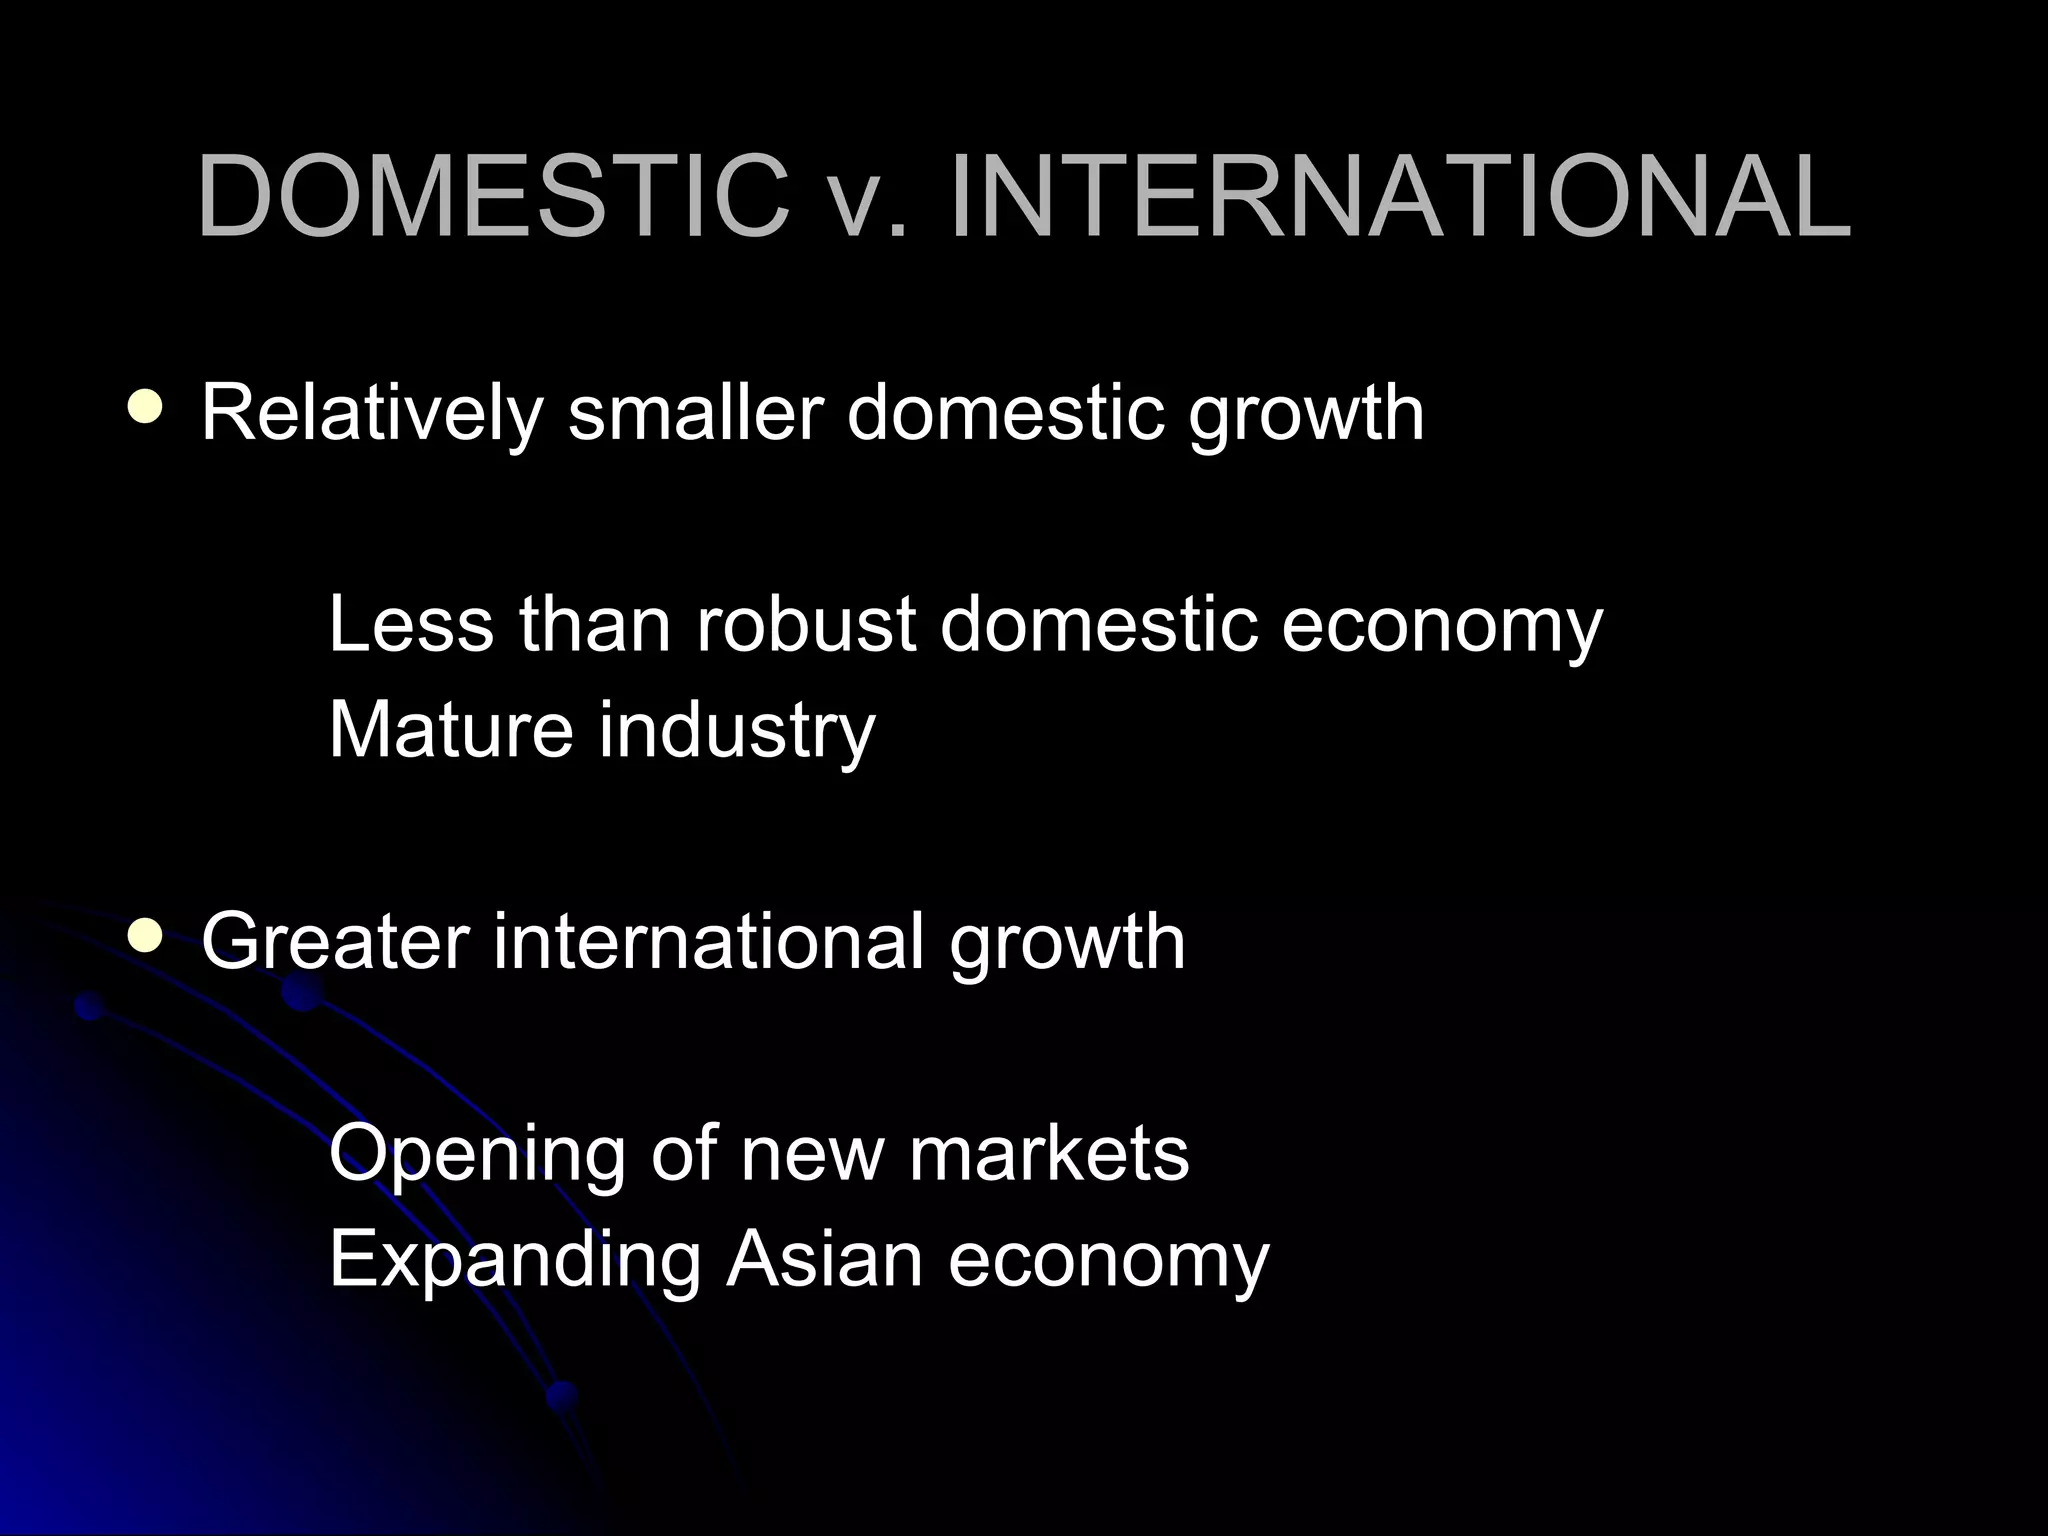
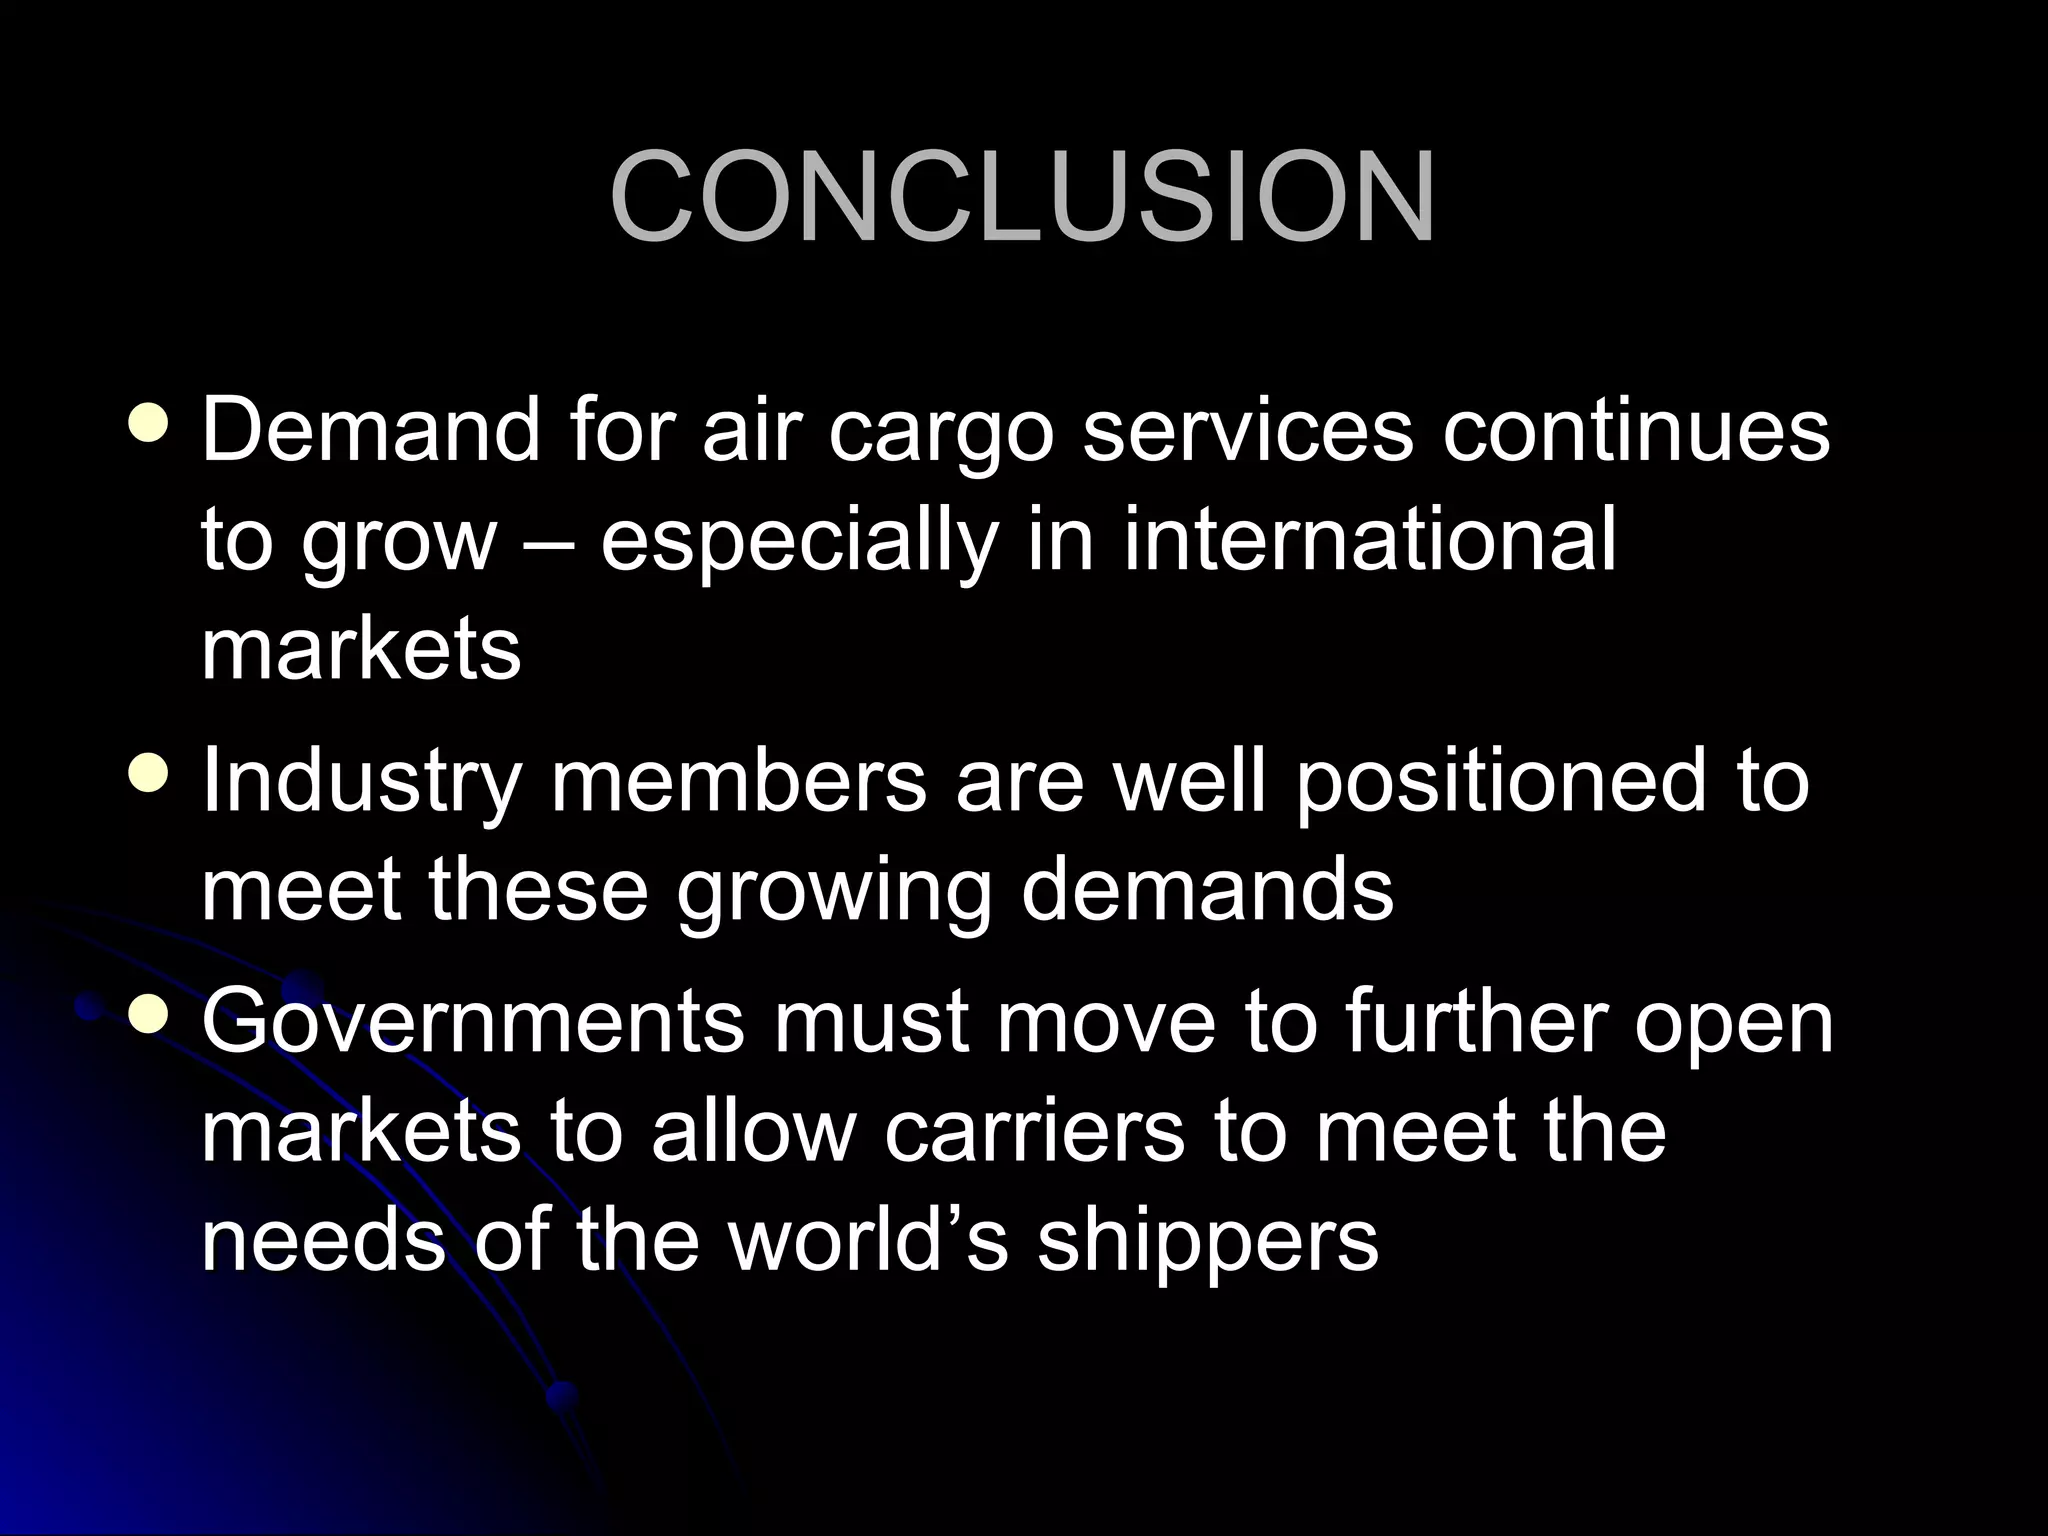
FEDERAL AVIATION ADMINISTRATION Annual Forecast Conference Washington, D.C. March 18, 2005
AIR CARGO DEMAND: An Overview Stephen A. Alterman President Cargo Airline Association Washington, D.C.
CARGO AIRLINE ASSOCIATION AIR CARRIER MEMBERSHIP Board of Directors ABX Air, Inc. Atlas Air Federal Express UPS Members Air Transport International Capital Cargo International CNF, Inc.  DHL Express First Air Gemini Kalitta Air Kitty Hawk USA Jet
AIR CARGO OVERVIEW Air Cargo Industry Segments Bellies of Passenger Aircraft Air Freight Forwarders All-Cargo Aircraft Regional Aircraft All segments provide the services necessary to satisfy shipper demand.
DEMAND DRIVERS Time Definite Service (Reliability) Speed Traceability Probably NOT Price
DEMAND LIMITATIONS Uncertain Economic Picture Security Concerns Escalating Fuel Prices  Necessary Fuel Surcharges Price Competition from Other Modes
HIGH VALUE COMMODITIES ARE TRADITIONALLY TRANSPORTED BY AIR High-tech electronics Human organs Important documents
WHAT THIS MEANS While only approximately 2% of all freight moves by air, 45-50% of the  value  of freight transported qualifies as air freight
WHO CARRIES THIS FREIGHT? DOMESTIC TRAFFIC 2004 Passenger Carriers – 24.1% All-Cargo Carriers – 75.9% Forecast Period (12 Years) Passenger Carriers – 20.0% All-Cargo Carriers – 80.0% Source: 2005 FAA Forecast, March 2005
WHO CARRIES THIS FREIGHT? International Traffic 2004 Passenger Carriers – 40.3% All-Cargo Carriers – 59.7% Forecast Period (12 Years) Passenger Carriers – 36.4% All-Cargo Carriers – 63.6% Source: 2005 FAA Forecast, March 2005
DOMESTIC v. INTERNATIONAL Demand increasing more dramatically in international markets – particularly Asia For 2004, FAA estimates approximately 45% more growth internationally (5.5% annually internationally v. 3.8% domestically). FAA March 2005 Forecast 91% more annualized international growth than domestic for next twelve years – 2005-2015 (6.3% annually v. 3.3 %).  FAA March 2005 Forecast
DOMESTIC v. INTERNATIONAL Relatively smaller domestic growth Less than robust domestic economy Mature industry Greater international growth Opening of new markets Expanding Asian economy
CONCLUSION Demand for air cargo services continues to grow – especially in international markets Industry members are well positioned to meet these growing demands Governments must move to further open markets to allow carriers to meet the needs of the world’s shippers

Air cargo demand an overview - steve alterman

  • 1.
    FEDERAL AVIATION ADMINISTRATIONAnnual Forecast Conference Washington, D.C. March 18, 2005
  • 2.
    AIR CARGO DEMAND:An Overview Stephen A. Alterman President Cargo Airline Association Washington, D.C.
  • 3.
    CARGO AIRLINE ASSOCIATIONAIR CARRIER MEMBERSHIP Board of Directors ABX Air, Inc. Atlas Air Federal Express UPS Members Air Transport International Capital Cargo International CNF, Inc. DHL Express First Air Gemini Kalitta Air Kitty Hawk USA Jet
  • 4.
    AIR CARGO OVERVIEWAir Cargo Industry Segments Bellies of Passenger Aircraft Air Freight Forwarders All-Cargo Aircraft Regional Aircraft All segments provide the services necessary to satisfy shipper demand.
  • 5.
    DEMAND DRIVERS TimeDefinite Service (Reliability) Speed Traceability Probably NOT Price
  • 6.
    DEMAND LIMITATIONS UncertainEconomic Picture Security Concerns Escalating Fuel Prices Necessary Fuel Surcharges Price Competition from Other Modes
  • 7.
    HIGH VALUE COMMODITIESARE TRADITIONALLY TRANSPORTED BY AIR High-tech electronics Human organs Important documents
  • 8.
    WHAT THIS MEANSWhile only approximately 2% of all freight moves by air, 45-50% of the value of freight transported qualifies as air freight
  • 9.
    WHO CARRIES THISFREIGHT? DOMESTIC TRAFFIC 2004 Passenger Carriers – 24.1% All-Cargo Carriers – 75.9% Forecast Period (12 Years) Passenger Carriers – 20.0% All-Cargo Carriers – 80.0% Source: 2005 FAA Forecast, March 2005
  • 10.
    WHO CARRIES THISFREIGHT? International Traffic 2004 Passenger Carriers – 40.3% All-Cargo Carriers – 59.7% Forecast Period (12 Years) Passenger Carriers – 36.4% All-Cargo Carriers – 63.6% Source: 2005 FAA Forecast, March 2005
  • 11.
    DOMESTIC v. INTERNATIONALDemand increasing more dramatically in international markets – particularly Asia For 2004, FAA estimates approximately 45% more growth internationally (5.5% annually internationally v. 3.8% domestically). FAA March 2005 Forecast 91% more annualized international growth than domestic for next twelve years – 2005-2015 (6.3% annually v. 3.3 %). FAA March 2005 Forecast
  • 12.
    DOMESTIC v. INTERNATIONALRelatively smaller domestic growth Less than robust domestic economy Mature industry Greater international growth Opening of new markets Expanding Asian economy
  • 13.
    CONCLUSION Demand forair cargo services continues to grow – especially in international markets Industry members are well positioned to meet these growing demands Governments must move to further open markets to allow carriers to meet the needs of the world’s shippers