Peter, an electrician, used Agilent handheld meters and Bluetooth adapters as a wireless data logging system to troubleshoot a customer's high electricity bill. He monitored the farm's electrical loads over 1.5 hours and spotted an intermittent load that was running every 4 minutes. This led to discovering a broken water pipe causing the pump to run constantly, significantly increasing usage. The data logging system allowed Peter to non-invasively monitor and graph electrical usage over time to identify the source of the problem.
Day by day the scope & use of the electronics concepts in bio-medical field is going to increase step by step. Electrocardiogram (ECG) is basically a non-invasive way of measuring the electrical activity of the heart by registering the extracellular potentials generated by it. The ECG signal consists of low amplitude voltage in the presence of high amplitude offset. A power-efficient ECG acquisition system uses a fully digital architecture helps to reduce the power consumption and delay time. Instead of analog block, they convert the input voltage into a digital code by delay lines and are mainly built on digital blocks This digital architecture is capable of operating with a low supply voltage of 0.5 V. The circuit implemented in 90nm CMOS technology. The simulation results show that the DCC circuit of digital architecture consumes 0.42nW of power.
Design of an IOT based Online Monitoring Digital StethoscopeIJAAS Team
Acoustic stethoscopes have low sound levels. Digital stethoscope overcomes this issue by amplifying body sounds electronically. As the sound signals are transmitted electronically, it can be wireless and can provide noise reduction. Acoustic stethoscope can be changed into a digital stethoscope by inserting an electric capacity microphone onto its head. Heart sounds received from the microphone are processed, sampled and sound signals are converted analog to digital and sent wirelessly using the Internet of Things(IOT) techniques, so that multiple doctors can do auscultation and monitor conditions of the patient.
Real Time Monitoring and Electro Magnetic Interference causing Data corruptionRekaNext Capital
On site, where there are motors and generators, the sensor reading are affected by Electro-Magnetic Interference. The presentation shares some Good Engineering Practices to minimize Data Corruption. Real Time Monitoring Data Quality is even more sensitive to Data Corruption as there is a huge amount of sensors per hour.
Residential load event detection in NILM using robust cepstrum smoothing base...IJECEIAES
Event detection has an important role in detecting the switching of the state of the appliance in the residential environment. This paper proposed a robust smoothing method for cepstrum estimation using double smoothing i.e. the cepstrum smoothing and local linear regression method. The main problem is to reduce the variance of the home appliance peak signal. In the first step, the cepstrum smoothing method removed the unnecessary quefrency by applying a rectangular window to the cepstrum of the current signal. In the next step, the local regression smoothing weighted data points to be smoothed using robust least squares regression. The result of this research shows the variance of the peak signal is decreased and has a good performance with better accuracy. In noise enviromment, performance prediction quite good with values greater than 0.6 and relatively stable at values above 0.9 on SNR> 25 for single appliances. Furthermore, in multiple appliances, performance prediction quite good at SNR> 20 and begins to decrease in SNR <20 and SNR> 25.
DESIGN AND IMPLEMENTATION OF A WIRELESS SENSOR AND ACTUATOR NETWORK FOR ENERG...ijesajournal
This paper describes the design, implementation, and testing of a wireless sensor and actuator network for monitoring the energy use of electric appliances in a home environment. The network includes energy measurement nodes and a central server, where the nodes read the energy use of connected appliance, and wirelessly report their readings to the central server for processing. The server displays the readings from
these nodes via a user visual interface in real time. Through this system, users can easily understand their electricity usage patterns and adapt their behaviour to reduce their energy consumption and costs. Moreover, users are able to remotely power on/off individual devices to actively control the power use of certain appliances. The system allows for inexpensive monitoring of home energy use and illustrates a practical way to control the energy consumption through user interaction.
In our country we are facing tremendous problems because of electricity shortage and the J&K state is on top. We are considered rich in production of electricity but the truth is we are not getting the desired. The solution is implementation of latest and emerging technologies like IOT and Microcontrollers in electrical domain. The paper describes the need of technology for load shedding process. Itika Sharma | Shavet Sharma"Load Shedding Management" Published in International Journal of Trend in Scientific Research and Development (ijtsrd), ISSN: 2456-6470, Volume-2 | Issue-5 , August 2018, URL: http://www.ijtsrd.com/papers/ijtsrd18364.pdf http://www.ijtsrd.com/engineering/electrical-engineering/18364/load-shedding-management/itika-sharma
Design and Implementation of Wireless Sensor Node for WSN for Automatic Meter...paperpublications3
Abstract:Deploying an embedded technology, a wireless sensor node is designed and implemented for establishment of Wireless Sensor Network (WSN) for automatic meter reading. The amount of power consumed by the load is extracted by passing the respective current through 1Ohm resistor. The analog voltage observed across it is digitized by employing on chip ADC of AVR Atmega 8L microcontroller. The ADC of 10 bit resolution helps to enhance preciseness in the data. Using principle of energy meter, the power consumed is determined and depicted in the terms of watts and units as well. An embedded firmware is developed by employing CodeVisionAVR, the IDE, which is dedicated for AVR family of microcontrollers. Employing an ubiquitous technology, the Zigbee technology, RF communication is established at 2.4GHz of ISM band. The Zigbee RF module is interfaced to the system and programmed by using X-CTU. Each node (End Devices) is assigned with its own ID and disseminates the data to the co-ordinator node, which is interfaced to the base station. The present wireless sensor network is operating in star technology and following IEEE 802.15.4 standards, it is operating with great reliability. The WSN is suitable for electric power distribution and control boards.
Keyword:Automatic Meter Reading, AVR Microcontroller, Embedded technology, IEEE802.15.4, WSN, Zigbee technology.
IoT Based Water Level Monitoring System with an Android Applicationrahulmonikasharma
The principle objective of our assignment is to display the water level as well as controlling with IoT and android application. Wastage of water within the modern state of affairs, merely because of overflowing tanks isn't less expensive. Conventional water tanks can neither reveal nor manage the water stage in tank, main to huge amount of wastage. A few different technologies had sure drawbacks in a few or the alternative way. The want of removal of those quick-comings and offering an efficient and competitively priced solution has been the principle focus of this assignment. The IoT platform we are using is Arduino which is an open source. The water level within the water tank is split into most, minimal and nominal degrees indicated by using exclusive colorings for each. An ultrasonic sensor is positioned on the floor of the tank to sense the water stage and the distance is dispatched to the android utility through Arduino. We can display the tank manually using an on/off button provided within the android utility. The android application is a user interface which displays the tank format, a button for guide operation and a led for indicating the motor popularity.
Scada Based Remote Monitoring and Data Acquisition for Energy ManagementPremier Publishers
Nowadays in the power system, conservation of power plays an important role. In this work, it proposed to develop a system for monitoring and accessing the performance of remotely situated devices. For which data acquisition (SCADA) and PLC techniques to monitor and controlling the energy consumption for the entire EEE block SKIT College. The energy consumption details for the same is carried through simulation for the entire block and hardware implementation is carried out for a laboratory and real-time data is traced out. The data so obtained gives clear picture of energy consumption, which can be further used to conserve energy.
Keys toSuccess: Business Intelligence Proven, Practical Strategies That WorkSenturus
Keys you need to know to achieve BI success. View the webinar video recording and download this deck: http://www.senturus.com/resources/keys-to-success-in-business-intelligence/.
With realistic advice taken from Senturus CEO and co-founder John Peterson, he shares 16+ years of real world expertise working with over 1000 clients and 2000 projects to describe how you can truly optimize BI investments.
Senturus, a business analytics consulting firm, has a resource library with hundreds of free recorded webinars, trainings, demos and unbiased product reviews. Take a look and share them with your colleagues and friends: http://www.senturus.com/resources/.
Upgradeable Fully Featured Power and Energy Meter - PDFElectro Industries
All rights reserved. No part of this publication may be reproduced or transmitted in
any form or by any means, electronic or mechanical, including photocopying, recording,
or information storage or retrieval systems or any future forms of duplication,
for any purpose other than the purchaser's use, without the expressed written
permission of Electro Industries/GaugeTech.
Here my project theme is to monitor and control Transformer health using Arduino, as we all know there are both internal and external faults occur in the transformer, for internal faults we use Buchholz relay and Differential protection relay for external but it is not efficient with time. so,we use Arduino for real time protection, here we fix some values to the Arduino in the program itself according to the rating of the transformer by that we monitor and control whenever the faults occur
Power distribution system fault monitoring device for supply networks in NigeriaIJECEIAES
Electric power is the bedrock of our modern way of life. In Nigeria, power supply availability, sufficiency and reliability are major operational challenges. At the generation and transmission level, effort is made to ensure status monitoring and fault detection on the power network, but at the distribution level, particularly within domestic consumer communities there are no fault monitoring and detection devices except for HRC fuses at the feeder pillar. Unfortunately, these fuses are sometimes replaced by a copper wire bridge at some locations rendering the system unprotected and creating a great potential for transformer destruction on overload. This study is focused on designing an on-site power system monitoring device to be deployed on selected household entry power cables for detecting and indicating when phase off, low voltage, high voltage, over current, and blown fuse occurs on the building’s incomer line. The fault indication will help in reducing troubleshooting time and also ensure quick service restoration. After design implementation, the test result confirms design accuracy, device functionality and suitability as a low-cost solution to power supply system fault monitoring within local communities.
DETECTING POWER GRID SYNCHRONISATION FAILURE ON SENSING BAD VOLTAGE OR FREQUE...Pradeep Avanigadda
The project is designed to develop a system to detect the synchronization failure of any external supply source to the power grid on sensing the abnormalities in frequency and voltage.
There are several power generation units connected to the grid such as hydel, thermal, solar etc to supply power to the load. These generating units need to supply power according to the rules of the grid. These rules involve maintaining a voltage variation within limits and also the frequency. If any deviation from the acceptable limit of the grid it is mandatory that the same feeder should automatically get disconnected from the grid which by effect is termed as islanding. This prevents in large scale brown out or black out of the grid power. So it is preferable to have a system which can warn the grid in advance so that alternate arrangements are kept on standby to avoid complete grid failure.
Agilent turn your agilent handheld meter into a data logger case study_5991-2084_en
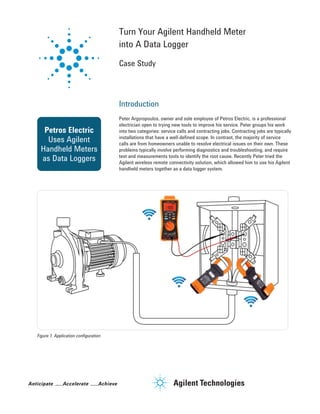
1. Turn Your Agilent Handheld Meter
into A Data Logger
Case Study
Introduction
Peter Argyropoulos, owner and sole employee of Petros Electric, is a professional
electrician open to trying new tools to improve his service. Peter groups his work
Petros Electric into two categories: service calls and contracting jobs. Contracting jobs are typically
Uses Agilent installations that have a well-defined scope. In contrast, the majority of service
calls are from homeowners unable to resolve electrical issues on their own. These
Handheld Meters problems typically involve performing diagnostics and troubleshooting, and require
as Data Loggers test and measurements tools to identify the root cause. Recently Peter tried the
Agilent wireless remote connectivity solution, which allowed him to use his Agilent
handheld meters together as a data logger system.
Figure 1. Application configuration
2. Problem Solution
One of Petros Electric’s customers To initiate troubleshooting Peter needed After monitoring the main service
owns a small farm. This customer was to monitor the farm’s power loads feeders for about 1.5 hours, Peter was
concerned about his extremely high over a period of time. Without a data able to spot a large, intermittent load.
electricity bill, which covered a 30-day logger, this troubleshooting task would The graph (similar to the one shown in
billing period during the winter months. be difficult however he used Agilent’s Figure 2) showed that something was
Even though his usage habits had not newly-introduced wireless remote running approximately 1 minute and
changed over that duration, he was connectivity solution. The configuration 20 seconds every four minutes. It was
charged for significantly higher usage. used one Agilent U1272A handheld now possible to narrow the problem
Like many small farms, his was not an multimeter and two U1212A clamp down to the water pump, which lead to
energy intensive operation. Most of the meters, each equipped with Agilent the discovery of a broken underground
electricity was used in the main house U1177A Bluetooth® adapters. The water pipe in an outbuilding. Under
and a small bungalow for typical loads, solution also included an android tablet normal conditions, the pump would
like lighting, cooking, HVAC, and hot or phone loaded with a free Agilent only run when someone was using the
water. Without any idea why power con- Mobile Logger application. water. The constantly running water
sumption had changed so drastically, he pump had played the major role in the
called Petros to isolate the problem. Using the two clamp meters, he was farm owner’s high electricity bill along
able to monitor the current on the two with a number of other small loads
“hot” wires of the service as show in like a space heater used that winter
Figure 1. The Agilent U1272A multime- and a water bed heater, both of which
ter was used to measure the voltage showed up on graph as constant, low
between the two “hot” wires. level loads.
Figure 2. Voltage, current, and power trend logging with Agilent Mobile Logger app
2