Downloaded 822 times
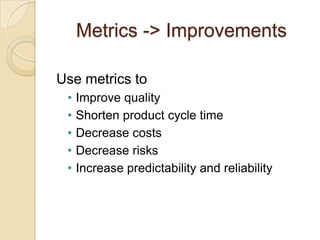
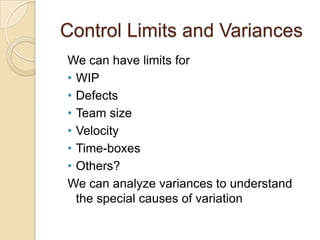
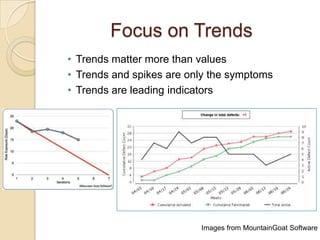
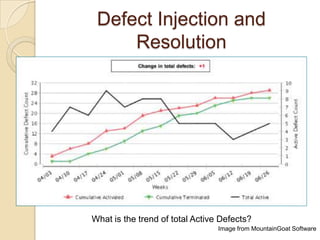
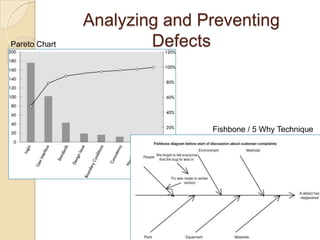
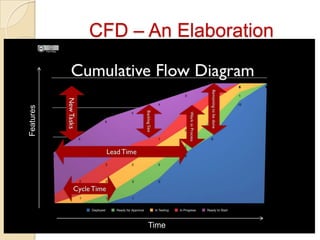
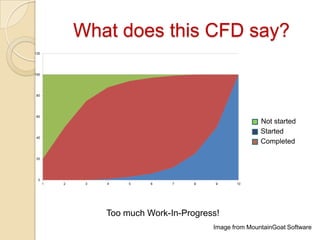
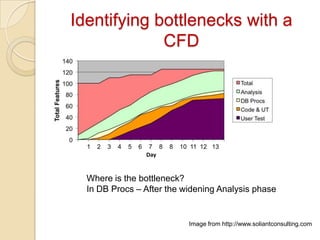
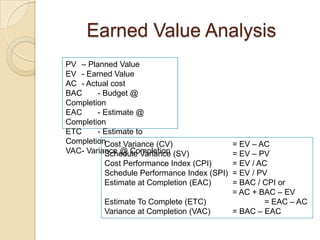
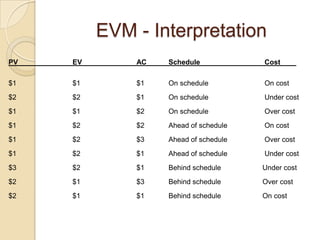
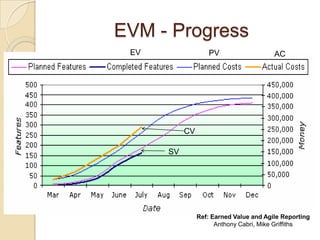


The document discusses various agile metrics that can be used to improve quality, shorten product cycle times, decrease costs and risks, and increase predictability. It describes metrics like defects trends, test automation coverage, flow diagrams to measure lead and cycle times, earned value analysis to track costs and wastage. Control limits and variances can be set for work in progress, defects, team size and velocity. The focus should be on analyzing trends rather than individual values to identify special causes of variation and lead indicators.


