Downloaded 555 times

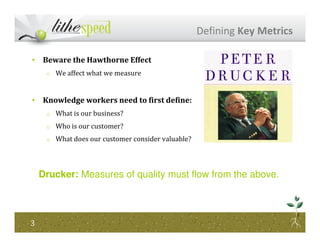
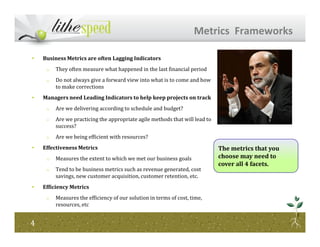
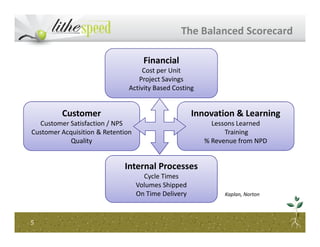
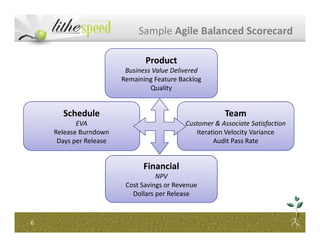
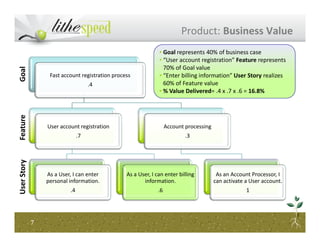
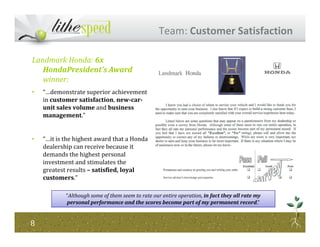
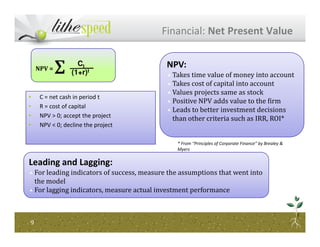


The document outlines a framework for using metrics in Agile project management, emphasizing the importance of both leading and lagging indicators. It introduces the Agile balanced scorecard, which evaluates business value, customer satisfaction, financial metrics, and schedule performance. Key considerations include definitions of business goals, efficiency, and effectiveness in resource utilization, supported by examples and recommended practices for measurement.