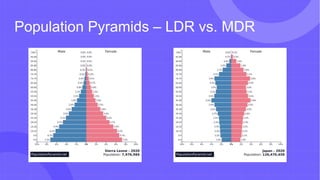
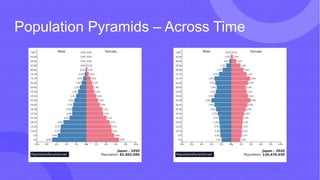
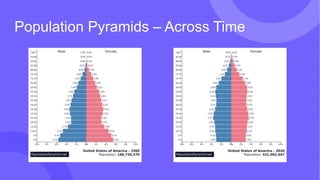
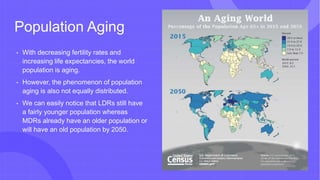
Population Structure
08.04.2021
Gülçin Con Wright
Concept Map
Sex ratio
Age-dependency ratio
Population pyramid
Median age
Sex ratio
• With more than 3 males per 1 female, Qatar
has highest sex ratio, Nepal has lowest gender
ratio of 84.55 (per 100 females).
• Child sex ratio and overall sex ratio should be
differentiated.
• At birth, sex ratio should be almost equal, only
with slightly more male babies than female
ones.
• However, in many countries, child sex ratio is
flawed towards more male babies – son
preference.
• As population ages, though, we see overall sex
ratio to be flawed towards females because
females live longer than males on average.
Flawed Sex ratio Example
Turkey – Age
& Sex
Distribution in
2020
0-14 years: 23.41% (male 9,823,553/female 9,378,767)
15-24 years: 15.67% (male 6,564,263/female 6,286,615)
25-54 years: 43.31% (male 17,987,103/female
17,536,957)
55-64 years: 9.25% (male 3,764,878/female 3,822,946)
65 years and over: 8.35% (male 3,070,258/female
3,782,174) (2020 est.)
Median Age
• Median age is an important indicator for
demographers because it also shows
whether a population is aging or not.
• Increasing median age would hint to
population age (lower fertility rates and
increasing life expectancy).
• Turkey’s median age is still not that high
(below 40 is considered as not old). Half of
Turkey’s population is still below 32.2.
• For male/female it ranges from 14.5/15.1
years in Niger to 53.7/57.0 years in Monaco
(2020).
Population Pyramids – LDR vs. MDR
Population Pyramids – Across Time
Population Cohorts – Baby Boomers
• Countries outside of the US and Western
Europe did not experience the kind of
baby boom at the end of WWII.
• It is not reasonable to talk about Baby
Boomers in Turkey.
• Other than their demographic
characteristics, cohorts also have distinct
social, economic, and political
characteristics.
• Not much discussions on specific cohorts
in Turkey.
Population Aging
• With decreasing fertility rates and
increasing life expectancies, the world
population is aging.
• However, the phenomenon of population
aging is also not equally distributed.
• We can easily notice that LDRs still have
a fairly younger population whereas
MDRs already have an older population or
will have an old population by 2050.
Problems associated with Population
Aging
• Old age dependency ratio would increase.
• Pension system would be broken since the working age population would shrink and not be
able to support a huge older cohort.
• A huge burden would be placed on the healthcare systems since older ages and increasing
life expectancy also come with chronic diseases and disabilities.
• The whole infrastructure of the communities has to also be altered according to the needs
of an older population.
• What types of changes in infrastructure would you project?

Population structure

  • 1.
  • 2.
    Concept Map Sex ratio Age-dependencyratio Population pyramid Median age
  • 3.
    Sex ratio • Withmore than 3 males per 1 female, Qatar has highest sex ratio, Nepal has lowest gender ratio of 84.55 (per 100 females). • Child sex ratio and overall sex ratio should be differentiated. • At birth, sex ratio should be almost equal, only with slightly more male babies than female ones. • However, in many countries, child sex ratio is flawed towards more male babies – son preference. • As population ages, though, we see overall sex ratio to be flawed towards females because females live longer than males on average.
  • 4.
  • 5.
    Turkey – Age &Sex Distribution in 2020 0-14 years: 23.41% (male 9,823,553/female 9,378,767) 15-24 years: 15.67% (male 6,564,263/female 6,286,615) 25-54 years: 43.31% (male 17,987,103/female 17,536,957) 55-64 years: 9.25% (male 3,764,878/female 3,822,946) 65 years and over: 8.35% (male 3,070,258/female 3,782,174) (2020 est.)
  • 6.
    Median Age • Medianage is an important indicator for demographers because it also shows whether a population is aging or not. • Increasing median age would hint to population age (lower fertility rates and increasing life expectancy). • Turkey’s median age is still not that high (below 40 is considered as not old). Half of Turkey’s population is still below 32.2. • For male/female it ranges from 14.5/15.1 years in Niger to 53.7/57.0 years in Monaco (2020).
  • 7.
  • 8.
  • 9.
  • 10.
  • 11.
    Population Cohorts –Baby Boomers • Countries outside of the US and Western Europe did not experience the kind of baby boom at the end of WWII. • It is not reasonable to talk about Baby Boomers in Turkey. • Other than their demographic characteristics, cohorts also have distinct social, economic, and political characteristics. • Not much discussions on specific cohorts in Turkey.
  • 12.
    Population Aging • Withdecreasing fertility rates and increasing life expectancies, the world population is aging. • However, the phenomenon of population aging is also not equally distributed. • We can easily notice that LDRs still have a fairly younger population whereas MDRs already have an older population or will have an old population by 2050.
  • 13.
    Problems associated withPopulation Aging • Old age dependency ratio would increase. • Pension system would be broken since the working age population would shrink and not be able to support a huge older cohort. • A huge burden would be placed on the healthcare systems since older ages and increasing life expectancy also come with chronic diseases and disabilities. • The whole infrastructure of the communities has to also be altered according to the needs of an older population. • What types of changes in infrastructure would you project?

Editor's Notes

  • #10 https://www.worldlifeexpectancy.com/turkey-population-pyramid