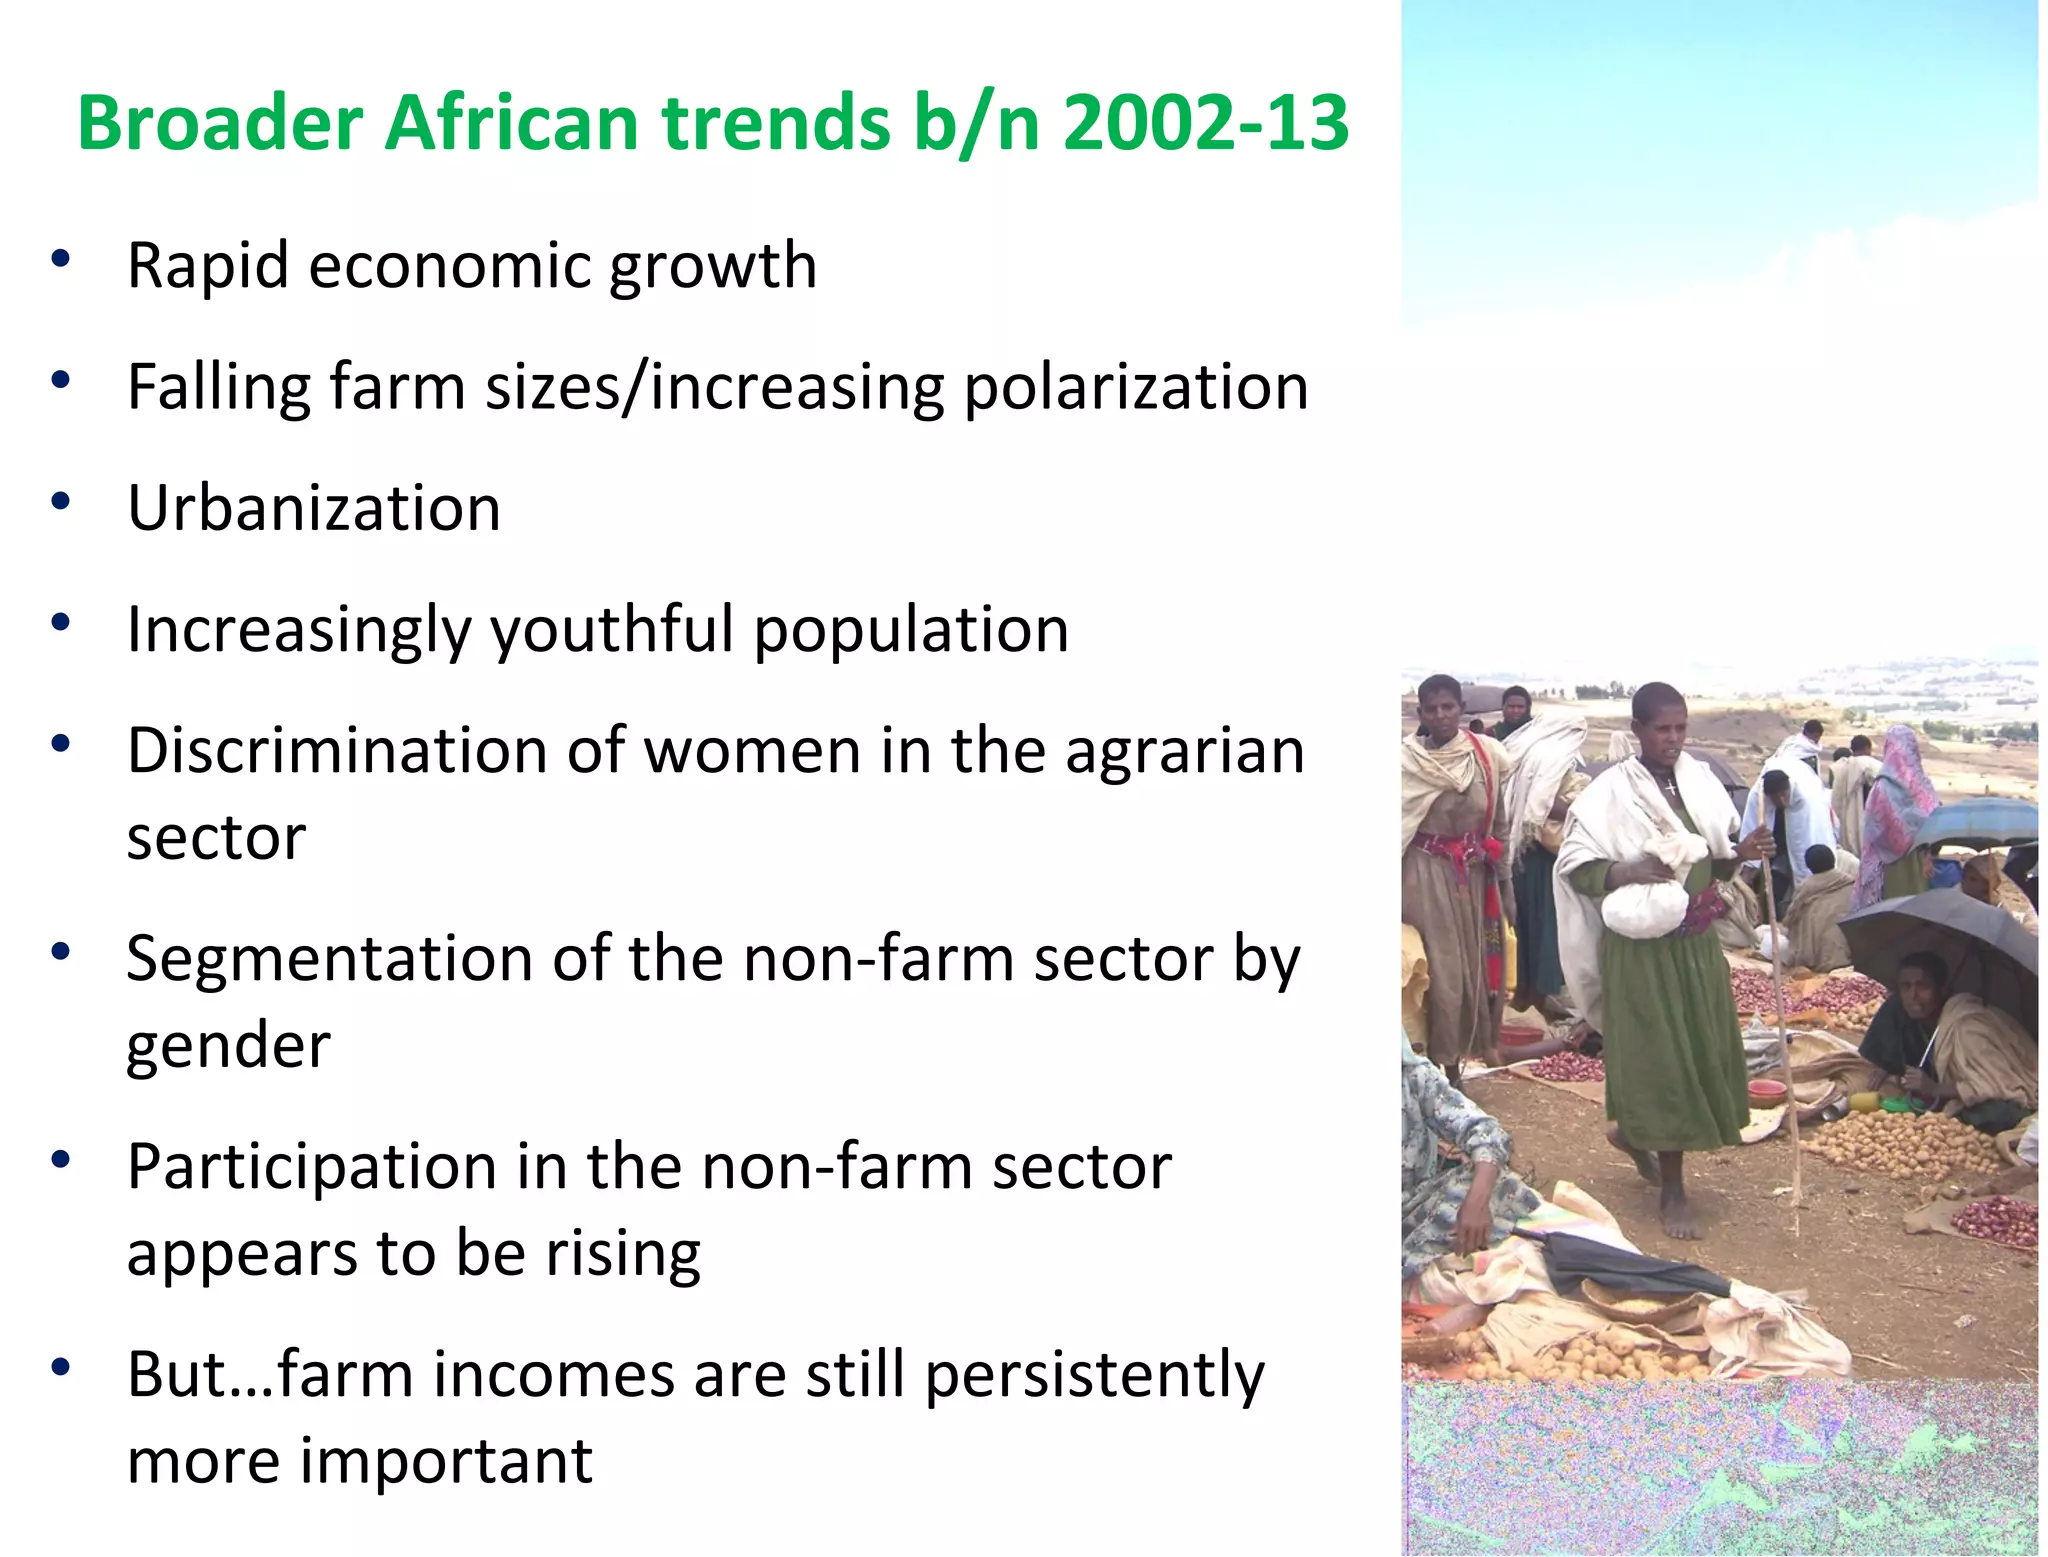
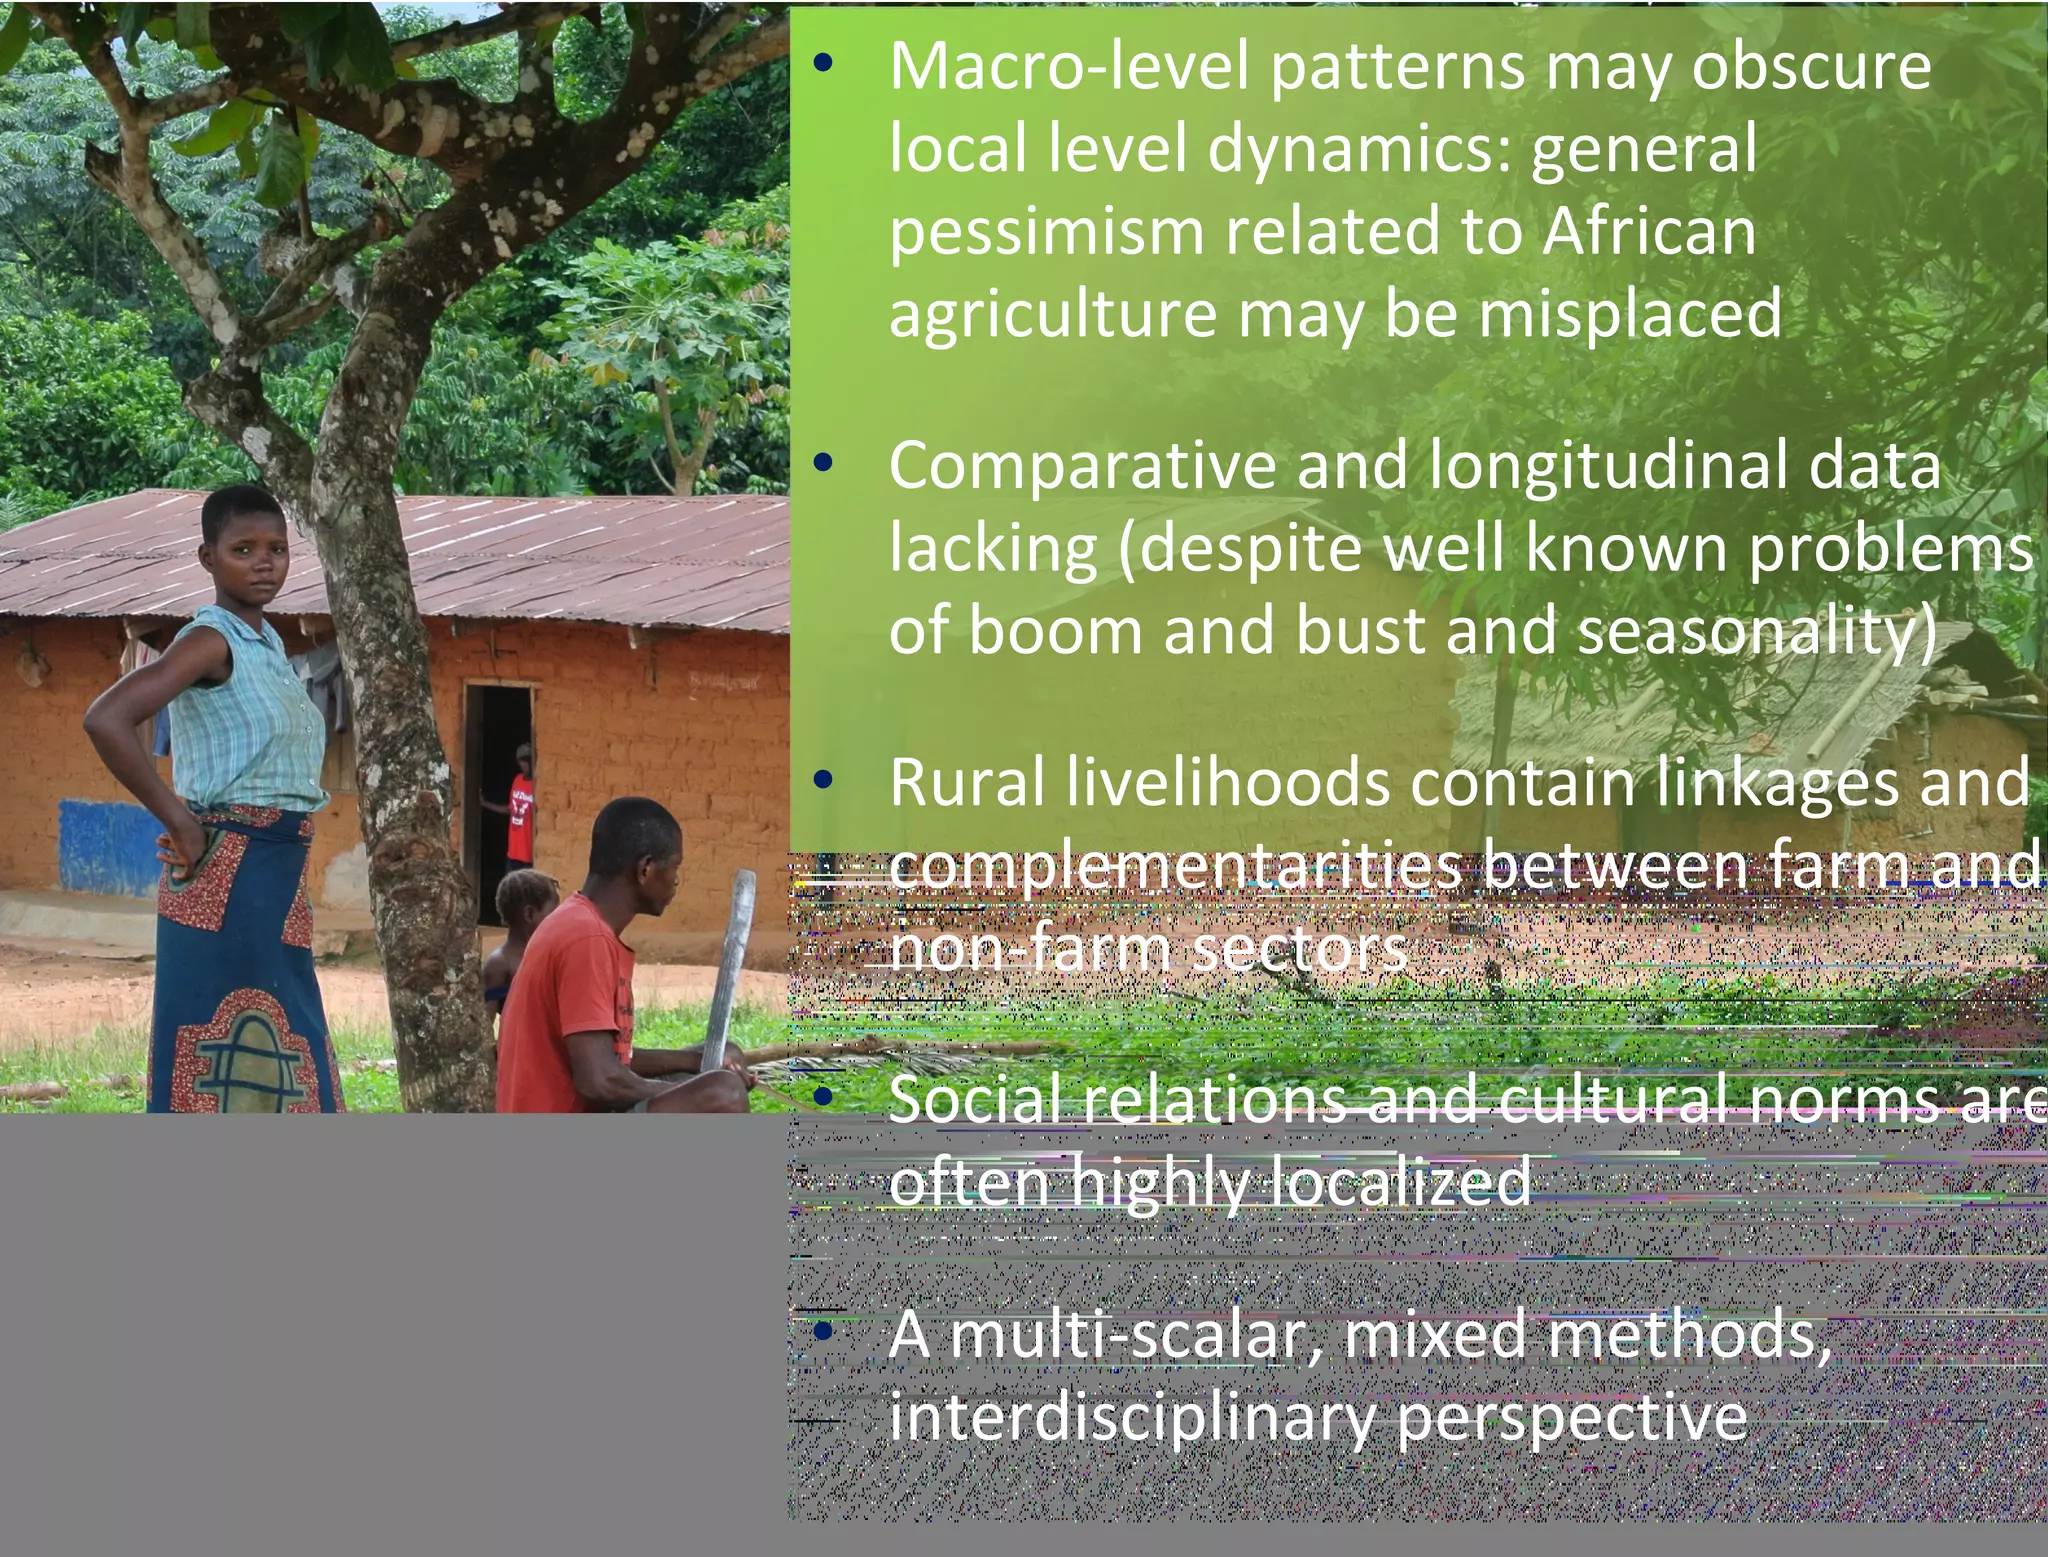
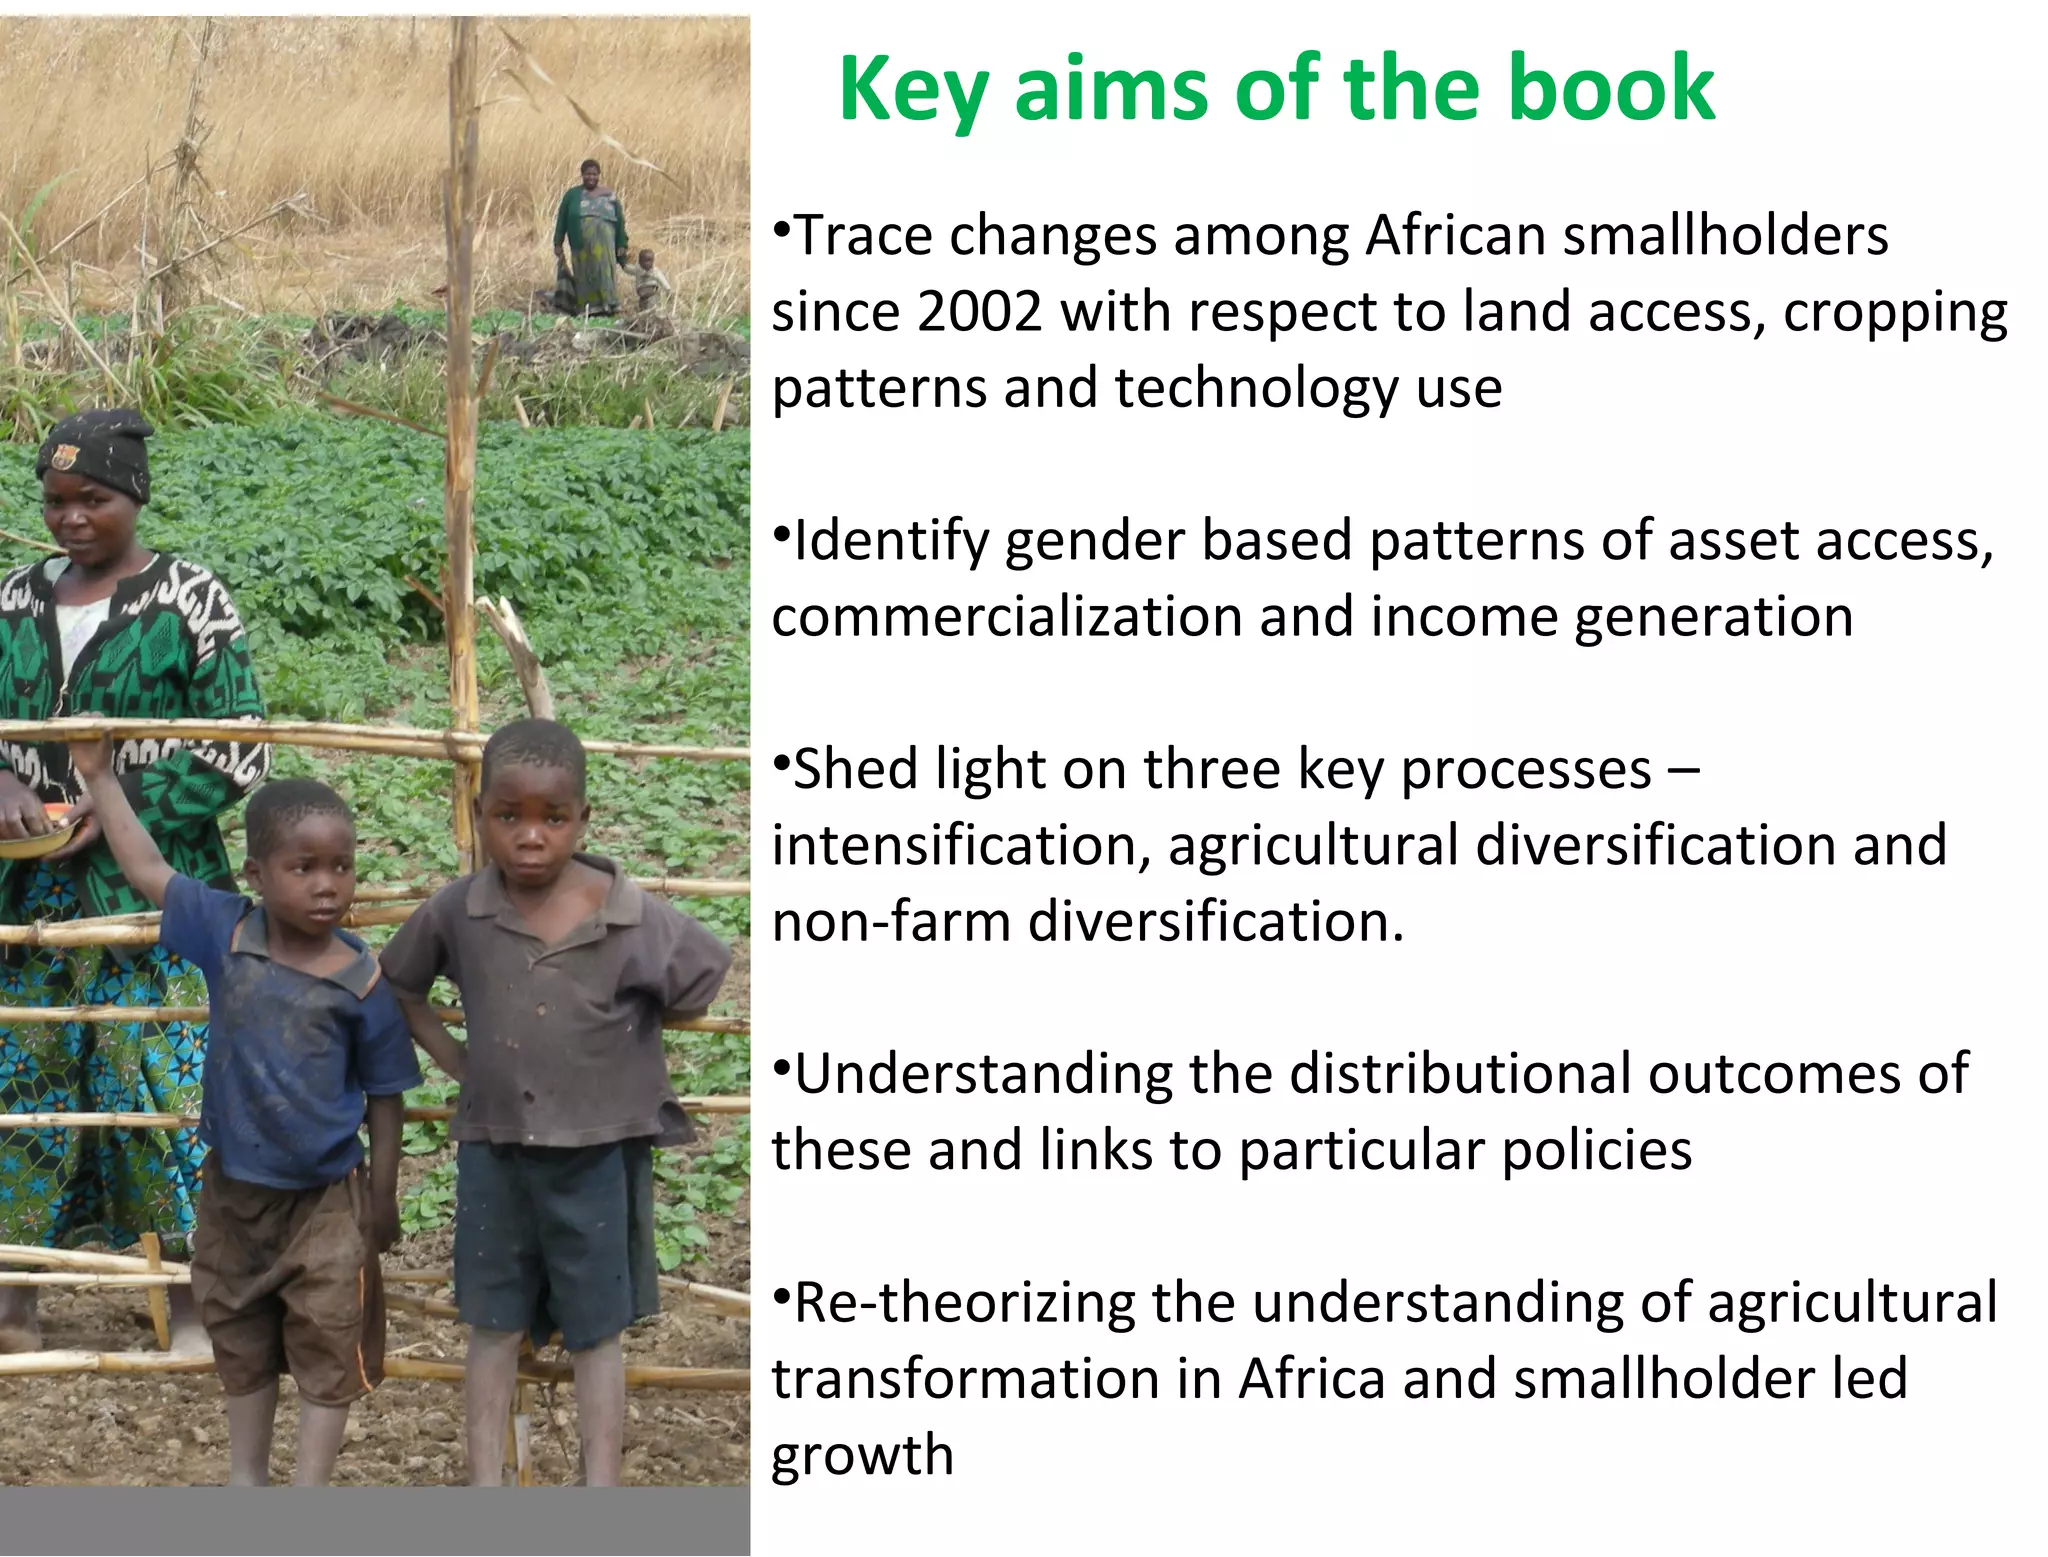
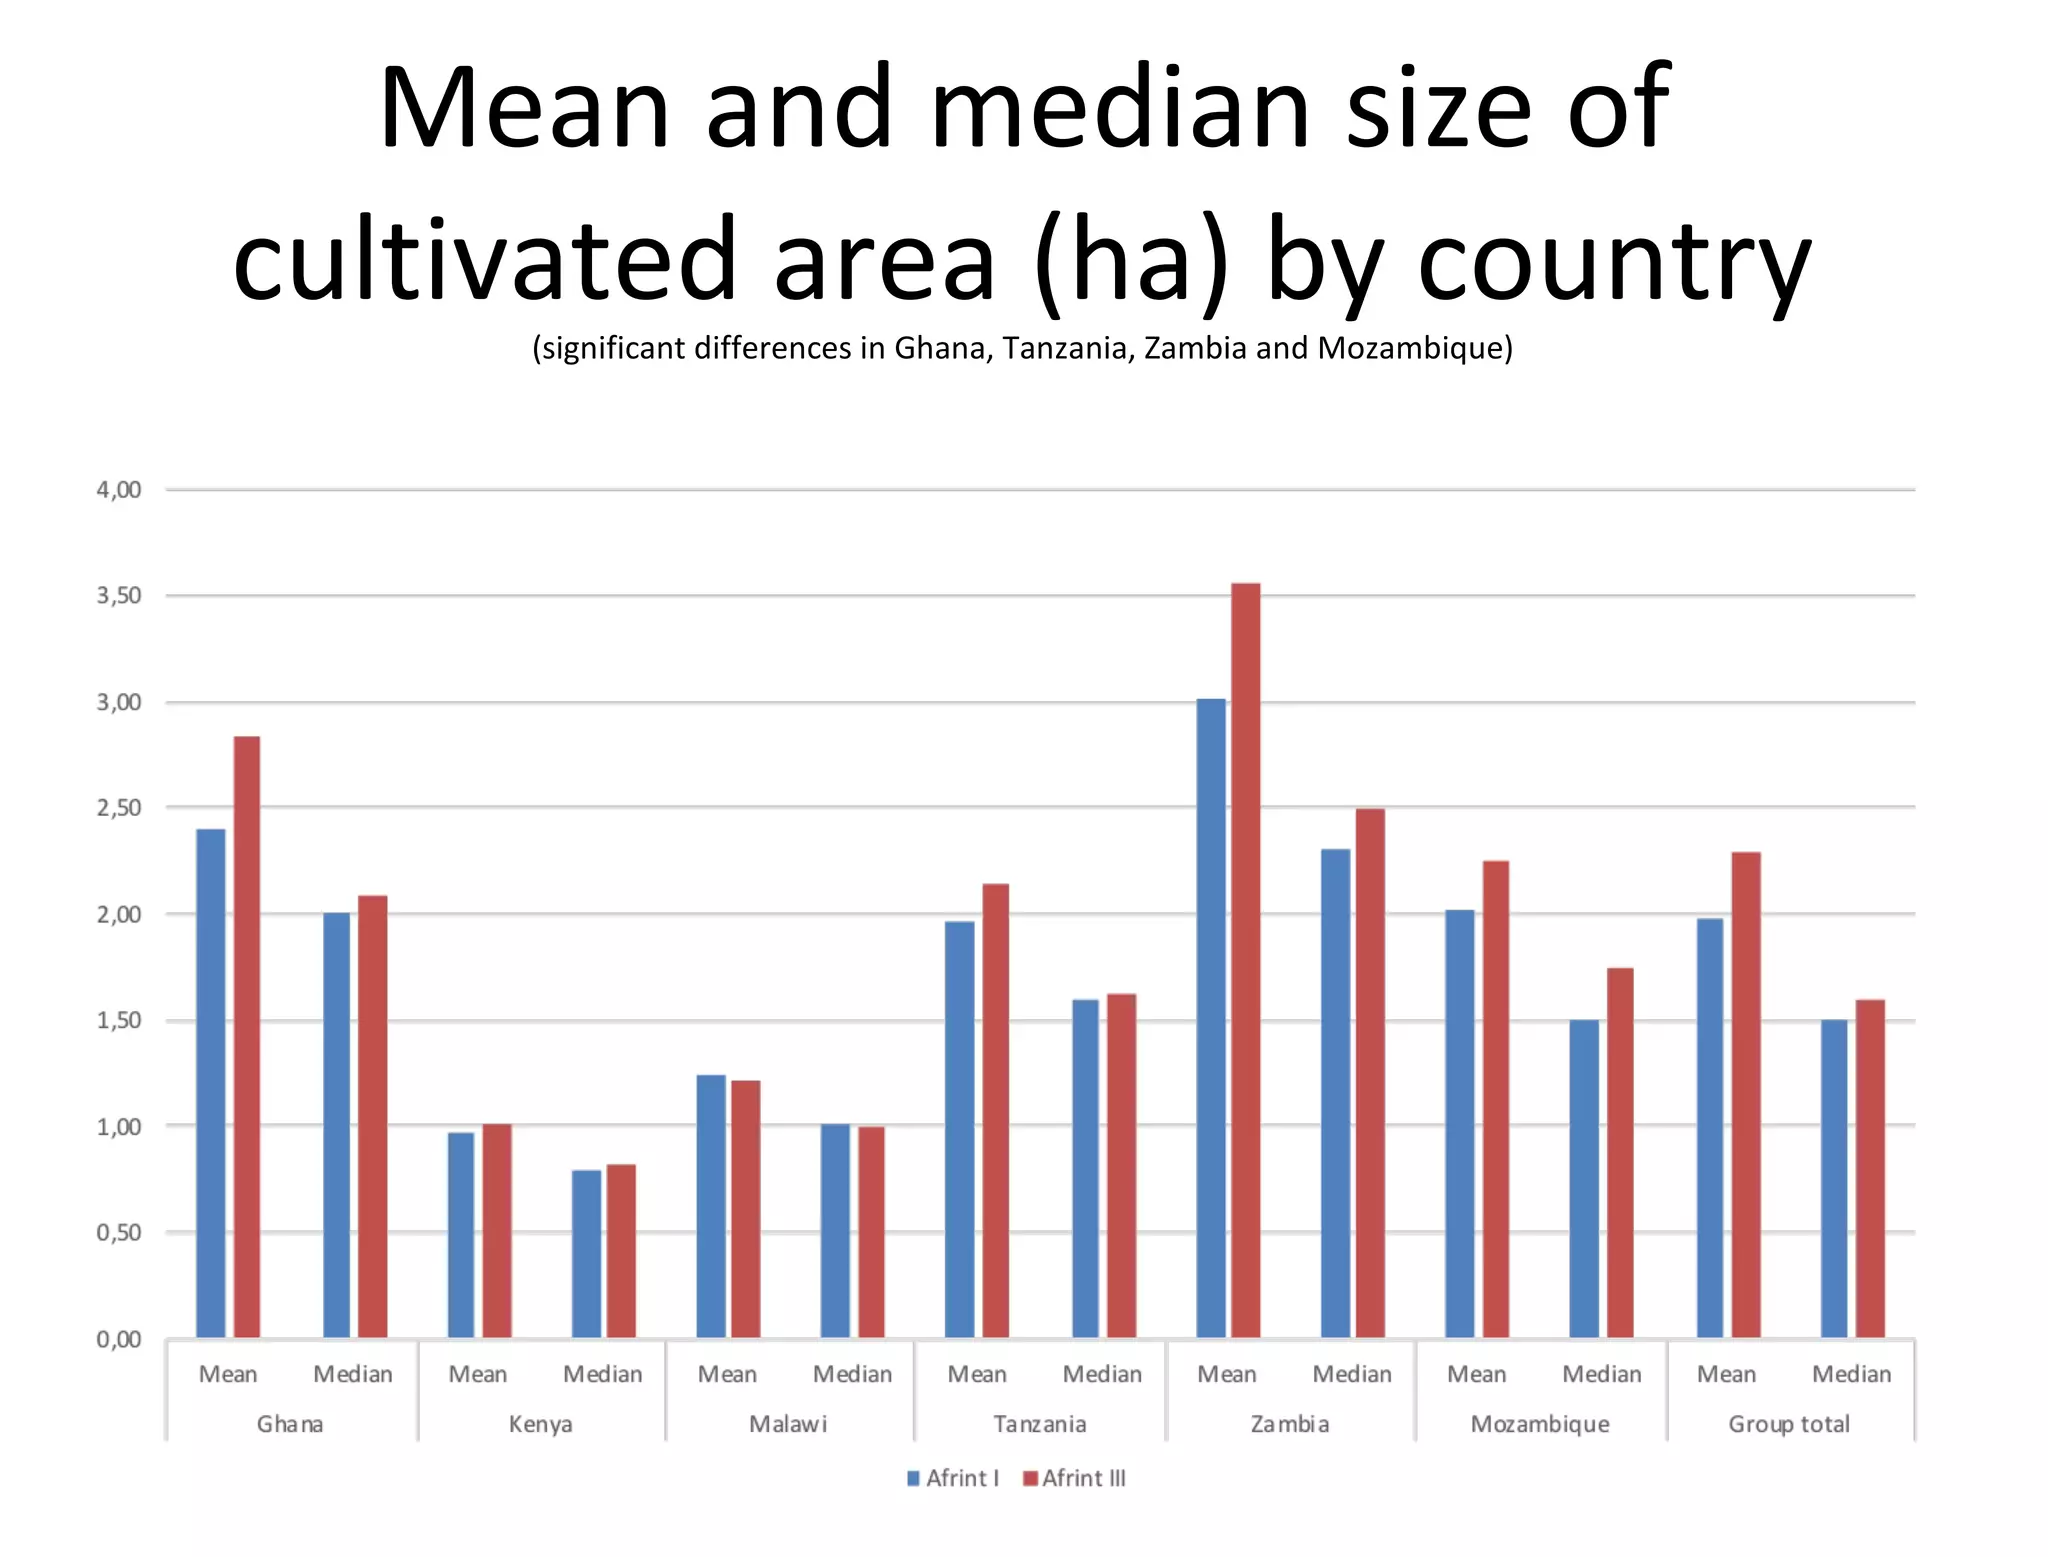
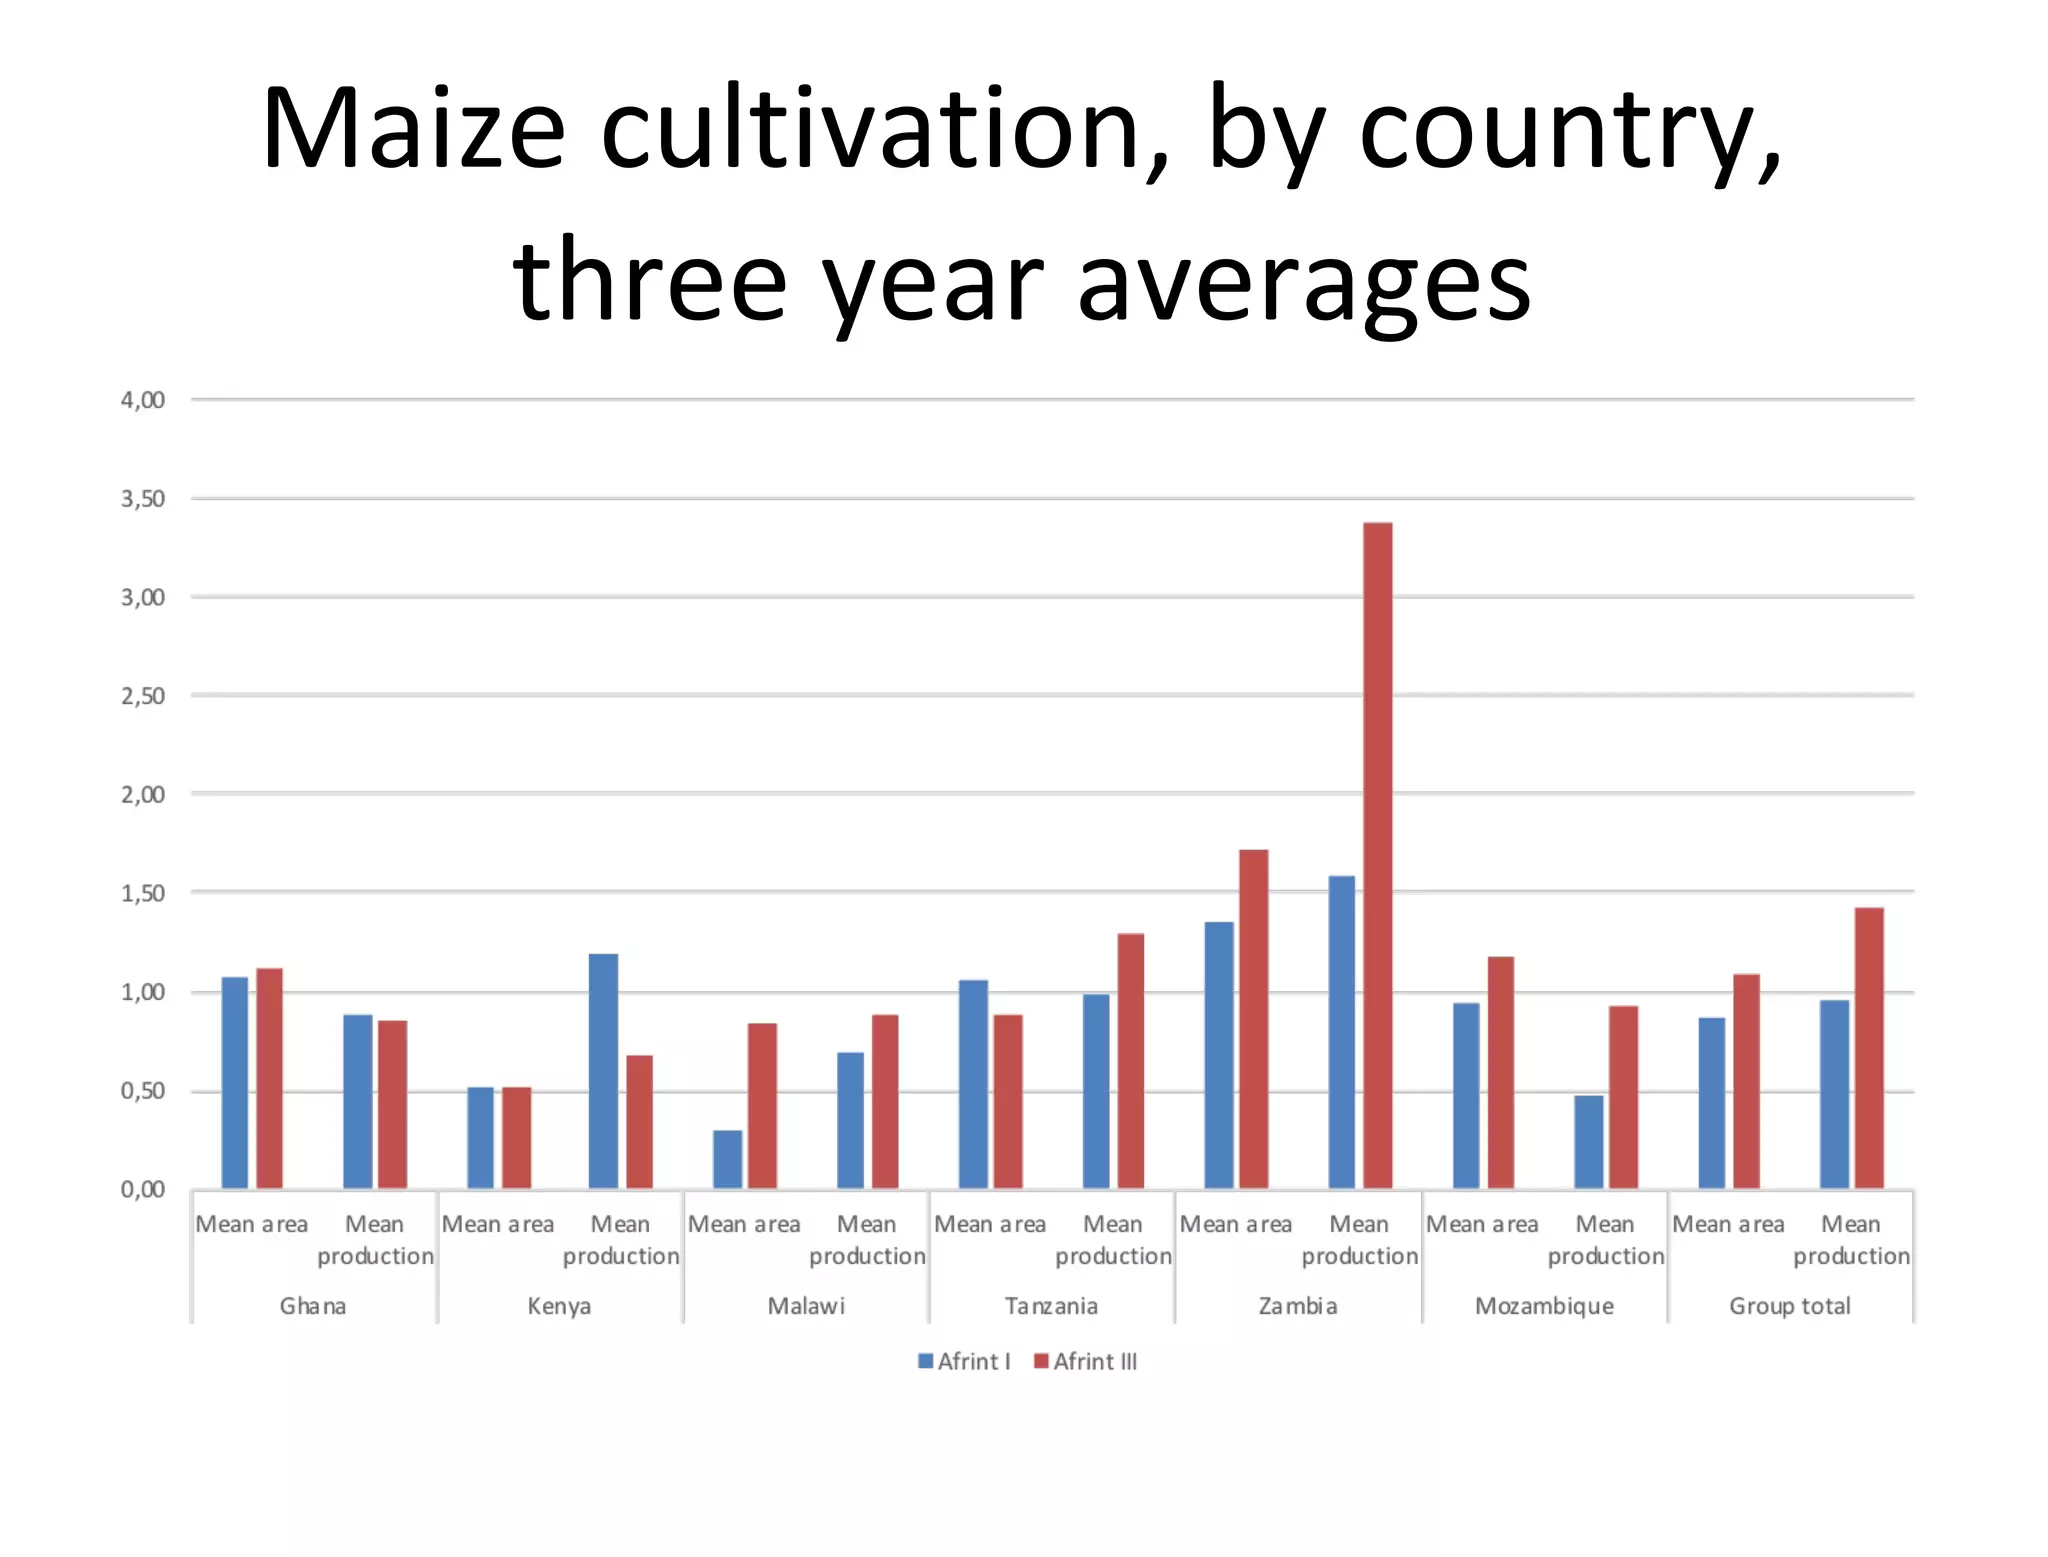
Agnes Andersson Djurfeldt
Fred Mawunyo Dzanku
Aida Cuthbert Isinika
LUND UNIVERSITY
UNIVERSITY OF GHANA
SOKOINE UNIVERSITY OF AGRICULTURE
Broader African trends b/n 2002-13
• Rapid economic growth
• Falling farm sizes/increasing polarization
• Urbanization
• Increasingly youthful population
• Discrimination of women in the agrarian
sector
• Segmentation of the non-farm sector by
gender
• Participation in the non-farm sector
appears to be rising
• But…farm incomes are still persistently
more important
• Macro-level patterns may obscure
local level dynamics: general
pessimism related to African
agriculture may be misplaced
• Comparative and longitudinal data
lacking (despite well known problems
of boom and bust and seasonality)
• Rural livelihoods contain linkages and
complementarities between farm and
non-farm sectors
• Social relations and cultural norms are
often highly localized
• A multi-scalar, mixed methods,
interdisciplinary perspective
Key aims of the book
•Trace changes among African smallholders
since 2002 with respect to land access, cropping
patterns and technology use
•Identify gender based patterns of asset access,
commercialization and income generation
•Shed light on three key processes –
intensification, agricultural diversification and
non-farm diversification.
•Understanding the distributional outcomes of
these and links to particular policies
•Re-theorizing the understanding of agricultural
transformation in Africa and smallholder led
growth
Data sources and methods
• Multi-stage, purposive
sampling
• Quantitative data collected for
around 2500 households in
2002, 2008 and 2013, 56
villages in 15 regions
• Qualitative data collected in 3
villages in Zambia, 3 villages in
Malawi, 5 villages in Kenya, 4
villages in Ghana
Data collection sites
6
Quantitative methods and
data sources
• Interviews carried out with the
self-identified farm manager
(29 %)
• Production and marketing data
2002, 2008 and 2013
• Cash income data at household
level 2008, 2013
• Intra-household cash income
data by sex for 2013
Quantitative methods and
data sources
• Joint methodology developed
together with a team of around
25 researchers in seven countries
• Around 1500 variables in the
database
• For 2002 and 2008, village level
variables were collected in
addition
• For 2013 only household level
variables and individualised
income data
• Cross sections of around 2500
households, 1566 in the full panel
(2002 to 2013)
Qualitative data
• Complementary data collection in Zambia, Kenya,
Malawi, and Ghana
• Purposive selection of villages fulfilling criteria for
”pro poor agricultural growth”
• Village level institutions related to access to
agrarian resources, technology, markets, credit
• Intra household access to income and savings,
decisionmaking processes within and outside
agriculture and accountability among spouses
• Around 170 qualitative interviews with individual
farmers and about 100 group interviews and key
informant interviews
Land access, cropping patterns,
technology use, commercialization and
non-farm incomes
• On average increasing farm sizes, but slightly
growing differentiation
• Relatively stable crop portfolios – maize and ”other
food crops” have grown in importance, sorghum
decreasing
• Stable use of seed technology, increasing use of
inorganic fertilizer on maize
• Persistent yield gaps
• Commercialization in maize has increased,
dropped in sorghum, stable in rice, increased in
other food crops
• Still, large country level differences
Mean and median size of
cultivated area (ha) by country(significant differences in Ghana, Tanzania, Zambia and Mozambique)
Maize cultivation, by country,
three year averages
Mean and median maize yields
(t/ha) 3 year averages
Average village yield gap in maize
relative to top 5%
Non-farm/farm linkages
• The share of households with non-farm incomes is stable
around 60% throughout the period
• On average non-farm incomes contribute 30% of total cash
income
• Access to non-farm income is a strongly differentiating
factor, however
• Households that combine farm and non-farm incomes have
cash incomes that are on average nearly 1.8 times higher
per adult equivalent, than households who specialize in
farming, even though their access to agrarian resources and
commercialization profiles within agriculture are the same.
Summing up – general trends
• Farm size increases in four countries have
occured primarily at the top end of the land
distribution
• Meanwhile farm sizes have stagnated in Kenya
and Malawi
• Maize has increased in importance in the crop
portfolios
• Maize production has increased, driven largely by
Zambian trends
Summing up – general trends
• Maize yields have increased in Zambia and to a lesser
extent Tanzania, but still remain low in these
countries. Moreover, yields have dropped in Malawi
and Kenya
• Yield gaps remain persistent throughout the period,
dropping only in Ghana
• Fertilizer technology has increased and is largely
similar among high performing maize farmers (top
5%) and the average
• Access to non-farm incomes remains stable, but is a
decisive source of differentiation
Gender patterns?
• Access to and use of key assets
• Commercialization patterns
• Income generation based on gender
• Regional perspectives
important
• Some common features – in
general land size smaller
among women
• Growing gender gaps where
land size increased
• Perception of control over
land is gender neutral
• Formal titling increased but
bias towards males
Land access
Labour
• Regional patterns vary, with
female headed households in
8 out of 15 regions having
fewer adult workers
• The share of male labour is
much lower among FHHs
• May have affects for land size
• Labour intensive technologies
Irrigation and technology use
• Access to water resources is higher among
male farm managers in 9 out of 15 regions
• Adoption of seed technology is gender neutral
• Other technologies, especially agroforestry,
pesticide use and use of animal manure, are
biased against female farm managers
Livestock
• Regional importance varies strongly, but…
• In regions where livestock are important
there are clear and growing gender gaps
• Women don’t own small stock to compensate
–strong male dominance
Non-farm assets?
• Massive expansion of ICT – gender neutral in
general (3% ownership in Afrint I, 67% by
Afrint III)
• Bicycle ownership has increased, but with a
large gender gap (69% versus 39 %)
• Housing standard has improved greatly, no
gender gaps
• Ability to save has also improved, regional
gender gaps are persistent though
Agricultural commercialization
• Commercialization in maize, measured through market
participation, share sold and volumes sold
• Market participation widespread and increasing over the
period, especially in Zambia and Tanzania
• Prices are undifferentiated by sex
• No significant changes in Kenya, higher volumes sold am
female farm managers in Tanzania
• Zambia drives commercialization tendencies over the
period, with a widening gender gap
Market participation in maize, Zambia, by sex
of farm manager Afrint I to III
Share of harvest sold for maize, Zambia, by sex
of farm manager, Afrint I and III
Amount of maize sold, Zambia, by sex of
farm manager, kg Afrint I and Afrint III
Other crops
• For food crops, feminization
of markets in Kenya,
masculinization in
Mozambique, Malawi,
Tanzania, no gender gaps in
Zambia and Ghana
• Cash crops, three crops
dominated by male farm
managers: cotton, tobacco
and sugar cane, but only in
Malawi, Mozambique and
Zambia
Cash incomes by gender
• In general incomes have remained stagnant
and in some countries they have dropped
• Small gender gaps in income in Afrint II, in
Malawi and Zambia, by Afrint III cash
income gaps are found also in Ghana and
Kenya, and their size has also increased.
Except for Kenya, male bias is related to
incomes generated from farming.
• Panel data show that female farm managers
are not biased in diversification processes
outside agriculture, but that they are
forfeiting opportunities within agriculture
Cash incomes per adult equivalent, in 2010
PPP adjusted USD
Intra household income
generation
• Male bias both in farm and non-
farm incomes, with a couple of
exceptions
• In general, the gender gaps within
households are larger than
between them
• Pinning women’s empowerment
on hopes of income generation
whether within or outside
agriculture is problematic as long
as the command over income that
they generate lies with their
husbands
Summing up
• Farm size has increased in some countries, fallen in others.
Such increases have benefited the top strata, but the
bottom strata remains unchanged. In regions where farm
sizes have increased, this has been accompanied by
increasing gender gaps in cultivated area.
• In general, female farm managers have smaller
landholdings than male farm managers.
• Maize and ”other food crops” have increased in
importance in crop portfolios. Maize production and yield
increases are largely driven by Zambian trends. Yields have
dropped in Kenya and Malawi and yield gaps remain
persistent.
Summing up contd.
• Fertilizer technology has increased and is largely similar
among high performing maize farmers (top 5%) and the
average, with no gender based differences
• Commercialization has generally increased, but in maize
it has widened gender gaps, other food crops are
masculinized in some countries, but feminized in Kenya.
Access to irrigation and male labour may explain the
tendencies towards masculinization
Summing up final…
• Access to non-farm incomes remains stable, but is a
decisive source of differentiation. Gender gaps in
income between households are, however
predominantly driven by farm based sources of
income. Non-farm diversification is a gender neutral
process
• While farm based assets have grown among male
headed households, general patterns of improved
livelihoods can be seen in rising standards of housing
and other non-farm assets – these are largely gender
neutral, suggesting that female headed households use
improvements in savings to invest outside agriculture

Afrint Book Launch Presentation 2018

  • 1.
    Agnes Andersson Djurfeldt FredMawunyo Dzanku Aida Cuthbert Isinika LUND UNIVERSITY UNIVERSITY OF GHANA SOKOINE UNIVERSITY OF AGRICULTURE
  • 2.
    Broader African trendsb/n 2002-13 • Rapid economic growth • Falling farm sizes/increasing polarization • Urbanization • Increasingly youthful population • Discrimination of women in the agrarian sector • Segmentation of the non-farm sector by gender • Participation in the non-farm sector appears to be rising • But…farm incomes are still persistently more important
  • 3.
    • Macro-level patternsmay obscure local level dynamics: general pessimism related to African agriculture may be misplaced • Comparative and longitudinal data lacking (despite well known problems of boom and bust and seasonality) • Rural livelihoods contain linkages and complementarities between farm and non-farm sectors • Social relations and cultural norms are often highly localized • A multi-scalar, mixed methods, interdisciplinary perspective
  • 4.
    Key aims ofthe book •Trace changes among African smallholders since 2002 with respect to land access, cropping patterns and technology use •Identify gender based patterns of asset access, commercialization and income generation •Shed light on three key processes – intensification, agricultural diversification and non-farm diversification. •Understanding the distributional outcomes of these and links to particular policies •Re-theorizing the understanding of agricultural transformation in Africa and smallholder led growth
  • 5.
    Data sources andmethods • Multi-stage, purposive sampling • Quantitative data collected for around 2500 households in 2002, 2008 and 2013, 56 villages in 15 regions • Qualitative data collected in 3 villages in Zambia, 3 villages in Malawi, 5 villages in Kenya, 4 villages in Ghana
  • 6.
  • 7.
    Quantitative methods and datasources • Interviews carried out with the self-identified farm manager (29 %) • Production and marketing data 2002, 2008 and 2013 • Cash income data at household level 2008, 2013 • Intra-household cash income data by sex for 2013
  • 8.
    Quantitative methods and datasources • Joint methodology developed together with a team of around 25 researchers in seven countries • Around 1500 variables in the database • For 2002 and 2008, village level variables were collected in addition • For 2013 only household level variables and individualised income data • Cross sections of around 2500 households, 1566 in the full panel (2002 to 2013)
  • 9.
    Qualitative data • Complementarydata collection in Zambia, Kenya, Malawi, and Ghana • Purposive selection of villages fulfilling criteria for ”pro poor agricultural growth” • Village level institutions related to access to agrarian resources, technology, markets, credit • Intra household access to income and savings, decisionmaking processes within and outside agriculture and accountability among spouses • Around 170 qualitative interviews with individual farmers and about 100 group interviews and key informant interviews
  • 10.
    Land access, croppingpatterns, technology use, commercialization and non-farm incomes • On average increasing farm sizes, but slightly growing differentiation • Relatively stable crop portfolios – maize and ”other food crops” have grown in importance, sorghum decreasing • Stable use of seed technology, increasing use of inorganic fertilizer on maize • Persistent yield gaps • Commercialization in maize has increased, dropped in sorghum, stable in rice, increased in other food crops • Still, large country level differences
  • 11.
    Mean and mediansize of cultivated area (ha) by country(significant differences in Ghana, Tanzania, Zambia and Mozambique)
  • 12.
    Maize cultivation, bycountry, three year averages
  • 13.
    Mean and medianmaize yields (t/ha) 3 year averages
  • 14.
    Average village yieldgap in maize relative to top 5%
  • 15.
    Non-farm/farm linkages • Theshare of households with non-farm incomes is stable around 60% throughout the period • On average non-farm incomes contribute 30% of total cash income • Access to non-farm income is a strongly differentiating factor, however • Households that combine farm and non-farm incomes have cash incomes that are on average nearly 1.8 times higher per adult equivalent, than households who specialize in farming, even though their access to agrarian resources and commercialization profiles within agriculture are the same.
  • 16.
    Summing up –general trends • Farm size increases in four countries have occured primarily at the top end of the land distribution • Meanwhile farm sizes have stagnated in Kenya and Malawi • Maize has increased in importance in the crop portfolios • Maize production has increased, driven largely by Zambian trends
  • 17.
    Summing up –general trends • Maize yields have increased in Zambia and to a lesser extent Tanzania, but still remain low in these countries. Moreover, yields have dropped in Malawi and Kenya • Yield gaps remain persistent throughout the period, dropping only in Ghana • Fertilizer technology has increased and is largely similar among high performing maize farmers (top 5%) and the average • Access to non-farm incomes remains stable, but is a decisive source of differentiation
  • 18.
    Gender patterns? • Accessto and use of key assets • Commercialization patterns • Income generation based on gender
  • 19.
    • Regional perspectives important •Some common features – in general land size smaller among women • Growing gender gaps where land size increased • Perception of control over land is gender neutral • Formal titling increased but bias towards males Land access
  • 20.
    Labour • Regional patternsvary, with female headed households in 8 out of 15 regions having fewer adult workers • The share of male labour is much lower among FHHs • May have affects for land size • Labour intensive technologies
  • 21.
    Irrigation and technologyuse • Access to water resources is higher among male farm managers in 9 out of 15 regions • Adoption of seed technology is gender neutral • Other technologies, especially agroforestry, pesticide use and use of animal manure, are biased against female farm managers
  • 22.
    Livestock • Regional importancevaries strongly, but… • In regions where livestock are important there are clear and growing gender gaps • Women don’t own small stock to compensate –strong male dominance
  • 23.
    Non-farm assets? • Massiveexpansion of ICT – gender neutral in general (3% ownership in Afrint I, 67% by Afrint III) • Bicycle ownership has increased, but with a large gender gap (69% versus 39 %) • Housing standard has improved greatly, no gender gaps • Ability to save has also improved, regional gender gaps are persistent though
  • 24.
    Agricultural commercialization • Commercializationin maize, measured through market participation, share sold and volumes sold • Market participation widespread and increasing over the period, especially in Zambia and Tanzania • Prices are undifferentiated by sex • No significant changes in Kenya, higher volumes sold am female farm managers in Tanzania • Zambia drives commercialization tendencies over the period, with a widening gender gap
  • 25.
    Market participation inmaize, Zambia, by sex of farm manager Afrint I to III
  • 26.
    Share of harvestsold for maize, Zambia, by sex of farm manager, Afrint I and III
  • 27.
    Amount of maizesold, Zambia, by sex of farm manager, kg Afrint I and Afrint III
  • 28.
    Other crops • Forfood crops, feminization of markets in Kenya, masculinization in Mozambique, Malawi, Tanzania, no gender gaps in Zambia and Ghana • Cash crops, three crops dominated by male farm managers: cotton, tobacco and sugar cane, but only in Malawi, Mozambique and Zambia
  • 29.
    Cash incomes bygender • In general incomes have remained stagnant and in some countries they have dropped • Small gender gaps in income in Afrint II, in Malawi and Zambia, by Afrint III cash income gaps are found also in Ghana and Kenya, and their size has also increased. Except for Kenya, male bias is related to incomes generated from farming. • Panel data show that female farm managers are not biased in diversification processes outside agriculture, but that they are forfeiting opportunities within agriculture
  • 30.
    Cash incomes peradult equivalent, in 2010 PPP adjusted USD
  • 31.
    Intra household income generation •Male bias both in farm and non- farm incomes, with a couple of exceptions • In general, the gender gaps within households are larger than between them • Pinning women’s empowerment on hopes of income generation whether within or outside agriculture is problematic as long as the command over income that they generate lies with their husbands
  • 32.
    Summing up • Farmsize has increased in some countries, fallen in others. Such increases have benefited the top strata, but the bottom strata remains unchanged. In regions where farm sizes have increased, this has been accompanied by increasing gender gaps in cultivated area. • In general, female farm managers have smaller landholdings than male farm managers. • Maize and ”other food crops” have increased in importance in crop portfolios. Maize production and yield increases are largely driven by Zambian trends. Yields have dropped in Kenya and Malawi and yield gaps remain persistent.
  • 33.
    Summing up contd. •Fertilizer technology has increased and is largely similar among high performing maize farmers (top 5%) and the average, with no gender based differences • Commercialization has generally increased, but in maize it has widened gender gaps, other food crops are masculinized in some countries, but feminized in Kenya. Access to irrigation and male labour may explain the tendencies towards masculinization
  • 34.
    Summing up final… •Access to non-farm incomes remains stable, but is a decisive source of differentiation. Gender gaps in income between households are, however predominantly driven by farm based sources of income. Non-farm diversification is a gender neutral process • While farm based assets have grown among male headed households, general patterns of improved livelihoods can be seen in rising standards of housing and other non-farm assets – these are largely gender neutral, suggesting that female headed households use improvements in savings to invest outside agriculture

Editor's Notes

  • #3 *inclusivity- closely tied to issues of equity and the role of agriculture in poverty reduction, has been shown to be much larger in equitable systems of land access, e g comparative work on China and India. Reason is that technology transfers are much more efficient in equitable systems of land access, enabling raised productivity for both labour and land.
  • #7 Ghana, Kenya, Malawi, Mozambique, Tanzania and Zambia 16 regions 54 villages 2400 households (2002, 2008, 2013/15) Purposively sampled in dynamic and less dynamic regions Representative at the village level Focus on staple crops Regional crop dynamics important
  • #10 *entry into markets or sale of more produce in combination with an improvement in saving: not being able to save in 2002, but being able to save in 2008, while increasing agricultural commercialization *9 fhh, 9 mhh, both spouses in these, stratified by average cash income (per capita) in each village.
  • #11 Market participation in maize around 50%, up from 35 % in afrint I Market participation
  • #20 The share of female headed households varies strongly from 14% to 45% (in Kenya no differences, one region in Mozambique neither, but for the rest there are differences, the