
Recommended
Recommended
More Related Content
Similar to Bird Study Analyzes Effects of Tides, Beach Locations and Disturbances
Similar to Bird Study Analyzes Effects of Tides, Beach Locations and Disturbances (20)
More from BHIConservancy
More from BHIConservancy (16)
Recently uploaded
Recently uploaded (20)
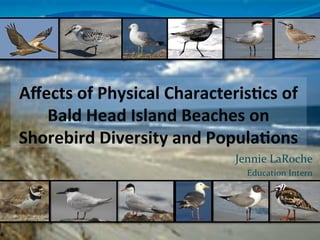
Bird Study Analyzes Effects of Tides, Beach Locations and Disturbances
- 1. Jennie LaRoche Education Intern
- 2. Research Ques+ons — Do the tides, beach location, severity of beach erosion, and amount of human disturbances affect the number of birds present on the beach and the species richness and diversity of the shorebirds?
- 3. Why research these ques+ons? — The groins and beach renourishment are important ecological issues for the Bald Head Island community. This research will provide information on the shorebird populations, particularly for the groins area and how it compares to untouched beaches and busy beaches of the Island. — The coasts are very important and fragile ecosystems. Coastal environments provide many services to the greater public and as such their health is of utmost importance. Birds are important indicators of the health of ecosystems. — Habitat loss and degradation seem to continue to be drivers of shorebird declines (Agardy et al 2005). With this loss of habitat, those shorebird populations become “concentrated at fewer sites, increasing the risk of catastrophic nesting failures.” (Grippo et al 2007). — Global tourism has been identified as one of the most profitable industries. By determining the characteristics that appear to be correlated with high bird species diversity and populations we can strive to keep the healthy beaches intact as much as possible.
- 4. Shorebird Study — 13 observation dates — Recorded time, weather, beach ID, erosion level, human disturbance level, bird numbers and species, and water quality data — From my data I determined the total number of species present (species richness) and the species diversity index — I ran single factor ANOVAs to determine whether or not there was a significant difference in the mean total number of birds, species richness, and species diversity between the different dependent (test) variables.
- 5. Tides — 3 classifications of tides — High/out – When the tide was on its way out — Low/in – When the tide was on its way in — Out/low/in – When the sampling time included the low tide ** High tide was too high to be able to use the UTV and record observations in a reasonable amount of time
- 6. Results: Tides SUMMARY Groups Count Average High/out 15 169.2667 Out/low/in 6 87.83333 Low/in 18 86.27778 Anova: Single Factor: Total Number of Birds ANOVA Source of Variation SS df MS F P-‐value F crit Between Groups 62990.21 2 31495.11 3.534767 0.039663 3.259446 Within Groups 320763.4 36 8910.094 Total 383753.6 38 — The number of birds sighted differs significantly (p = 0.0397) between the tides, but this test is unable to tell us between which tides this significance occurred. 0 20 40 60 80 100 120 140 160 180 high/out out/low/in low/in 169.27 87.83 86.28 Average Number of Birds
- 7. Results: Tides Anova: Single Factor: Species Richness ANOVA Source of Variation SS df MS F P-‐value F crit Between Groups 9.15812 2 4.57906 0.839862 0.440054 3.259446 Within Groups 196.2778 36 5.45216 Total 205.4359 38 — The Simpson’s diversity index for the different tides did not differ significantly (p=0.141). ANOVA Source of Variation SS df MS F P-‐value F crit Between Groups 0.035187 2 0.017593 2.069769 0.140975 3.259446 Within Groups 0.306008 36 0.0085 Total 0.341195 38 Anova: Single Factor: Simpson’s Diversity Index — The species richness for the different tides did not differ significantly (p=0.44).
- 8. Beach Loca+on — 3 beach locations were chosen based on physical characteristics — 1 – East Beach: little human disturbance, less erosion, a type of control (most ‘natural’) — 2 – Point: high human disturbance, ‘medium’ erosion — 3 – Groins: ‘medium’ human disturbance, high erosion
- 9. Results: Beach Loca+on SUMMARY Groups Count Average Beach 1 13 210 Beach 2 13 103.1538 Beach 3 13 42.15385 Anova: Single Factor: Total Number of Birds ANOVA Source of Variation SS df MS F P-‐value F crit Between Groups 187674.2 2 93837.1 17.22841 5.63E-‐06 3.259446 Within Groups 196079.4 36 5446.65 Total 383753.6 38 — The mean number of birds sighted differs significantly (p = 5.63e-‐6) between the beach locations, but this test is unable to tell us between which beaches this significance occurred. 0 50 100 150 200 250 1 2 3 210 103.15 42.15 Average Number of Birds
- 10. Results: Beach Loca+on Anova: Single Factor Species Richness ANOVA Source of Variation SS df MS F P-‐value F crit Between Groups 64.97436 2 32.48718 8.326396 0.001066 3.259446 Within Groups 140.4615 36 3.901709 Total 205.4359 38 Anova: Single Factor Simpson's Diversity Index ANOVA Source of Variation SS df MS F P-‐value F crit Between Groups 0.033463 2 0.016732 1.957336 0.155976 3.259446 Within Groups 0.307732 36 0.008548 Total 0.341195 38 — The Simpson’s diversity index at the different beach locations did not differ significantly (p=0.156). — The species richness of birds sighted differs significantly (p = 0.0011) between the beach locations, but this test is unable to tell us between which beaches this significance occurred. 0 2 4 6 8 10 1 2 3 9.23 6.38 6.62 Average Species Richness
- 11. Erosion — Separated into 3 categories depending on level/ intensity of erosion — 1 – little erosion, slight in comparison to other levels (East beach) — 2 – ‘medium’ erosion (Point) — 3 – High level of erosion (Groins) ** Erosion was paired with beach location since large changes in level of erosion did not occur in the few weeks my study was conducted.
- 12. Results: Erosion SUMMARY Groups Count Average 1 13 210 2 13 103.1538 3 13 42.15385 Anova: Single Factor: Total Number of Birds ANOVA Source of Variation SS df MS F P-‐value F crit Between Groups 187674.2 2 93837.1 17.22841 5.63E-‐06 3.259446 Within Groups 196079.4 36 5446.65 Total 383753.6 38 — The mean number of birds sighted differs significantly (p = 5.63e-‐6) between erosion levels, but this test is unable to tell us between which erosion levels this significance occurred. 0 50 100 150 200 250 1 2 3 210 103.15 42.15 Average Number of Birds
- 13. Results: Erosion Anova: Single Factor Species Richness ANOVA Source of Variation SS df MS F P-‐value F crit Between Groups 64.97436 2 32.48718 8.326396 0.001066 3.259446 Within Groups 140.4615 36 3.901709 Total 205.4359 38 Anova: Single Factor Simpson's Diversity Index ANOVA Source of Variation SS df MS F P-‐value F crit Between Groups 0.033463 2 0.016732 1.957336 0.155976 3.259446 Within Groups 0.307732 36 0.008548 Total 0.341195 38 — The Simpson’s diversity index for different levels of erosion did not differ significantly (p=0.156). — The species richness of birds sighted differs significantly (p = 0.0011) between the erosion levels, but this test is unable to tell us between which levels this significance occurred. 0 2 4 6 8 10 1 2 3 9.23 6.38 6.62 Average Species Richness
- 14. Human Disturbances — 3 levels of human disturbances — 1 – little/no humans , no buildings/houses — 2 – ‘medium’ level of human activity, houses/ buildings present — 3 – high level of disturbance, houses/buildings present ** This varied day to day, time of day often played a large role in the differences seen between days at the same beach
- 15. Results: Human Disturbances SUMMARY Groups Count Average 1 19 155.7895 2 11 44.72727 3 9 129.6667 Anova: Single Factor Total Number of Birds ANOVA Source of Variation SS df MS F P-‐value F crit Between Groups 87408.25 2 43704.13 5.309172 0.009537 3.259446 Within Groups 296345.3 36 8231.815 Total 383753.6 38 — The mean number of birds sighted differs significantly (p = 0.0095) between the different levels of human disturbance, but this test is unable to tell us between which levels this significance occurred. 0 20 40 60 80 100 120 140 160 1 2 3 155.79 44.73 129.67 Average Number of Birds
- 16. Results: Human Disturbances Anova: Single Factor Species Richness ANOVA Source of Variation SS df MS F P-‐value F crit Between Groups 30.56296 2 15.28148 3.145903 0.05506 3.259446 Within Groups 174.8729 36 4.857582 Total 205.4359 38 — The species richness for the different disturbance levels did not differ significantly (p=0.055). Anova: Single Factor Simpson's Diversity Index ANOVA Source of Variation SS df MS F P-‐value F crit Between Groups 0.035414 2 0.017707 2.084674 0.139104 3.259446 Within Groups 0.305781 36 0.008494 Total 0.341195 38 — The Simpson’s diversity index for the different disturbance levels did not differ significantly (p=0.139).
- 17. Discussion: Limita+ons and Future Studies — Limitations — Small sample size — Confined to low tide so I could get around the beaches — Large flocks of birds sometimes difficult to get an exact count — UTV in high demand — Future Studies — Time of day — Water Quality — Bird Behavior — Interacting affects of multiple dependent variables — Individual Species: are certain species better to focus on, can they tell us specific things about the health of the environment? — More sampling sites (smaller sections of beach)
- 18. Acknowledgements — Bald Head Island Conservancy — Staff — Board of Directors — Fellow Interns — The Public
- 19. Literature Cited — Agardy,T., J. Alder, P. Dayton, S. Curran, A. Kitchingman, M. Wilson, A. Catenazzi, J. Testrepo, C. Birkeland, S. Blaber, S. Saifullah, G. Branch, D. Boersma, S. Nixon, P. Dugan, N. Davidson, C. Vorosmarty. 2005. Ecosystems and Human Well-‐Being: Current State and Trends. Millennium Assessment Report Series: Global Assessment Reports. Washington, DC: Island Press, 513–549. — Grippo, M., S. Cooper, A. Massey. 2007. Effect of beach replenishment projects on waterbird and shorebird communities. Journal of Coastal Research (23), 5, 1088-‐1096. — “Groins”. An Educator’s Guide to Folly Beach, South Carolina. < http://oceanica.cofc.edu/an%20educator'sl%20guide%20to%20folly%20beach/guide/process3.htm>. accessed June 15, 2012. — Leonard, L., T. Clayton, O. Pilkey. 1990. An analysis of replenished beach design parameters on U.S. east coast barrier islands. Journal of Coastal Research, 6, 15-‐36. — Recher, H. F. 1966. Some aspects of the ecology of migrant shorebirds. Ecological Society of America (47), 3, 393-‐407. — U.S. NABCI Committee. 2000. The north American bird conservation initiative in the united states: a vision of American bird conservation. U.S. North American Bird Conservation Initiative, Washington, D.C.
- 20. Ques+ons?