Effects of diflubenzuron on shrimp population dynamics: from lab experiments ...
Eelgrass Poster-Amber
1. Abstract Summer Focus Results (Continued)
Introduction
Acknowledgements
Results
Background:
• Eelgrass had been declining in and around the upper Frenchman
Bay between the years 1996 and 2013 (Figure 1.) .
Why is Eelgrass Important?
We focused on three categories of stress genes in an attempt to
determine the kind of stress the plants were undergoing to better
pinpoint the cause of the decline.
•Heat – heat shock protein – HSP70 .
•General stress – reactive oxygen species (ROS) scavenging enzyme –
SOD.
•Defense – pathogens – CYP73A.
Normalized to:
Housekeeping gene – eIF4A (Eukaryotic initiation factor) control,
normalized gene expression.
Eelgrass (Zostera marina), a key component of the marine ecosystem,
has been declining in upper Frenchman Bay since 2007, and in 2013
suffered a complete loss both in restored sites and surrounding
naturally occurring eelgrass areas. To complement and help guide
restoration efforts, we wanted to understand the causes of decline. In
this study, we aimed to determine if there was any correlation between
plant stress, whether biotic (e.g., disease) or abiotic (e.g., heat stress or
general stress), and the recent decline. We collected ten eelgrass
samples from each of three sites varying in eelgrass health and bed
exposure (depth). Following RNA extraction and reverse
transcription, I used real-time quantitative PCR to compare the levels
of expression of three stress genes known to modulate the responses
of plants to heat, disease, and/or general stress among the three sites.
Here, I report normalized gene expression from the three sampled
sites and explore possible correlations between biotic and abiotic
stress, the health and status of the beds, and local eelgrass decline.
1996 – 3,174 acres
2008 – 1,128 acres
2013 – 183 acres
Questions/Hypotheses
Figure 1.
A map of Upper
Frenchman Bay
depicting eelgrass
decline over the years.
This map shows only
the most dramatic
location of eelgrass
loss, but eelgrass
decline extended
beyond this map.
References
It serves as a:
Nursery
Feeding ground
Refuge
For marine invertebrates.
And is also important for:
Carbon sequestration
Nutrient uptake
Shoreline and sediment
stabilization
Why the decline?
•Previously studied:
Shellfish dragging – We have
come to agreements with the
draggers to no longer drag over
eelgrass beds.
Water quality – Pollutants in
water run off.
Sediment toxicity – Chemicals
in the sediment
Green crabs – Abundance study.
•This summer:
Stress?
o Heat
o Disease
.
Methods
In the Field:
Samples were collected from three sites all varying in eelgrass health:
(Figure 2.)
1.Bar West – Most depleted and dramatic decline.
2.Bar East – Some decline, but overall good health.
3.Tide Pool – Extremely lush.
Figure 2.
A map of the three sampled
sites and year by year Eelgrass
abundance. Eelgrass declined
significantly between 1996
and 2015 with the most
significant loss at Bar West.
From each site, 20 plants were collected from 10 pairs of 2 adjacent
plants, with a minimum of 1 meter between each pair. (Figure 3.).
The plant samples were immediately put into RNAlater to preserve the
RNA.
cDNA
RNA extraction
rtq-PCR
Reverse Transcribe RNA
Results of Gene
Expression
Figure 3.
The collection method in the
field, sampling in pairs of 2
adjacent plants, with a minimum
of 1 meter between pairs.
In the Lab:
The samples were removed from the RNA later and a series of protocols
were followed using 10 of the 20 samples from each site. The RNA from
each sample was extracted and then reverse transcribed. This process
gave us the complementary DNA of the eelgrass, which was necessary to
run real-time quantitative PCR (rtq-PCR). The results from the rtq-PCR
told us how expressed each stress gene was in each sample (Figure 4.).
Figure 4.
Flow chart of our
methods in the lab to
determine gene
expression levels.
The average nighttime
temperature was
calculated from over a
month long time frame.
Tide Pool was
significantly warmer than
both Bar West, and Bar
East.
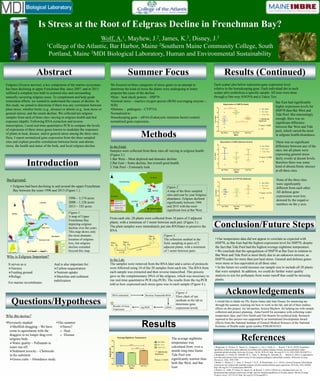
Each scatter plot below represents gene expression level
relative to the housekeeping gene. Each individual dot in each
scatter plot symbolizes a specific sample. All tests were done
through a One-way ANOVA and a Tukey Test.
Bar East had significantly
higher expression levels for
HSP70 than Bar West and
Tide Pool. But interestingly
enough, there was no
significant difference
between Bar West and Tide
pool, which varied the most
in eelgrass health/abundance.
Conclusion/Future Steps
There was no significant
difference between any of the
sites, but all plants were
expressing general stress
fairly evenly at decent levels,
therefore there was some
kind of abiotic/biotic stressor
at all three sites.
None of the three sites
were significantly
different from each other.
All defense gene
expressions were low,
denoted by the negative
numbers on the y axis.
• Our temperature data did not appear to correlate as expected with
HSP70, as Bar East had the highest expression level for HSP70, despite
the fact that Tide Pool had the highest average nighttime temperature.
• We conclude that the upregulation of HSP70 at Bar East in relation to
Bar West and Tide Pool is most likely due to an unknown stressor, as
HSP70 codes for more than just heat stress. General and defense genes
were more or less equivalent at all three sites.
• In the future we could increase our sample size to include all 20 plants
that were sampled. In addition, we could do further water quality
analysis to test for pollutants from water runoff that could be stressing
plants.
I would like to thank my PIs, Karen James and Jane Disney for mentoring me
through the summer, teaching me how to work in the lab, and all of their endless
efforts on this project, my lab partner, Jessica Mayhew, for helping me with sample
collection and project planning, Anna Farrell for assistance with collecting water
temperature data, and Chris Smith and Tim Stearns for technical help. Research
reported in this project was supported by an Institutional Development Award
(IDeA) from the National Institute of General Medical Sciences of the National
Institutes of Health under grant number P20GM103423.
1.Bergmann, N., Winters, G., Rauch, G., Eizaguirre, C., Gu, J., Nelle, P., … Reusch, T. B. H. (2010). Population-
specificity of heat stress gene induction in northern and southern eelgrass Zostera marina populations under
simulated global warming. Molecular Ecology, 19(14), 2870–83. http://doi.org/10.1111/j.1365-294X.2010.04731.x
2.Bergmann, N., Fricke, B., Schmidt, M. C., Tams, V., Beining, K., Schwitte, H., … Rauch, G. (2011). A quantitative
real-time polymerase chain reaction assay for the seagrass pathogen Labyrinthula zosterae. Molecular Ecology
Resources, 11(6), 1076–1081.
3.Brakel, J., Werner, F. J., Tams, V., Reusch, T. B. H., & Bockelmann, A.-C. (2014). Current European Labyrinthula
zosterae are not virulent and modulate seagrass (Zostera marina) defense gene expression. PloS One, 9(4), e92448.
http://doi.org/10.1371/journal.pone.0092448
4.Winters, G., Nelle, P., Fricke, B., Rauch, G., & Reusch, T. (2011). Effects of a simulated heat wave on
photophysiology and gene expression of high- and low-latitude populations of Zostera marina. Marine Ecology
Progress Series, 435, 83–95. http://doi.org/10.3354/meps09213
Is Stress at the Root of Eelgrass Decline in Frenchman Bay?
Wolf, A.1, Mayhew, J.2, James, K.3, Disney, J.3
1College of the Atlantic, Bar Harbor, Maine 2Southern Maine Community College, South
Portland, Maine 3MDI Biological Laboratory, Human and Environmental Sustainability