1. Road Mortality Study
Tara Pratt, Dan Broderick, Marisa Morrison, and Matt Cecchetelli
May 14th
, 2014 – June 25th
, 2014
Route 123: Hancock, Antrim, Stoddard, NH
2013 Data completed by : Stephen Day, Alex Kirk, Kyle Tefft, and Stefan Birardi
2. Overview:
In May and June 2013 and 2014, Keene State Collegeinterns conducted roadmortalitysurveys onRoute 123, in
the townsof Hancock,Stoddard,and Antrim,New Hampshire.In2014, five transectswere surveyedforlive androad-
killedvertebratestwotimesperweek fromMay14 throughJune 26. In2013, fourtransectswere surveyedtwotimes
perweekfromMay 17th
throughJune 26th
.
Each transect was 0.8 mi in length. Surrounding habitat for each transect is detailed below.
Length
(Miles) Road Description
Transect
# 0 0.8 Mostlyforest, witha large creekon the NorthEndof the Transect
Transect
# 1 0.8 Mixture of forest, a creek, as well as about 200 yards of Wetlands
Transect
#2 0.8 Wetlands covering most of the West side ofthe transect withForest coveringthe East
Transect
# 3 0.8
A large pondsits in the middle of the East side of the transect;The rest is a Mixture of forest and
wetlands
Transect
# 4 0.8 Wetlandsare present at the Northern andsouthern ends ofeachtransect withmixedforest inbetween
Total 4 Route 123,Towns of Hancock, Stoddard, and Antrim NH, Hillborough County
Note: Transect 0 was not added until 2014, after the first week of surveying
3. Method:
In 2014, transectswere surveyed twotimesweekly fromMay14 to June 26, 2014 (Transect0 wasnot added
until the secondweek).SurveysbeganateitherTransect0(travelingSouthtoNorth) orTransect 4 (travelingNorthto
South) at approximately8a.m. All transectswere surveyedonfoot. We wouldparkat the centerof eachtransect.Two
observers wouldwalk north,andtwoobservers wouldwalk south.
For eachindividual observation, live ordead, we wouldnote the species,itsprecise location
(latitutde/longtitude),aswell asitsapproximate location onthe road (white line,shoulder,centerline,ormiddleof
lane). Forlive animals,we alsonoted the directionof travel if possible.Eachanimal was recorded as:alive onthe road
(AOR),alive beside the road (ABR),deadonthe road (DOR),or deadbeside the road (DBR).Once recorded,each animal
was removedfromthe road, to ensure itwas not counted more thanonce.
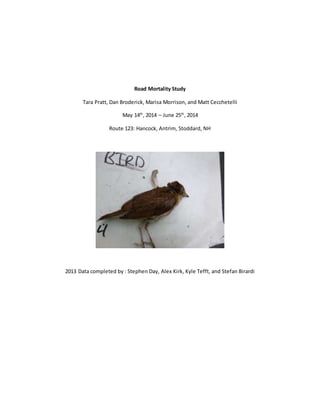
If observerswere unable toidentify ananimal tospecies,itwasphotographedwith awhite board “label,”
includingthe date,observationnumber,latitude andlongitude, andatitle (ex:“Bird,Unknown”). Photos werethen
sharedwith specialiststodeterminespeciesidentification. Some individual animalsweredamagedbeyondrecognition,
and had to be categorizedsimplyas“Unknown.”
Results:
Overthe course of the 2014 study,we surveyedfive transects13 times(except0,whichwasobserved12times)
and observedatotal of 1,379 vertebrates (254 alive and1,125 dead). In2013, four transectswere surveyed,foratotal
of 931 vertebrates(86alive and845 dead). RedEfts(Juvenile EasternNewts) comprisedthe majorityof bothlive and
deadsightingsinboth2013 and2014; frogs were the secondmostabundantspeciesgroupamongthe observationsof
deadanimals. The graphbelowshowsthe total numbersof observationsbothalive anddeadforthe 2013 ad 2014
studies.
Total observation numbers for 2013 and 2014, broken into Alive and Dead categories
0
200
400
600
800
1000
1200
1400
1600
Alive Dead Total
NumberofObservations
Observation Totals: Alive and Dead
2013
2014
4. The table Below shows each identifiable species and the numbers of observations of each for both 2013 and 2014.
.
SPECIES Total 2013 Total 2014
American Bullfrog 1 2
American Toad 8 3
Black Bear 1 0
Cedar Waxwing 1 0
Chipmunk 0 1
Common Yellowthroat 3 0
Garter Snake 3 7
Green Frog 0 3
Grey Tree Frog 19 36
Milk Snake 0 1
Hairy Tailed Mole 1 0
Newt 0 3
Northern Red-Bellied Snake 3 6
Northern Water Snake 5 6
Painted Turtle 5 8
Pickerel Frog 0 2
Porcupine 2 0
Red- Spotted Newt 0 5
Red-Backed Salamander 5 1
Ribbon Snake 0 1
Spotted Salamander 0 5
Short Tailed Shrew 1 0
Snapping Turtle 4 2
Spring Peeper 8 51
Veery (Bird) 1 1
Water Snake 0 1
Wood Frog 10 22
Yellow- Rumped Warbler 0 2
This table, showing individual species, led to the graph below which shows the differences in total observation of species (not
including Red Efts, or any type of Unknown animal) to find differences in species over the past two years.
0
10
20
30
40
50
60
AmericanBullfrog
AmericanToad
BlackBear
CedarWaxwing
Chipmunk
CommonYellowthroat
GarterSnake
GreenForg
GreyTreeFrog
MilkSnake
HairyTailedMole
Newt
NorthernRed-Bellied…
NorthernWaterSnake
PaintedTurtle
PickerelFrog
Porcupine
Red-SpottedNewt
Red-Backed…
RibbonSnake
SpottedSalamander
ShortTailedShrew
SnappingTurtle
SpringPeeper
Veery
WaterSnake
WoodFrog
YellowRumped…
#
o
b
s
e
r
v
a
t
i
o
n
s
Total Numbers of Observation of Confirmed Animal Species (not including unknown's and Red Eft's)
Total 2013
Total 2014
5. Total numbers of observations Show the differences in several species including: Grey Tree Frog, Spring Peepers, as well as wood
Frog counts from the 2013 to 2014 season. The Red Efts are separated below to show differences in the 2013 to 2014 season.
The Numbers of Observations found for Red Eft differences in 2013 to 2014 are different, but not significantly. Below, you can see
the comparison of the numbers of observations of Red Efts, compared to the total number of all other animals. This shows how
significant the abundance of Red Efts are in the local habitat. Red Efts do not follow a pattern; they have high population numbers
and live seemingly everywhere in the local habitats. The number of Red Efts adds up to almost as much as all other animals
combined.
# ofObservations
Red Efts 1,691
All Other 2,310
0
200
400
600
800
1000
1200
2013 2014
# Red Efts Found
# Red Efts Found
0
500
1000
1500
2000
2500
Red Efts All Other
Observations of Red Efts compared to
all other observations
Observations
6. The table below aims to show how the numbers of individual species type compared in each transect from 2013 to 2014 may have
similarities or differences.
Year Transect Mammals Birds Amphibians Turtles Snakes Unknown
2013 1 2 1 279 1 5 4
2 2 2 166 0 2 3
3 0 1 177 3 5 2
4 4 1 147 6 5 1
2014 0 2 1 217 0 1 11
1 0 0 380 0 6 17
2 1 1 158 1 9 24
3 1 3 377 7 10 35
4 0 0 130 1 3 22
Total 0 (2014 only) 2 1 217 0 1 11
1 2 1 659 1 11 21
2 3 3 324 1 11 27
3 1 4 554 10 15 37
4 4 1 277 7 8 23
Total(all
transects) 12 10 2,031 19 46 119
The Graph below shows the differences in numbers of observations (not separated by species) in each transect from 2013
to 2014 to see similarities and differences in “hot Spots” or areas with the highest animal activity.
Differences in species richness and abundancebetween transects are likely dueto differences in roadsidehabitat,and
differences in year-to-year observations alongthe sametransect may be related to weather, but more data areneeded to fully
characterizethese year-to-year and site-by-sitecomparisons.Current“hot spot” for animal activity seem to be transect 3. At
transect3, we not only had the highest number of observations,butlower numbers of Red Efts. This means more animals suchas
frogs and turtles are being hit. This makes sensedo to the wetlands that surround this area.If a management plan were to be put in
place,this would be the firsttransectto consider placement due to its high numbers of animal traffic.
0
100
200
300
400
500
Transect
#0
Transect
#1
Transect
#2
Transect
#3
Transect
#4
#
o
b
s
e
r
v
a
t
i
o
n
s
Total # observations in Each transect:
2013 and 2014
2014
2013
7. We also analyzed the data based on precipitation and time of day. The bulk of our surveys were conducted duringthe early
morning and in the rain (based on anecdotal observations thatroad-kill were more abundantduringand following rain events, and
that carcasses tended to disappear –or be rendered unrecognizable – by latemorning), so our samplesizes for dry and late-day
surveys are small;however, it seems that the highestnumbers of observations,both aliveand dead, were found duringprecipitation
and around 9 a.m.
This study demonstrates that there area largenumber of animals (mostly amphibiansand reptiles) beinghitby cars along
this stretch of road,but itshows only a very small fraction of the problem. In only 13 study days over 7 weeks on 4 miles of road,
over 1,125 road-killed animals wereobserved. Now imaginethis occurringevery day of the week, on a largehighway, rather than
Route 123 in the small towns of Hancock,Antrim, and Stoddard. The conclusion is thatroad-kill isa meaningful conservation concern
for local wildlife,particularly amphibiansand reptiles.
Recommendations:
Although we feel that this year’s study was successful, we do have some recommendations for making the
fieldwork simpler and more effective, as well as some items which we believe worked well:
(1) Keep an equipment checklist,and consultiteach day before leavingfor the study site. Forgetting one item seemed to be a simply
solved,but frustratingproblemthroughout the field season.
(2) Vary the timing and weather conditions of the surveys,in order to have a more definitiveidea of which times and weather
conditions arebest for encountering road-kill: conductingmore surveys in the early morning, afternoon, evening, and night would
better enable us to compare these characteristics.
(3) Adding a category to the sheet labeled North or South bound lane, will makeit is clear which “middleof Lane” the animal is
located in
(4) Adding lines without header information to the back of each data sheet will createmore spaceand waste less paper throughout
the process and make itless likely thatwe
(5) Lastly,two things that worked well that we recommend keeping for the next year are havinga simpleguide to commonly-
encountered herptiles,as well as data tune-up days every other week for quality control.The herp guide gave us an easy
understanding of the identifying characteristics of the animals wemost commonly saw,and the data tune-up days helped fix a lot of
small (and notso small) issues in our data collection and entry.