11.[8 17]length-weight relationships of some important estuarine fish species...
Flats Ecology Research Poster
1. Abiotic and biotic factors as indicators for ideal nursery mangrove habitats in Eleuthera, The Bahamas
Introduction
Mangroves are salt-tolerant trees found in tropical and subtropical coastal marine areas (Gilbert and Janssen 1998). They offer a wide range of habitat
variation and a high diversity of organisms (Field et al. 2004). Mangroves are important because they serve as barrier ecosystems from storms, provide
protection against erosion, are carbon sinks, and are accumulation sites for sediment, nutrients, and contaminants (Alongi 2002, Beck et al. 2001). They
have economic importance because many of the fish that live in mangroves are commercially important; the world’s mangroves are worth over 180
million dollars (Alongi 2002). Most importantly, mangroves are nursery habitats for the juvenile fish of many species (Figure 1b) (Mumby et al. 2004).
However, there are several pressing anthropogenic threats to mangrove ecosystems . These threats include deforestation, coastal development, pollution,
degradation and climate change (Alongi 2002) (Figure 1a and 1c). Consequently, about 1/3 of the world’s mangroves have been depleted in the past fifty
years (Alongi 2002).
The purpose of this research was to identify abiotic and biotic factors of an ideal mangrove nursery habitats in The Bahamas to aid in prioritizing nursery
areas for inclusion in Marine Protected Areas (MPAs). It was hypothesized that mangrove ecosystems located on the sheltered side of Eleuthera, that
exhibit a high prop root density, and have a narrow creek mouth width will be the most effective nursery habitats for juvenile fish. It is important to
establish MPAs that encompass ideal mangrove ecosystems because it gives species an area to thrive with limited and controlled human interference.
Currently, effective conservation of mangroves is limited because there is little understanding of which creeks are the most efficient nurseries.
Methods
This research was conducted in several mangrove creeks (Figure 2) on South Eleuthera in The Bahamas (24°50’05” N; 76°20’32” W) during the Fall of
2011. Sampling and data collection for each creek began at the mouth and included recording the date, location, tide, time, wind direction and speed,
percent cloud cover, creek mouth width, and any fragmentation of the creek. The rest of the data was collected along 30 meter transects, three of which
were located towards the mouth of the creek, and three of which were located further inward (Figure 3). Transects were placed on alternating sides of
creeks, along the mangroves. At the beginning of each transect, a YSI instrument was used to measure temperature (˚C), salinity (ppt), and dissolved
oxygen (mg/L) (Figure 4). Ammonia was also measured (ppm mg/L, ammonia test kit), the bottom type was described and a ruler was used to measure
water depth (cm) at 0, 15, and 30 meter marks along each transect. Mangrove prop root density was determined by counting the number of roots that
touch the bottom between the 10-15 and 20-25 meter sections along the transect and 20 centimeters deep (Figure 3). Fish surveys were also performed
by having two snorkelers swim along the entire length of each transect and record the species, quantity and phase (juvenile/adult) of fish observed.
Fish abundance and fish diversity were used as proxies of good fish nurseries and correlated with mangrove prop root density. No correlation was
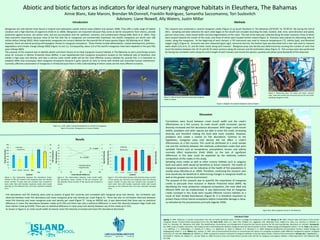
observed between mean fish abundance and mean mangrove prop root density per creek (Figure 5). There was also no correlation observed between
mean fish diversity and mean mangrove prop root density per creek (Figure 7). Using an ANOVA test, it was determined that there was no statistical
difference in mean fish abundance between creeks (p=0.724) and there was only a statistical difference in mean fish diversity between Page Creek and
Davis Harbor Creek (p=0.049). There was no statistical difference in mean prop root density between any of the creeks (p=0.151).
As shown in Figure 6, as creek mouth width increased, mean fish diversity increased and mean fish abundance decreased.
Figure 3. Diagram of a typical mangrove creek surveyed.
Figure 4. Measuring tape, YSI meter, pH meter, transect
rope, mask and snorkel and ammonia test kit all used while
sampling mangrove creeks.Figure 2. Map of South Eleuthera depicting mangrove
creeks surveyed.
0
10
20
30
40
50
60
0
50
100
150
200
250
300
350
400
Davis Harbor Wemyss Bight
Page
Location
FishAbundance
PropRootDensity
Density
Abundance
Figure 5. The relationship between fish abundance (mean
number of fish per transect) and mangrove prop root density
(mean number of prop roots per transect) was surveyed in
each creek. Bars with borders represent creeks with mouth
openings on the sheltered side. Error bars represent standard
error.
R² = 0.9649
R² = 0.6888
0
1
2
3
4
5
6
7
0
5
10
15
20
25
30
35
40
45
0 20 40 60 80
SpeciesDiversity
FishAbundance
Creek Mouth Width (m)
Avg Abundance
Avg Diversity
Figure 7. The relationship between fish diversity (mean number
of fish species per transect) and mangrove prop root density
(mean number of prop roots per transect) was surveyed in
each creek. Bars with borders represent creeks with mouth
openings on the sheltered side. Error bars represent standard
error.
0
1
2
3
4
5
6
7
0
50
100
150
200
250
300
350
400
Davis Harbor Wemyss Bight Page
SpeciesDiversity
PropRootDensity
Location
Density
Diversity
Figure 6. The relationships between creek mouth width,
fish abundance (mean number of fish per transect), and
fish diversity (mean number of fish species per transect) is
shown.
Literature Cited
Agardy, T. 1994. Advances in marine conservation: the role of marine protected areas. Trends in Ecology and Evolution 9: 267-270. Alongi, D. M. 2002. Present state and future of the world’s
mangrove forests. Environmental Conservation 29-3: 331-349. Beck, M.W., Heck, K.L., Able, K.W., Childers, D.L., Eggleston, D.B., Gillanders, B.M., Halpern, B., Hays, C.G., Hoshino, K., Minello, T.J.,
Orth, R.J., Sheridan, P.F., Weinstien, M.P. 2001. The identification, conservation, and management of estuarine and marine nurseries for fish and invertebrates. Bioscience 51: 633-641. Farnsworth,
E.J. 1998. Issues of spatial, taxonomic, and temporal scale in delineating links between mangrove diversity and ecosystem function. Global Ecology and Biography Letters 7: 15-25. Field, C. B.,Osborn,
J. G., Hoffman, L. L., Polsenberg, J. F., Ackerly, D. F., Berry, J. A., Bjorkman, O., Held, A., Matson, P. A., Mooney, H. A. 2004. Mangrove biodiversity and ecosystem function. Global Ecology and
Biogeography Letters 7: 3-14. Gilbert, A.J., Janssen, R. 1997. Use of environmental functions to communicate the values of a mangrove ecosystem under different management regimes. Ecological
Economics 25: 323-246. Patterson, O., Williams, K. 2009. A proposal to protect a network of mangrove wetlands in the East Abaco Creeks. Friends of the Environment. Verweij, M.C., Nagelkerken, I.,
de Graaff, D., Peeters, M., Bakker, E.J., van der Velde, G. 2006. Structure, food, and shade attract juvenile coral reef fish to mangrove and seagrass habitats: a field experiment. Inter-Research 306:
257-268.
Discussion
Correlations were found between creek mouth width and the creek’s
effectiveness as a fish nursery. As creek mouth width increased, species
diversity increased and fish abundance decreased. With larger creek mouth
widths, predators and other species are able to enter the creek, increasing
diversity and therefore making the food web more complex. However,
predators also create a control on fish abundance. Contrary to the
hypothesis, mangrove prop root density did not affect a creek’s
effectiveness as a fish nursery. This could be attributed to a small sample
size and the similarity between the relatively undisturbed creeks that were
sampled. Factors such as temperature, precipitation, terrain, and salinity
normally affect biodiversity (Field 2004), so the lack of significant
differences in the data could be explained by the relatively uniform
composition of the creeks in this study.
Sampling more creeks as well as other nursery habitats such as seagrass
beds and patch reefs would be beneficial as future research. The health of
mangrove ecosystems can be indicative of the health of fish populations in
nearby areas (Mumby et al. 2003). Therefore, continuing this research over
time would also be beneficial in determining changes in mangrove health as
well as the greater marine environment.
The purpose of this research was to quantify the importance of mangrove
creeks to persuade their inclusion in Marine Protected Areas (MPA). By
identifying the most productive mangrove ecosystems, the most ideal and
efficient MPA can be implemented. It was determined that all mangrove
creeks surveyed in this study were equally effective nursery habitats as a
result of their limited disturbances (Figure 8). It is therefore important to
protect these critical marine ecosystems before irreversible damage is done,
as indicated by the precautionary principle (Agardy 1994).
Annie Blanc, Kate Maroni, Brendan McDonnell, Franklin Rodriguez, Samantha Saccomanno, Tori Suslovitch
Advisors: Liane Nowell, Ally Waters, Justin Millar
Figure 8a,b. Red mangroves found in The Bahamas.
Figure 1a, c (left, right). Coastal development as a threat to mangroves.
Figure 1b (center). Mangroves as a nursery habitat.
Results
a
b
a cb
http://stevedeneef.photoshelter.com/image/I0000dqroj4z7Hqslaststands.kennedywarne.com/tag/mangroves
http://underwatercompetition.com/Competitions
/deep-indonesia.2011