SlideShare a Scribd company logo
54
Category AFE # Originator
Land Structures (All) 54 John Smith
Percent of Approved
Budget Used
100.0%
Difference between Approved
and Actual Cost
$0
Approved Cost Actual Cost
$28,732 $28,732
Select AFE #:
Project Name Date Approved
Labor 3/23/2018
Actual Cost Sub-Total: $198,210,742
Approved Cost Sub-Total: $470,849,402
Actual CapEx Sub-Total: $35,078,744
Approved CapEx Sub-Total: $188,120,529 Pull Down Equations:
Actual OpEx Sub-Total: $123,692,363
Approved OpEx Sub-Total: $282,728,873 Negative Numbers: ($XXXX)
AFE # Project Name: Originator Date Approved
Actual Cost Per
AFE
Approved Cost on
AFE
Percent of
Approved Budget
Used (%)
Dif. between
Approved and
Actual Per AFE
Actual CapEx
Total Per AFE
Approved CapEx
Total on AFE
Actual OpEx
Total Per AFE
Approved
OpEx Total on
AFE
1 Acquisition John Smith 9/18/2014 $18,072,613 $20,121,304 89.8% ($2,048,691) $4,392,009 $5,548,300 $13,680,604 $14,573,004
2 Acquisition Jane Doe 1/28/2015 $8,948,783 $15,889,717 56.3% ($6,940,934) $315,441 - $8,633,343 $15,889,717
3 Acquisition John Smith 3/2/2015 $17,318,976 $9,478,924 182.7% $7,840,052 $138,530 - $17,180,446 $9,478,924
4 Replacements Jane Doe 4/29/2015 $2,006,872 $2,421,725 82.9% ($414,853) $430,871 $918,000 $1,576,001 $1,503,725
5 Replacements John Smith 4/29/2015 $8,689,011 $9,574,369 90.8% ($885,358) $285,688 $3,150,000 $8,403,322 $6,424,369
6 Replacements Jane Doe 8/24/2015 $1,384,908 $1,986,583 69.7% ($601,675) ($5) - $1,384,913 $1,986,583
7 Acquisition John Smith 9/16/2015 $18,414,133 $33,422,110 55.1% ($15,007,977) $160,944 $20,319,300 $18,253,189 $13,102,810
8 Technology Jane Doe 11/18/2015 $2,633,292 $16,843,708 15.6% ($14,210,416) $1,815,093 $5,639,706 $818,199 $11,204,002
9 Acquisition John Smith 2/10/2017 $3,484,170 $12,907,800 27.0% ($9,423,630) ($224,864) $3,125,160 $3,709,035 $9,782,640
10 Acquisition Jane Doe 3/24/2017 $3,207,231 $11,888,480 27.0% ($8,681,249) ($251,816) $2,087,440 $3,459,047 $9,801,040
11 Acquisition John Smith 6/19/2017 $9,033,990 $29,622,098 30.5% ($20,588,108) $252,188 - $8,781,801 $29,622,098
12 Acquisition Jane Doe 6/19/2017 $1,984,687 $6,220,800 31.9% ($4,236,113) ($3,775) $2,184,000 $1,988,461 $4,036,800
13 Acquisition John Smith 6/19/2017 $4,704,315 $25,668,448 18.3% ($20,964,133) ($174,645) $4,506,400 $4,878,960 $21,162,048
14 Maintenance Jane Doe 6/19/2017 $2,473,466 $3,742,161 66.1% ($1,268,695) $2,467,667 $3,705,250 $5,799 $36,911
15 Acquisition John Smith 7/18/2017 $2,115,580 $8,826,023 24.0% ($6,710,443) ($9,060) - $2,124,640 $8,826,023
16 Acquisition Jane Doe 7/18/2017 $1,293,298 $4,855,201 26.6% ($3,561,903) $4,544 - $1,288,754 $4,855,201
17 Acquisition John Smith 7/18/2017 $1,621,150 $6,015,016 27.0% ($4,393,866) $48,107 - $1,573,043 $6,015,016
18 Acquisition Jane Doe 9/7/2017 $1,045,471 $4,883,985 21.4% ($3,838,514) ($1,981) - $1,047,453 $4,883,985
19 Maintenance John Smith 9/18/2017 $2,350,863 $3,740,049 62.9% ($1,389,186) $2,350,863 $3,705,250 - $34,799
20 Acquisition Jane Doe 10/17/2017 $7,863,737 $31,458,504 25.0% ($23,594,767) ($1,169,915) - $9,033,652 $31,458,504
21 Acquisition John Smith 10/17/2017 $14,109,598 $42,503,949 33.2% ($28,394,351) $53,935 $22,197,000 $14,055,663 $20,306,949
22 Maintenance Jane Doe 1/3/2018 $2,461,898 $2,800,516 87.9% ($338,618) $2,461,898 $2,763,016 - $37,500
YRC Freight AFE Reporting Database
Manually Entered Amounts:
All Information shown here is fictitious.
Equipment
Actual Cost Sub-Total: $78,907
Approved Cost Sub-Total: $46,334,642
Actual CapEx Sub-Total: $57,896
Approved CapEx Sub-Total: $38,669,439 Pull Down Equations:
Actual OpEx Sub-Total: $21,011
Approved OpEx Sub-Total: $7,665,203 Negative Numbers: ($XXXX)
AFE # Project Name: Originator Date Approved
Actual Cost Per
AFE
Approved Cost
on AFE
Percent of Approved
Budget Used (%)
Dif. between Approved
and Actual Per AFE
Actual CapEx
Total Per AFE
Approved
CapEx Total on
AFE
Actual OpEx
Total Per AFE
Approved
OpEx Total on
AFE
23 Upgrades John Smith 2/2/2015 - $7,237,080 - - - $6,917,627 - $319,453
24 Software Jane Doe 3/27/2016 $19,580 $16,500,926 0.1% ($16,481,346) - $13,093,187 $19,580 $3,407,739
25 Software John Smith 5/3/2017 $762 $900,000 0.1% ($899,238) - $300,000 $762 $600,000
26 Upgrades Jane Doe 10/18/2017 $48,000 $2,021,872 2.4% ($1,973,872) $48,000 $1,617,499 - $404,373
27 Replacements John Smith 2/26/2018 $669 $8,230,000 0.01% ($8,229,331) - $5,741,000 $669 $2,489,000
28 Upgrades Jane Doe 7/25/2018 - $7,296,264 - - - $7,236,264 - $60,000
29 Upgrades John Smith 1/22/2019 - $90,000 - - - $72,000 - $18,000
30 Upgrades Jane Doe 2/26/2019 - $1,330,400 - - - $1,330,400 - -
31 Software John Smith 3/25/2019 - $712,000 - - - $656,000 - $56,000
32 Replacements Jane Doe 3/27/2019 - $1,191,623 - - - $1,017,623 - $174,000
33 Software John Smith 4/24/2019 - $24,288 - - - - - $24,288
34 Software Jane Doe 4/25/2019 - $50,850 - - - - - $50,850
35 Replacements John Smith 6/14/2019 $9,896 $749,339 1.3% ($739,443) $9,896 $687,839 - $61,500
YRC Freight AFE Reporting Database
IT Application Development & Infrastructure All Information shown here is fictitious.
Manually Entered Amount:
Actual Cost Sub-Total: $14,414,086
Approved Cost Sub-Total: $24,723,652
Actual CapEx Sub-Total: $8,568,442
Approved CapEx Sub-Total: $8,479,784 Pull Down Equations:
Actual OpEx Sub-Total: $5,732,705
Approved OpEx Sub-Total: $16,243,868 Negative Numbers: ($XXXX)
AFE # Project Name: Originator Date Approved
Actual Cost Per
AFE
Approved
Cost on AFE
Percent of
Approved Budget
Used (%)
Diff. between
Approved and
Actual Per AFE
Actual CapEx
Total Per AFE
Approved
CapEx Total on
AFE
Actual OpEx
Total Per AFE
Approved
OpEx Total on
AFE
36 Replacement Documentation John Smith 8/8/2013 $5,246,033 $664,776 789.1% $4,581,257 ($380,333) $16,500 $5,626,366 $648,276
37 Repairs Jane Doe 1/12/2018 $159,344 $165,477 96.3% ($6,133) $159,344 $165,477 - -
38 Labor John Smith 1/12/2018 $115,664 $105,864 109.3% $9,800 $115,664 $105,864 - -
39 Labor & Repairs Jane Doe 1/16/2018 $43,954 $43,954 100.0% - $43,954 $43,954 - -
40 Labor and Repairs John Smith 1/16/2018 $47,135 $47,135 100.0% - $47,135 $47,135 - -
41 Leasing Jane Doe 1/23/2018 $74,008 $12,335,947 0.6% ($12,261,939) - - $74,008 $12,335,947
42 Labor John Smith 1/23/2018 $160,030 $160,030 100.0% - $160,030 $160,030 - -
43 Repairs Jane Doe 1/24/2018 $15,154 $12,754 118.8% $2,400 $15,154 $12,754 - -
44 Labor John Smith 1/29/2018 $32,032 $32,032 100.0% - $32,032 $32,032 - -
45 Labor Jane Doe 2/7/2018 $88,193 $88,193 100.0% - $88,193 $88,193 - -
46 Repairs John Smith 2/8/2018 $55,043 $55,043 100.0% - $55,043 $55,043 - -
47 Repairs Jane Doe 2/21/2018 $74,827 $69,628 107.5% $5,199 $74,827 $69,628 - -
48 Labor John Smith 2/21/2018 $33,630 $33,630 100.0% - $33,630 $33,630 - -
49 Labor Jane Doe 2/21/2018 $43,414 $43,414 100.0% - $43,414 $43,414 - -
50 Labor John Smith 2/22/2018 $22,400 $22,400 100.0% - $22,400 $22,400 - -
51 Labor Jane Doe 2/23/2018 $90,064 $90,064 100.0% - $90,064 $90,064 - -
52 Replacements John Smith 2/23/2018 $26,280 $22,411 117.3% $3,869 $26,280 $22,411 - -
53 Replacements Jane Doe 2/26/2018 $19,312 $19,312 100.0% - $19,312 $19,312 - -
54 Labor John Smith 3/23/2018 $28,732 $28,732 100.0% - $28,732 $28,732 - -
55 Labor Jane Doe 3/27/2018 $214,829 $204,929 104.8% $9,900 $214,829 $204,929 - -
56 Labor & Cleanup John Smith 3/28/2018 $24,540 $21,050 116.6% $3,490 $24,540 $21,050 - -
57 Repairs Jane Doe 3/28/2018 $13,815 $19,469 71.0% ($5,654) $11,185 $18,000 $2,631 $1,469
Manually Entered Amount:
YRC Freight AFE Reporting Database
Land Structures (All) All Information shown here is fictitious.
Actual Cost Sub-Total: $9,560,956
Approved Cost Sub-Total: $63,567,143
Actual CapEx Sub-Total: $5,524,253
Approved CapEx Sub-Total: $10,964,745 Pull Down Equations:
Actual OpEx Sub-Total: $4,036,703
Approved OpEx Sub-Total: $52,602,398 Negative Numbers: ($XXXX)
AFE # Project Name: Originator Date Approved
Actual Cost Per
AFE
Approved Cost
on AFE
Percent of Approved
Budget Used (%)
Dif. between Approved
and Actual Per AFE
Actual CapEx
Total Per AFE
Approved
CapEx Total
on AFE
Actual OpEx
Total Per AFE
Approved
OpEx Total on
AFE
58 Upgrades John Smith 8/20/2015 ($3,116) $10,936,676 -0.03% ($10,939,792) ($18,921) $312,001 $15,805 $10,624,675
59 Software Jane Doe 12/17/2015 $930,000 $4,000,000 23.3% ($3,070,000) - - $930,000 $4,000,000
60 Software John Smith 1/16/2017 $5,839,664 $13,713,164 42.6% ($7,873,500) $3,795,690 $6,887,902 $2,043,974 $6,825,262
61 Software Jane Doe 11/1/2017 $391,958 $14,438,467 2.7% ($14,046,509) $539,831 $377,417 ($147,873) $14,061,050
62 Redesign John Smith 12/13/2017 $2,405,440 $17,719,456 13.6% ($15,314,016) $1,210,878 $3,333,760 $1,194,562 $14,385,696
63 Software Jane Doe 5/2/2018 ($2,991) $2,411,380 -0.1% ($2,414,371) ($3,225) $53,665 $234 $2,357,715
64 Software John Smith 3/6/2019 - $348,000 - - - - - $348,000
Manually Entered Amount:
All Information shown here is fictitious.
YRC Freight AFE Reporting Database
Operations
Actual Cost Sub-Total: $16,995,423
Approved Cost Sub-Total: $19,690,555
Actual CapEx Sub-Total: $10,585,196
Approved CapEx Sub-Total: $13,279,866 Pull Down Equations:
Actual OpEx Sub-Total: $7,010,914
Approved OpEx Sub-Total: $6,410,689 Negative Numbers: ($XXXX)
AFE # Project Name: Originator Date Approved
Actual Cost Per
AFE
Approved
Cost on AFE
Percent of Approved
Budget Used (%)
Dif. between Approved
and Actual Per AFE
Actual CapEx Total
Per AFE
Approved
CapEx Total
on AFE
Actual OpEx
Total Per AFE
Approved
OpEx Total on
AFE
65 Leasing John Smith 8/27/2015 $4,193,503 $4,095,497 102.4% $98,006 $462,801 $583,179 $3,730,702 $3,512,318
66 Leasing Jane Doe 1/26/2016 $2,985,529 $2,764,860 108.0% $220,669 ($0) - $2,985,529 $2,764,860
67 Training John Smith 4/16/2018 $12,100 $22,835 53.0% ($10,735) - - $12,100 $22,835
68 Software Jane Doe 4/18/2018 $46,067 $46,067 100.0% - $27,355 $46,067 - -
69 Software John Smith 4/24/2018 $31,440 $23,000 136.7% $8,440 - - $31,440 $23,000
70 Security Jane Doe 5/3/2018 $27,456 $27,456 100.0% - - $27,456 $5,165 -
71 Buyout John Smith 5/14/2018 $3,554,000 $4,174,809 85.1% ($620,809) $3,554,000 $4,174,809 - -
72 Security Jane Doe 6/21/2018 $30,899 $30,301 102.0% $598 - $30,301 $30,899 -
73 Security John Smith 7/2/2018 $26,833 $26,832 100.0% $1 - $26,832 $26,833 -
74 Security Jane Doe 7/9/2018 $19,967 $22,426 89.0% ($2,459) - $22,426 $25,576 -
75 Security John Smith 7/9/2018 $23,822 $19,059 125.0% $4,763 $19,059 $19,059 $4,763 -
76 Security Jane Doe 8/1/2018 $32,306 $32,306 100.0% ($0) - $32,306 $32,306 -
77 Leasing John Smith 8/17/2018 $5,065,995 $5,847,200 86.6% ($781,205) $5,065,995 $5,847,200 - -
78 Software Jane Doe 8/22/2018 $98,254 $97,181 101.1% $1,073 $97,258 $97,181 $997 -
79 Leasing John Smith 8/30/2018 $470 $139,299 0.3% ($138,829) - $139,299 $470 -
80 Security Jane Doe 9/13/2018 $12,538 $13,751 91.2% ($1,213) - $13,751 $12,538 -
81 Security John Smith 9/24/2018 $636,081 $636,081 100.0% - $1,272,161 $636,081 - -
82 Build out Jane Doe 10/10/2018 $4,448 $14,300 31.1% ($9,852) - - $4,448 $14,300
83 Build out John Smith 10/18/2018 $50,401 $51,950 97.0% ($1,549) $50,401 $51,950 - -
84 Security Jane Doe 10/30/2018 $44,183 $44,723 98.8% ($540) - $44,723 $44,183 -
85 Training John Smith 12/13/2018 $37,368 $59,580 62.7% ($22,212) - - $37,368 $59,580
86 Software Jane Doe 12/18/2018 $43,612 $47,700 91.4% ($4,088) $36,166 $47,700 $7,446 -
Manually Entered Amount:
All Information shown here is fictitious.
YRC Freight AFE Reporting Database
Other Non-Recurring

More Related Content

What's hot

Anthem, Inc. Reports Record Second Quarter Results
 	Anthem, Inc. Reports Record Second Quarter Results 	Anthem, Inc. Reports Record Second Quarter Results
Anthem, Inc. Reports Record Second Quarter Results
finance4
 
monsanto Q42006EarningsRelease
monsanto Q42006EarningsReleasemonsanto Q42006EarningsRelease
monsanto Q42006EarningsRelease
finance28
 
fr06_is-nongaap
fr06_is-nongaapfr06_is-nongaap
fr06_is-nongaap
finance44
 
clearchannel 318
clearchannel  318clearchannel  318
clearchannel 318
finance31
 
TenetAnnouncesResultsforFirstQuarterEndedMarch3120
TenetAnnouncesResultsforFirstQuarterEndedMarch3120TenetAnnouncesResultsforFirstQuarterEndedMarch3120
TenetAnnouncesResultsforFirstQuarterEndedMarch3120
finance42
 
Grendene - 2nd Annual Brazil Conference Itaú Securies
Grendene - 2nd Annual Brazil Conference Itaú SecuriesGrendene - 2nd Annual Brazil Conference Itaú Securies
Grendene - 2nd Annual Brazil Conference Itaú Securies
Grendene
 
Salary study
Salary studySalary study
Salary study
Mario Braile
 
clearchannel 28
clearchannel 28clearchannel 28
clearchannel 28
finance31
 
3q07_Supplement
3q07_Supplement3q07_Supplement
3q07_Supplement
finance27
 
Conta minjangos
Conta minjangosConta minjangos
Conta minjangos
Daucus
 
Third Quarter 2006 Earnings Presentation
Third Quarter 2006 Earnings PresentationThird Quarter 2006 Earnings Presentation
Third Quarter 2006 Earnings Presentation
QuarterlyEarningsReports3
 
consoliddated edison 2000_annual
consoliddated edison 2000_annual consoliddated edison 2000_annual
consoliddated edison 2000_annual
finance20
 
tenet healthcare Q206Earnings_5_
tenet healthcare  Q206Earnings_5_tenet healthcare  Q206Earnings_5_
tenet healthcare Q206Earnings_5_
finance42
 
danaher 08_3Q_Release
danaher 08_3Q_Releasedanaher 08_3Q_Release
danaher 08_3Q_Release
finance24
 

What's hot (14)

Anthem, Inc. Reports Record Second Quarter Results
 	Anthem, Inc. Reports Record Second Quarter Results 	Anthem, Inc. Reports Record Second Quarter Results
Anthem, Inc. Reports Record Second Quarter Results
 
monsanto Q42006EarningsRelease
monsanto Q42006EarningsReleasemonsanto Q42006EarningsRelease
monsanto Q42006EarningsRelease
 
fr06_is-nongaap
fr06_is-nongaapfr06_is-nongaap
fr06_is-nongaap
 
clearchannel 318
clearchannel  318clearchannel  318
clearchannel 318
 
TenetAnnouncesResultsforFirstQuarterEndedMarch3120
TenetAnnouncesResultsforFirstQuarterEndedMarch3120TenetAnnouncesResultsforFirstQuarterEndedMarch3120
TenetAnnouncesResultsforFirstQuarterEndedMarch3120
 
Grendene - 2nd Annual Brazil Conference Itaú Securies
Grendene - 2nd Annual Brazil Conference Itaú SecuriesGrendene - 2nd Annual Brazil Conference Itaú Securies
Grendene - 2nd Annual Brazil Conference Itaú Securies
 
Salary study
Salary studySalary study
Salary study
 
clearchannel 28
clearchannel 28clearchannel 28
clearchannel 28
 
3q07_Supplement
3q07_Supplement3q07_Supplement
3q07_Supplement
 
Conta minjangos
Conta minjangosConta minjangos
Conta minjangos
 
Third Quarter 2006 Earnings Presentation
Third Quarter 2006 Earnings PresentationThird Quarter 2006 Earnings Presentation
Third Quarter 2006 Earnings Presentation
 
consoliddated edison 2000_annual
consoliddated edison 2000_annual consoliddated edison 2000_annual
consoliddated edison 2000_annual
 
tenet healthcare Q206Earnings_5_
tenet healthcare  Q206Earnings_5_tenet healthcare  Q206Earnings_5_
tenet healthcare Q206Earnings_5_
 
danaher 08_3Q_Release
danaher 08_3Q_Releasedanaher 08_3Q_Release
danaher 08_3Q_Release
 

Similar to AFE data base work example

Principals of Business Finance
Principals of Business FinancePrincipals of Business Finance
Principals of Business Finance
Kathleen Boushele
 
Intertech Public Land Management Report Tables: Nevada
Intertech Public Land Management Report Tables: NevadaIntertech Public Land Management Report Tables: Nevada
Intertech Public Land Management Report Tables: Nevada
American Lands Council
 
Ira client_sample2014-09-18_t12_03_32
 Ira client_sample2014-09-18_t12_03_32 Ira client_sample2014-09-18_t12_03_32
Ira client_sample2014-09-18_t12_03_32
Ranga Chary, MBA, CFP
 
KMT Sample 7.16
KMT Sample 7.16KMT Sample 7.16
KMT Sample 7.16
Kevin Thompson
 
FORK THE PORKZane & Brian1Assumptions6 .docx
FORK THE PORKZane & Brian1Assumptions6 .docxFORK THE PORKZane & Brian1Assumptions6 .docx
FORK THE PORKZane & Brian1Assumptions6 .docx
budbarber38650
 
Financial forecast
Financial forecastFinancial forecast
Financial forecast
MalenaApplewhite
 
Final Team Analysis - Linkedin
Final Team Analysis - LinkedinFinal Team Analysis - Linkedin
Final Team Analysis - Linkedin
Eunice Fei Jin Shi
 
ShootForMars
ShootForMarsShootForMars
ShootForMars
Julia Mallinak
 
Sample Investment PropertyAverage InlandSan Diego HomeASSUMPTION.docx
Sample Investment PropertyAverage InlandSan Diego HomeASSUMPTION.docxSample Investment PropertyAverage InlandSan Diego HomeASSUMPTION.docx
Sample Investment PropertyAverage InlandSan Diego HomeASSUMPTION.docx
agnesdcarey33086
 
2007 Q3 Google Earnings Slides
2007 Q3 Google Earnings Slides2007 Q3 Google Earnings Slides
2007 Q3 Google Earnings Slides
earningsreport
 
2007 Q3 Google Earnings Slides
2007 Q3 Google Earnings Slides2007 Q3 Google Earnings Slides
2007 Q3 Google Earnings Slides
QuarterlyEarningsReports
 
Google 2008 Q1 Earnings Slides
Google 2008 Q1 Earnings SlidesGoogle 2008 Q1 Earnings Slides
Google 2008 Q1 Earnings Slides
earningsreport
 
2008 Q1 Google Earnings Slides
2008 Q1 Google Earnings Slides2008 Q1 Google Earnings Slides
2008 Q1 Google Earnings Slides
QuarterlyEarningsReports
 
Ctia Survey Midyear 2009 Graphics
Ctia Survey Midyear 2009 GraphicsCtia Survey Midyear 2009 Graphics
Ctia Survey Midyear 2009 Graphics
Marketingfacts
 
Az intertech-preliminary-draft-public-land-mgmt-task-force-report-tables
Az intertech-preliminary-draft-public-land-mgmt-task-force-report-tablesAz intertech-preliminary-draft-public-land-mgmt-task-force-report-tables
Az intertech-preliminary-draft-public-land-mgmt-task-force-report-tables
American Lands Council
 
C3 comp redesign 6-3-13 (2)
C3 comp redesign  6-3-13 (2)C3 comp redesign  6-3-13 (2)
C3 comp redesign 6-3-13 (2)
Mark Wolkove
 
Profit blueprint
Profit blueprintProfit blueprint
Market watch jul 2019 frank yu oakville
Market watch jul 2019 frank yu oakvilleMarket watch jul 2019 frank yu oakville
Market watch jul 2019 frank yu oakville
Frank Yu
 
TORONTO REAL ESTATE BOARD'S -- MARKET WATCH - JULY 2019
TORONTO REAL ESTATE BOARD'S -- MARKET WATCH - JULY 2019TORONTO REAL ESTATE BOARD'S -- MARKET WATCH - JULY 2019
TORONTO REAL ESTATE BOARD'S -- MARKET WATCH - JULY 2019
Shawn Venasse
 
Market watch jul 2019 frank yu oakville
Market watch jul 2019 frank yu oakvilleMarket watch jul 2019 frank yu oakville
Market watch jul 2019 frank yu oakville
Frank Yu
 

Similar to AFE data base work example (20)

Principals of Business Finance
Principals of Business FinancePrincipals of Business Finance
Principals of Business Finance
 
Intertech Public Land Management Report Tables: Nevada
Intertech Public Land Management Report Tables: NevadaIntertech Public Land Management Report Tables: Nevada
Intertech Public Land Management Report Tables: Nevada
 
Ira client_sample2014-09-18_t12_03_32
 Ira client_sample2014-09-18_t12_03_32 Ira client_sample2014-09-18_t12_03_32
Ira client_sample2014-09-18_t12_03_32
 
KMT Sample 7.16
KMT Sample 7.16KMT Sample 7.16
KMT Sample 7.16
 
FORK THE PORKZane & Brian1Assumptions6 .docx
FORK THE PORKZane & Brian1Assumptions6 .docxFORK THE PORKZane & Brian1Assumptions6 .docx
FORK THE PORKZane & Brian1Assumptions6 .docx
 
Financial forecast
Financial forecastFinancial forecast
Financial forecast
 
Final Team Analysis - Linkedin
Final Team Analysis - LinkedinFinal Team Analysis - Linkedin
Final Team Analysis - Linkedin
 
ShootForMars
ShootForMarsShootForMars
ShootForMars
 
Sample Investment PropertyAverage InlandSan Diego HomeASSUMPTION.docx
Sample Investment PropertyAverage InlandSan Diego HomeASSUMPTION.docxSample Investment PropertyAverage InlandSan Diego HomeASSUMPTION.docx
Sample Investment PropertyAverage InlandSan Diego HomeASSUMPTION.docx
 
2007 Q3 Google Earnings Slides
2007 Q3 Google Earnings Slides2007 Q3 Google Earnings Slides
2007 Q3 Google Earnings Slides
 
2007 Q3 Google Earnings Slides
2007 Q3 Google Earnings Slides2007 Q3 Google Earnings Slides
2007 Q3 Google Earnings Slides
 
Google 2008 Q1 Earnings Slides
Google 2008 Q1 Earnings SlidesGoogle 2008 Q1 Earnings Slides
Google 2008 Q1 Earnings Slides
 
2008 Q1 Google Earnings Slides
2008 Q1 Google Earnings Slides2008 Q1 Google Earnings Slides
2008 Q1 Google Earnings Slides
 
Ctia Survey Midyear 2009 Graphics
Ctia Survey Midyear 2009 GraphicsCtia Survey Midyear 2009 Graphics
Ctia Survey Midyear 2009 Graphics
 
Az intertech-preliminary-draft-public-land-mgmt-task-force-report-tables
Az intertech-preliminary-draft-public-land-mgmt-task-force-report-tablesAz intertech-preliminary-draft-public-land-mgmt-task-force-report-tables
Az intertech-preliminary-draft-public-land-mgmt-task-force-report-tables
 
C3 comp redesign 6-3-13 (2)
C3 comp redesign  6-3-13 (2)C3 comp redesign  6-3-13 (2)
C3 comp redesign 6-3-13 (2)
 
Profit blueprint
Profit blueprintProfit blueprint
Profit blueprint
 
Market watch jul 2019 frank yu oakville
Market watch jul 2019 frank yu oakvilleMarket watch jul 2019 frank yu oakville
Market watch jul 2019 frank yu oakville
 
TORONTO REAL ESTATE BOARD'S -- MARKET WATCH - JULY 2019
TORONTO REAL ESTATE BOARD'S -- MARKET WATCH - JULY 2019TORONTO REAL ESTATE BOARD'S -- MARKET WATCH - JULY 2019
TORONTO REAL ESTATE BOARD'S -- MARKET WATCH - JULY 2019
 
Market watch jul 2019 frank yu oakville
Market watch jul 2019 frank yu oakvilleMarket watch jul 2019 frank yu oakville
Market watch jul 2019 frank yu oakville
 

Recently uploaded

NIMA2024 | De toegevoegde waarde van DEI en ESG in campagnes | Nathalie Lam |...
NIMA2024 | De toegevoegde waarde van DEI en ESG in campagnes | Nathalie Lam |...NIMA2024 | De toegevoegde waarde van DEI en ESG in campagnes | Nathalie Lam |...
NIMA2024 | De toegevoegde waarde van DEI en ESG in campagnes | Nathalie Lam |...
BBPMedia1
 
Discover the Beauty and Functionality of The Expert Remodeling Service
Discover the Beauty and Functionality of The Expert Remodeling ServiceDiscover the Beauty and Functionality of The Expert Remodeling Service
Discover the Beauty and Functionality of The Expert Remodeling Service
obriengroupinc04
 
Sustainable Logistics for Cost Reduction_ IPLTech Electric's Eco-Friendly Tra...
Sustainable Logistics for Cost Reduction_ IPLTech Electric's Eco-Friendly Tra...Sustainable Logistics for Cost Reduction_ IPLTech Electric's Eco-Friendly Tra...
Sustainable Logistics for Cost Reduction_ IPLTech Electric's Eco-Friendly Tra...
IPLTech Electric
 
Unlocking WhatsApp Marketing with HubSpot: Integrating Messaging into Your Ma...
Unlocking WhatsApp Marketing with HubSpot: Integrating Messaging into Your Ma...Unlocking WhatsApp Marketing with HubSpot: Integrating Messaging into Your Ma...
Unlocking WhatsApp Marketing with HubSpot: Integrating Messaging into Your Ma...
Niswey
 
Ellen Burstyn: From Detroit Dreamer to Hollywood Legend | CIO Women Magazine
Ellen Burstyn: From Detroit Dreamer to Hollywood Legend | CIO Women MagazineEllen Burstyn: From Detroit Dreamer to Hollywood Legend | CIO Women Magazine
Ellen Burstyn: From Detroit Dreamer to Hollywood Legend | CIO Women Magazine
CIOWomenMagazine
 
Satta Matka Dpboss Kalyan Matka Results Kalyan Chart
Satta Matka Dpboss Kalyan Matka Results Kalyan ChartSatta Matka Dpboss Kalyan Matka Results Kalyan Chart
Satta Matka Dpboss Kalyan Matka Results Kalyan Chart
Satta Matka Dpboss Kalyan Matka Results
 
Prescriptive analytics BA4206 Anna University PPT
Prescriptive analytics BA4206 Anna University PPTPrescriptive analytics BA4206 Anna University PPT
Prescriptive analytics BA4206 Anna University PPT
Freelance
 
Satta Matka Dpboss Kalyan Matka Results Kalyan Chart
Satta Matka Dpboss Kalyan Matka Results Kalyan ChartSatta Matka Dpboss Kalyan Matka Results Kalyan Chart
Satta Matka Dpboss Kalyan Matka Results Kalyan Chart
Satta Matka Dpboss Kalyan Matka Results
 
Cover Story - China's Investment Leader - Dr. Alyce SU
Cover Story - China's Investment Leader - Dr. Alyce SUCover Story - China's Investment Leader - Dr. Alyce SU
Cover Story - China's Investment Leader - Dr. Alyce SU
msthrill
 
Lukas Rycek - GreenChemForCE - project structure.pptx
Lukas Rycek - GreenChemForCE - project structure.pptxLukas Rycek - GreenChemForCE - project structure.pptx
Lukas Rycek - GreenChemForCE - project structure.pptx
pavelborek
 
CULR Spring 2024 Journal.pdf testing for duke
CULR Spring 2024 Journal.pdf testing for dukeCULR Spring 2024 Journal.pdf testing for duke
CULR Spring 2024 Journal.pdf testing for duke
ZevinAttisha
 
Satta Matka Dpboss Kalyan Matka Results Kalyan Chart
Satta Matka Dpboss Kalyan Matka Results Kalyan ChartSatta Matka Dpboss Kalyan Matka Results Kalyan Chart
Satta Matka Dpboss Kalyan Matka Results Kalyan Chart
Satta Matka Dpboss Kalyan Matka Results
 
Pro Tips for Effortless Contract Management
Pro Tips for Effortless Contract ManagementPro Tips for Effortless Contract Management
Pro Tips for Effortless Contract Management
Eternity Paralegal Services
 
Satta Matka Dpboss Kalyan Matka Results Kalyan Chart
Satta Matka Dpboss Kalyan Matka Results Kalyan ChartSatta Matka Dpboss Kalyan Matka Results Kalyan Chart
Satta Matka Dpboss Kalyan Matka Results Kalyan Chart
Satta Matka Dpboss Kalyan Matka Results
 
The Steadfast and Reliable Bull: Taurus Zodiac Sign
The Steadfast and Reliable Bull: Taurus Zodiac SignThe Steadfast and Reliable Bull: Taurus Zodiac Sign
The Steadfast and Reliable Bull: Taurus Zodiac Sign
my Pandit
 
High-Quality IPTV Monthly Subscription for $15
High-Quality IPTV Monthly Subscription for $15High-Quality IPTV Monthly Subscription for $15
High-Quality IPTV Monthly Subscription for $15
advik4387
 
欧洲杯投注-欧洲杯投注外围盘口-欧洲杯投注盘口app|【​网址​🎉ac22.net🎉​】
欧洲杯投注-欧洲杯投注外围盘口-欧洲杯投注盘口app|【​网址​🎉ac22.net🎉​】欧洲杯投注-欧洲杯投注外围盘口-欧洲杯投注盘口app|【​网址​🎉ac22.net🎉​】
欧洲杯投注-欧洲杯投注外围盘口-欧洲杯投注盘口app|【​网址​🎉ac22.net🎉​】
concepsionchomo153
 
Satta Matka Dpboss Kalyan Matka Results Kalyan Chart
Satta Matka Dpboss Kalyan Matka Results Kalyan ChartSatta Matka Dpboss Kalyan Matka Results Kalyan Chart
Satta Matka Dpboss Kalyan Matka Results Kalyan Chart
Satta Matka Dpboss Kalyan Matka Results
 
2024.06 CPMN Cambridge - Beyond Now-Next-Later.pdf
2024.06 CPMN Cambridge - Beyond Now-Next-Later.pdf2024.06 CPMN Cambridge - Beyond Now-Next-Later.pdf
2024.06 CPMN Cambridge - Beyond Now-Next-Later.pdf
Cambridge Product Management Network
 
Satta Matka Dpboss Kalyan Matka Results Kalyan Chart
Satta Matka Dpboss Kalyan Matka Results Kalyan ChartSatta Matka Dpboss Kalyan Matka Results Kalyan Chart
Satta Matka Dpboss Kalyan Matka Results Kalyan Chart
Satta Matka Dpboss Kalyan Matka Results
 

Recently uploaded (20)

NIMA2024 | De toegevoegde waarde van DEI en ESG in campagnes | Nathalie Lam |...
NIMA2024 | De toegevoegde waarde van DEI en ESG in campagnes | Nathalie Lam |...NIMA2024 | De toegevoegde waarde van DEI en ESG in campagnes | Nathalie Lam |...
NIMA2024 | De toegevoegde waarde van DEI en ESG in campagnes | Nathalie Lam |...
 
Discover the Beauty and Functionality of The Expert Remodeling Service
Discover the Beauty and Functionality of The Expert Remodeling ServiceDiscover the Beauty and Functionality of The Expert Remodeling Service
Discover the Beauty and Functionality of The Expert Remodeling Service
 
Sustainable Logistics for Cost Reduction_ IPLTech Electric's Eco-Friendly Tra...
Sustainable Logistics for Cost Reduction_ IPLTech Electric's Eco-Friendly Tra...Sustainable Logistics for Cost Reduction_ IPLTech Electric's Eco-Friendly Tra...
Sustainable Logistics for Cost Reduction_ IPLTech Electric's Eco-Friendly Tra...
 
Unlocking WhatsApp Marketing with HubSpot: Integrating Messaging into Your Ma...
Unlocking WhatsApp Marketing with HubSpot: Integrating Messaging into Your Ma...Unlocking WhatsApp Marketing with HubSpot: Integrating Messaging into Your Ma...
Unlocking WhatsApp Marketing with HubSpot: Integrating Messaging into Your Ma...
 
Ellen Burstyn: From Detroit Dreamer to Hollywood Legend | CIO Women Magazine
Ellen Burstyn: From Detroit Dreamer to Hollywood Legend | CIO Women MagazineEllen Burstyn: From Detroit Dreamer to Hollywood Legend | CIO Women Magazine
Ellen Burstyn: From Detroit Dreamer to Hollywood Legend | CIO Women Magazine
 
Satta Matka Dpboss Kalyan Matka Results Kalyan Chart
Satta Matka Dpboss Kalyan Matka Results Kalyan ChartSatta Matka Dpboss Kalyan Matka Results Kalyan Chart
Satta Matka Dpboss Kalyan Matka Results Kalyan Chart
 
Prescriptive analytics BA4206 Anna University PPT
Prescriptive analytics BA4206 Anna University PPTPrescriptive analytics BA4206 Anna University PPT
Prescriptive analytics BA4206 Anna University PPT
 
Satta Matka Dpboss Kalyan Matka Results Kalyan Chart
Satta Matka Dpboss Kalyan Matka Results Kalyan ChartSatta Matka Dpboss Kalyan Matka Results Kalyan Chart
Satta Matka Dpboss Kalyan Matka Results Kalyan Chart
 
Cover Story - China's Investment Leader - Dr. Alyce SU
Cover Story - China's Investment Leader - Dr. Alyce SUCover Story - China's Investment Leader - Dr. Alyce SU
Cover Story - China's Investment Leader - Dr. Alyce SU
 
Lukas Rycek - GreenChemForCE - project structure.pptx
Lukas Rycek - GreenChemForCE - project structure.pptxLukas Rycek - GreenChemForCE - project structure.pptx
Lukas Rycek - GreenChemForCE - project structure.pptx
 
CULR Spring 2024 Journal.pdf testing for duke
CULR Spring 2024 Journal.pdf testing for dukeCULR Spring 2024 Journal.pdf testing for duke
CULR Spring 2024 Journal.pdf testing for duke
 
Satta Matka Dpboss Kalyan Matka Results Kalyan Chart
Satta Matka Dpboss Kalyan Matka Results Kalyan ChartSatta Matka Dpboss Kalyan Matka Results Kalyan Chart
Satta Matka Dpboss Kalyan Matka Results Kalyan Chart
 
Pro Tips for Effortless Contract Management
Pro Tips for Effortless Contract ManagementPro Tips for Effortless Contract Management
Pro Tips for Effortless Contract Management
 
Satta Matka Dpboss Kalyan Matka Results Kalyan Chart
Satta Matka Dpboss Kalyan Matka Results Kalyan ChartSatta Matka Dpboss Kalyan Matka Results Kalyan Chart
Satta Matka Dpboss Kalyan Matka Results Kalyan Chart
 
The Steadfast and Reliable Bull: Taurus Zodiac Sign
The Steadfast and Reliable Bull: Taurus Zodiac SignThe Steadfast and Reliable Bull: Taurus Zodiac Sign
The Steadfast and Reliable Bull: Taurus Zodiac Sign
 
High-Quality IPTV Monthly Subscription for $15
High-Quality IPTV Monthly Subscription for $15High-Quality IPTV Monthly Subscription for $15
High-Quality IPTV Monthly Subscription for $15
 
欧洲杯投注-欧洲杯投注外围盘口-欧洲杯投注盘口app|【​网址​🎉ac22.net🎉​】
欧洲杯投注-欧洲杯投注外围盘口-欧洲杯投注盘口app|【​网址​🎉ac22.net🎉​】欧洲杯投注-欧洲杯投注外围盘口-欧洲杯投注盘口app|【​网址​🎉ac22.net🎉​】
欧洲杯投注-欧洲杯投注外围盘口-欧洲杯投注盘口app|【​网址​🎉ac22.net🎉​】
 
Satta Matka Dpboss Kalyan Matka Results Kalyan Chart
Satta Matka Dpboss Kalyan Matka Results Kalyan ChartSatta Matka Dpboss Kalyan Matka Results Kalyan Chart
Satta Matka Dpboss Kalyan Matka Results Kalyan Chart
 
2024.06 CPMN Cambridge - Beyond Now-Next-Later.pdf
2024.06 CPMN Cambridge - Beyond Now-Next-Later.pdf2024.06 CPMN Cambridge - Beyond Now-Next-Later.pdf
2024.06 CPMN Cambridge - Beyond Now-Next-Later.pdf
 
Satta Matka Dpboss Kalyan Matka Results Kalyan Chart
Satta Matka Dpboss Kalyan Matka Results Kalyan ChartSatta Matka Dpboss Kalyan Matka Results Kalyan Chart
Satta Matka Dpboss Kalyan Matka Results Kalyan Chart
 

AFE data base work example

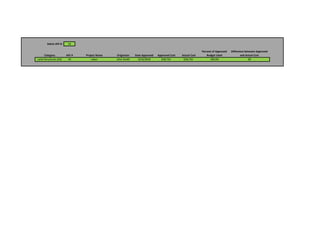
  • 1. 54 Category AFE # Originator Land Structures (All) 54 John Smith Percent of Approved Budget Used 100.0% Difference between Approved and Actual Cost $0 Approved Cost Actual Cost $28,732 $28,732 Select AFE #: Project Name Date Approved Labor 3/23/2018
  • 2. Actual Cost Sub-Total: $198,210,742 Approved Cost Sub-Total: $470,849,402 Actual CapEx Sub-Total: $35,078,744 Approved CapEx Sub-Total: $188,120,529 Pull Down Equations: Actual OpEx Sub-Total: $123,692,363 Approved OpEx Sub-Total: $282,728,873 Negative Numbers: ($XXXX) AFE # Project Name: Originator Date Approved Actual Cost Per AFE Approved Cost on AFE Percent of Approved Budget Used (%) Dif. between Approved and Actual Per AFE Actual CapEx Total Per AFE Approved CapEx Total on AFE Actual OpEx Total Per AFE Approved OpEx Total on AFE 1 Acquisition John Smith 9/18/2014 $18,072,613 $20,121,304 89.8% ($2,048,691) $4,392,009 $5,548,300 $13,680,604 $14,573,004 2 Acquisition Jane Doe 1/28/2015 $8,948,783 $15,889,717 56.3% ($6,940,934) $315,441 - $8,633,343 $15,889,717 3 Acquisition John Smith 3/2/2015 $17,318,976 $9,478,924 182.7% $7,840,052 $138,530 - $17,180,446 $9,478,924 4 Replacements Jane Doe 4/29/2015 $2,006,872 $2,421,725 82.9% ($414,853) $430,871 $918,000 $1,576,001 $1,503,725 5 Replacements John Smith 4/29/2015 $8,689,011 $9,574,369 90.8% ($885,358) $285,688 $3,150,000 $8,403,322 $6,424,369 6 Replacements Jane Doe 8/24/2015 $1,384,908 $1,986,583 69.7% ($601,675) ($5) - $1,384,913 $1,986,583 7 Acquisition John Smith 9/16/2015 $18,414,133 $33,422,110 55.1% ($15,007,977) $160,944 $20,319,300 $18,253,189 $13,102,810 8 Technology Jane Doe 11/18/2015 $2,633,292 $16,843,708 15.6% ($14,210,416) $1,815,093 $5,639,706 $818,199 $11,204,002 9 Acquisition John Smith 2/10/2017 $3,484,170 $12,907,800 27.0% ($9,423,630) ($224,864) $3,125,160 $3,709,035 $9,782,640 10 Acquisition Jane Doe 3/24/2017 $3,207,231 $11,888,480 27.0% ($8,681,249) ($251,816) $2,087,440 $3,459,047 $9,801,040 11 Acquisition John Smith 6/19/2017 $9,033,990 $29,622,098 30.5% ($20,588,108) $252,188 - $8,781,801 $29,622,098 12 Acquisition Jane Doe 6/19/2017 $1,984,687 $6,220,800 31.9% ($4,236,113) ($3,775) $2,184,000 $1,988,461 $4,036,800 13 Acquisition John Smith 6/19/2017 $4,704,315 $25,668,448 18.3% ($20,964,133) ($174,645) $4,506,400 $4,878,960 $21,162,048 14 Maintenance Jane Doe 6/19/2017 $2,473,466 $3,742,161 66.1% ($1,268,695) $2,467,667 $3,705,250 $5,799 $36,911 15 Acquisition John Smith 7/18/2017 $2,115,580 $8,826,023 24.0% ($6,710,443) ($9,060) - $2,124,640 $8,826,023 16 Acquisition Jane Doe 7/18/2017 $1,293,298 $4,855,201 26.6% ($3,561,903) $4,544 - $1,288,754 $4,855,201 17 Acquisition John Smith 7/18/2017 $1,621,150 $6,015,016 27.0% ($4,393,866) $48,107 - $1,573,043 $6,015,016 18 Acquisition Jane Doe 9/7/2017 $1,045,471 $4,883,985 21.4% ($3,838,514) ($1,981) - $1,047,453 $4,883,985 19 Maintenance John Smith 9/18/2017 $2,350,863 $3,740,049 62.9% ($1,389,186) $2,350,863 $3,705,250 - $34,799 20 Acquisition Jane Doe 10/17/2017 $7,863,737 $31,458,504 25.0% ($23,594,767) ($1,169,915) - $9,033,652 $31,458,504 21 Acquisition John Smith 10/17/2017 $14,109,598 $42,503,949 33.2% ($28,394,351) $53,935 $22,197,000 $14,055,663 $20,306,949 22 Maintenance Jane Doe 1/3/2018 $2,461,898 $2,800,516 87.9% ($338,618) $2,461,898 $2,763,016 - $37,500 YRC Freight AFE Reporting Database Manually Entered Amounts: All Information shown here is fictitious. Equipment
  • 3. Actual Cost Sub-Total: $78,907 Approved Cost Sub-Total: $46,334,642 Actual CapEx Sub-Total: $57,896 Approved CapEx Sub-Total: $38,669,439 Pull Down Equations: Actual OpEx Sub-Total: $21,011 Approved OpEx Sub-Total: $7,665,203 Negative Numbers: ($XXXX) AFE # Project Name: Originator Date Approved Actual Cost Per AFE Approved Cost on AFE Percent of Approved Budget Used (%) Dif. between Approved and Actual Per AFE Actual CapEx Total Per AFE Approved CapEx Total on AFE Actual OpEx Total Per AFE Approved OpEx Total on AFE 23 Upgrades John Smith 2/2/2015 - $7,237,080 - - - $6,917,627 - $319,453 24 Software Jane Doe 3/27/2016 $19,580 $16,500,926 0.1% ($16,481,346) - $13,093,187 $19,580 $3,407,739 25 Software John Smith 5/3/2017 $762 $900,000 0.1% ($899,238) - $300,000 $762 $600,000 26 Upgrades Jane Doe 10/18/2017 $48,000 $2,021,872 2.4% ($1,973,872) $48,000 $1,617,499 - $404,373 27 Replacements John Smith 2/26/2018 $669 $8,230,000 0.01% ($8,229,331) - $5,741,000 $669 $2,489,000 28 Upgrades Jane Doe 7/25/2018 - $7,296,264 - - - $7,236,264 - $60,000 29 Upgrades John Smith 1/22/2019 - $90,000 - - - $72,000 - $18,000 30 Upgrades Jane Doe 2/26/2019 - $1,330,400 - - - $1,330,400 - - 31 Software John Smith 3/25/2019 - $712,000 - - - $656,000 - $56,000 32 Replacements Jane Doe 3/27/2019 - $1,191,623 - - - $1,017,623 - $174,000 33 Software John Smith 4/24/2019 - $24,288 - - - - - $24,288 34 Software Jane Doe 4/25/2019 - $50,850 - - - - - $50,850 35 Replacements John Smith 6/14/2019 $9,896 $749,339 1.3% ($739,443) $9,896 $687,839 - $61,500 YRC Freight AFE Reporting Database IT Application Development & Infrastructure All Information shown here is fictitious. Manually Entered Amount:
  • 4. Actual Cost Sub-Total: $14,414,086 Approved Cost Sub-Total: $24,723,652 Actual CapEx Sub-Total: $8,568,442 Approved CapEx Sub-Total: $8,479,784 Pull Down Equations: Actual OpEx Sub-Total: $5,732,705 Approved OpEx Sub-Total: $16,243,868 Negative Numbers: ($XXXX) AFE # Project Name: Originator Date Approved Actual Cost Per AFE Approved Cost on AFE Percent of Approved Budget Used (%) Diff. between Approved and Actual Per AFE Actual CapEx Total Per AFE Approved CapEx Total on AFE Actual OpEx Total Per AFE Approved OpEx Total on AFE 36 Replacement Documentation John Smith 8/8/2013 $5,246,033 $664,776 789.1% $4,581,257 ($380,333) $16,500 $5,626,366 $648,276 37 Repairs Jane Doe 1/12/2018 $159,344 $165,477 96.3% ($6,133) $159,344 $165,477 - - 38 Labor John Smith 1/12/2018 $115,664 $105,864 109.3% $9,800 $115,664 $105,864 - - 39 Labor & Repairs Jane Doe 1/16/2018 $43,954 $43,954 100.0% - $43,954 $43,954 - - 40 Labor and Repairs John Smith 1/16/2018 $47,135 $47,135 100.0% - $47,135 $47,135 - - 41 Leasing Jane Doe 1/23/2018 $74,008 $12,335,947 0.6% ($12,261,939) - - $74,008 $12,335,947 42 Labor John Smith 1/23/2018 $160,030 $160,030 100.0% - $160,030 $160,030 - - 43 Repairs Jane Doe 1/24/2018 $15,154 $12,754 118.8% $2,400 $15,154 $12,754 - - 44 Labor John Smith 1/29/2018 $32,032 $32,032 100.0% - $32,032 $32,032 - - 45 Labor Jane Doe 2/7/2018 $88,193 $88,193 100.0% - $88,193 $88,193 - - 46 Repairs John Smith 2/8/2018 $55,043 $55,043 100.0% - $55,043 $55,043 - - 47 Repairs Jane Doe 2/21/2018 $74,827 $69,628 107.5% $5,199 $74,827 $69,628 - - 48 Labor John Smith 2/21/2018 $33,630 $33,630 100.0% - $33,630 $33,630 - - 49 Labor Jane Doe 2/21/2018 $43,414 $43,414 100.0% - $43,414 $43,414 - - 50 Labor John Smith 2/22/2018 $22,400 $22,400 100.0% - $22,400 $22,400 - - 51 Labor Jane Doe 2/23/2018 $90,064 $90,064 100.0% - $90,064 $90,064 - - 52 Replacements John Smith 2/23/2018 $26,280 $22,411 117.3% $3,869 $26,280 $22,411 - - 53 Replacements Jane Doe 2/26/2018 $19,312 $19,312 100.0% - $19,312 $19,312 - - 54 Labor John Smith 3/23/2018 $28,732 $28,732 100.0% - $28,732 $28,732 - - 55 Labor Jane Doe 3/27/2018 $214,829 $204,929 104.8% $9,900 $214,829 $204,929 - - 56 Labor & Cleanup John Smith 3/28/2018 $24,540 $21,050 116.6% $3,490 $24,540 $21,050 - - 57 Repairs Jane Doe 3/28/2018 $13,815 $19,469 71.0% ($5,654) $11,185 $18,000 $2,631 $1,469 Manually Entered Amount: YRC Freight AFE Reporting Database Land Structures (All) All Information shown here is fictitious.
  • 5. Actual Cost Sub-Total: $9,560,956 Approved Cost Sub-Total: $63,567,143 Actual CapEx Sub-Total: $5,524,253 Approved CapEx Sub-Total: $10,964,745 Pull Down Equations: Actual OpEx Sub-Total: $4,036,703 Approved OpEx Sub-Total: $52,602,398 Negative Numbers: ($XXXX) AFE # Project Name: Originator Date Approved Actual Cost Per AFE Approved Cost on AFE Percent of Approved Budget Used (%) Dif. between Approved and Actual Per AFE Actual CapEx Total Per AFE Approved CapEx Total on AFE Actual OpEx Total Per AFE Approved OpEx Total on AFE 58 Upgrades John Smith 8/20/2015 ($3,116) $10,936,676 -0.03% ($10,939,792) ($18,921) $312,001 $15,805 $10,624,675 59 Software Jane Doe 12/17/2015 $930,000 $4,000,000 23.3% ($3,070,000) - - $930,000 $4,000,000 60 Software John Smith 1/16/2017 $5,839,664 $13,713,164 42.6% ($7,873,500) $3,795,690 $6,887,902 $2,043,974 $6,825,262 61 Software Jane Doe 11/1/2017 $391,958 $14,438,467 2.7% ($14,046,509) $539,831 $377,417 ($147,873) $14,061,050 62 Redesign John Smith 12/13/2017 $2,405,440 $17,719,456 13.6% ($15,314,016) $1,210,878 $3,333,760 $1,194,562 $14,385,696 63 Software Jane Doe 5/2/2018 ($2,991) $2,411,380 -0.1% ($2,414,371) ($3,225) $53,665 $234 $2,357,715 64 Software John Smith 3/6/2019 - $348,000 - - - - - $348,000 Manually Entered Amount: All Information shown here is fictitious. YRC Freight AFE Reporting Database Operations
  • 6. Actual Cost Sub-Total: $16,995,423 Approved Cost Sub-Total: $19,690,555 Actual CapEx Sub-Total: $10,585,196 Approved CapEx Sub-Total: $13,279,866 Pull Down Equations: Actual OpEx Sub-Total: $7,010,914 Approved OpEx Sub-Total: $6,410,689 Negative Numbers: ($XXXX) AFE # Project Name: Originator Date Approved Actual Cost Per AFE Approved Cost on AFE Percent of Approved Budget Used (%) Dif. between Approved and Actual Per AFE Actual CapEx Total Per AFE Approved CapEx Total on AFE Actual OpEx Total Per AFE Approved OpEx Total on AFE 65 Leasing John Smith 8/27/2015 $4,193,503 $4,095,497 102.4% $98,006 $462,801 $583,179 $3,730,702 $3,512,318 66 Leasing Jane Doe 1/26/2016 $2,985,529 $2,764,860 108.0% $220,669 ($0) - $2,985,529 $2,764,860 67 Training John Smith 4/16/2018 $12,100 $22,835 53.0% ($10,735) - - $12,100 $22,835 68 Software Jane Doe 4/18/2018 $46,067 $46,067 100.0% - $27,355 $46,067 - - 69 Software John Smith 4/24/2018 $31,440 $23,000 136.7% $8,440 - - $31,440 $23,000 70 Security Jane Doe 5/3/2018 $27,456 $27,456 100.0% - - $27,456 $5,165 - 71 Buyout John Smith 5/14/2018 $3,554,000 $4,174,809 85.1% ($620,809) $3,554,000 $4,174,809 - - 72 Security Jane Doe 6/21/2018 $30,899 $30,301 102.0% $598 - $30,301 $30,899 - 73 Security John Smith 7/2/2018 $26,833 $26,832 100.0% $1 - $26,832 $26,833 - 74 Security Jane Doe 7/9/2018 $19,967 $22,426 89.0% ($2,459) - $22,426 $25,576 - 75 Security John Smith 7/9/2018 $23,822 $19,059 125.0% $4,763 $19,059 $19,059 $4,763 - 76 Security Jane Doe 8/1/2018 $32,306 $32,306 100.0% ($0) - $32,306 $32,306 - 77 Leasing John Smith 8/17/2018 $5,065,995 $5,847,200 86.6% ($781,205) $5,065,995 $5,847,200 - - 78 Software Jane Doe 8/22/2018 $98,254 $97,181 101.1% $1,073 $97,258 $97,181 $997 - 79 Leasing John Smith 8/30/2018 $470 $139,299 0.3% ($138,829) - $139,299 $470 - 80 Security Jane Doe 9/13/2018 $12,538 $13,751 91.2% ($1,213) - $13,751 $12,538 - 81 Security John Smith 9/24/2018 $636,081 $636,081 100.0% - $1,272,161 $636,081 - - 82 Build out Jane Doe 10/10/2018 $4,448 $14,300 31.1% ($9,852) - - $4,448 $14,300 83 Build out John Smith 10/18/2018 $50,401 $51,950 97.0% ($1,549) $50,401 $51,950 - - 84 Security Jane Doe 10/30/2018 $44,183 $44,723 98.8% ($540) - $44,723 $44,183 - 85 Training John Smith 12/13/2018 $37,368 $59,580 62.7% ($22,212) - - $37,368 $59,580 86 Software Jane Doe 12/18/2018 $43,612 $47,700 91.4% ($4,088) $36,166 $47,700 $7,446 - Manually Entered Amount: All Information shown here is fictitious. YRC Freight AFE Reporting Database Other Non-Recurring