Download to read offline

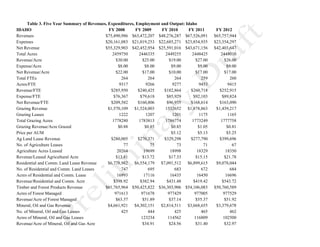


The document contains tables summarizing land management revenues, expenditures, employment and output data for Idaho and several other states over a five year period from 2008-2012. It also contains estimated projections for Nevada using average figures from the other states. Key data includes total revenues, expenditures, acres managed, revenue per acre, and staffing levels (FTEs) for each state and nationwide for the Bureau of Land Management (BLM).


