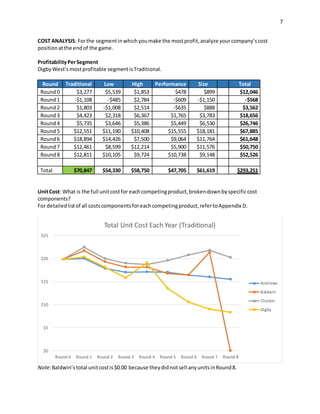
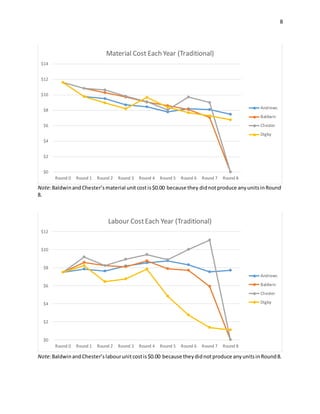
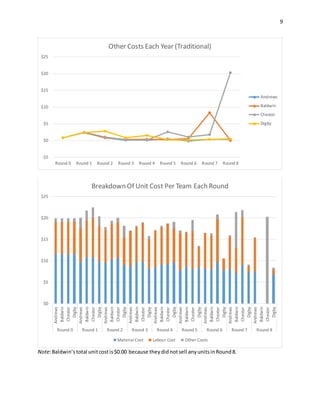
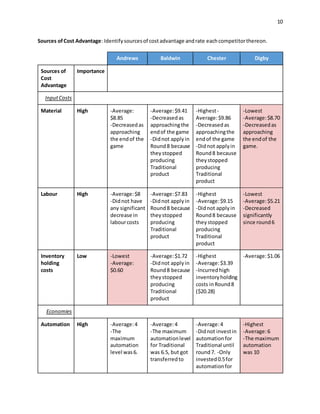
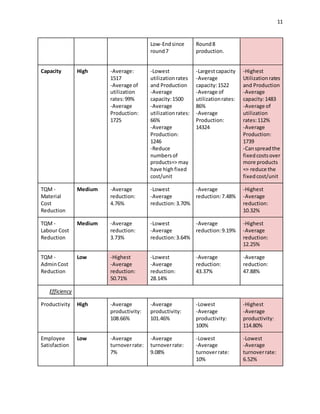
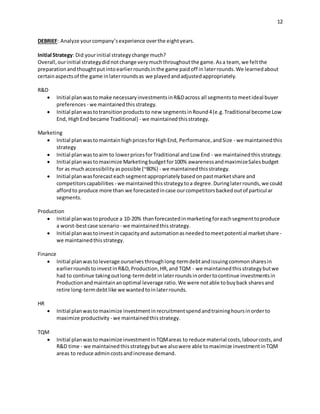
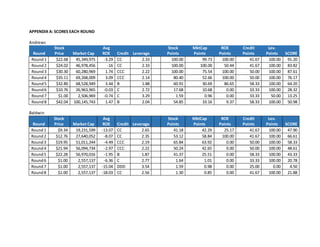
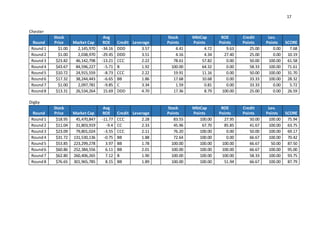
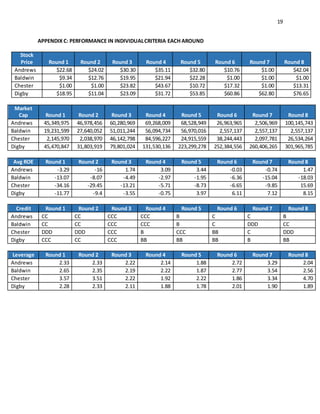
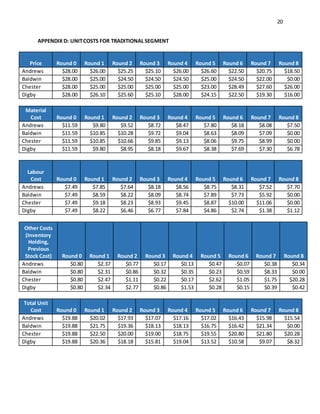
Team End-of-Simulation Analysis – Digby West
November26,2014
Preparedby:ChaoNB Phan
Eunice Fei Jin Shi
Brian Yan Muk
2
PERFORMANCE: Overall score,rank,andrelative performance onindividual score criteriaafter each
round.
Score
For detailedscoresforeachround,refertoAppendix A.
Rank
For detailedranksforeachround,refertoAppendix B.
-
10
20
30
40
50
60
70
80
90
100
Round 1 Round 2 Round 3 Round 4 Round 5 Round 6 Round 7 Round 8
Scores Each Round
Andrews
Baldwin
Chester
Digby
1
2
3
4
Round 1 Round 2 Round 3 Round 4 Round 5 Round 6 Round 7 Round 8
Rank Each Round
Andrews
Baldwin
Chester
Digby
3
Performance in Individual Criteria
For detailedperformance inindividualcriteria,refertoAppendix C.
$0
$10
$20
$30
$40
$50
$60
$70
$80
$90
Round 1 Round 2 Round 3 Round 4 Round 5 Round 6 Round 7 Round 8
Stock Price Each Round
Andrews
Baldwin
Chester
Digby
$0
$50,000,000
$100,000,000
$150,000,000
$200,000,000
$250,000,000
$300,000,000
$350,000,000
Round 1 Round 2 Round 3 Round 4 Round 5 Round 6 Round 7 Round 8
Market Cap Each Round
Andrews
Baldwin
Chester
Digby
4
-40
-30
-20
-10
0
10
20
Round 1 Round 2 Round 3 Round 4 Round 5 Round 6 Round 7 Round 8
AverageROEEach Round
Andrews
Baldwin
Chester
Digby
1.5
2.0
2.5
3.0
3.5
4.0
4.5
5.0
Round 1 Round 2 Round 3 Round 4 Round 5 Round 6 Round 7 Round 8
LeverageEach Round
Andrews
Baldwin
Chester
Digby
5
1
2
3
4
5
6
7
8
9
Round 1 Round 2 Round 3 Round 4 Round 5 Round 6 Round 7 Round 8
Credit Rating Each Round
Andrews
Baldwin
Chester
Digby
0%
5%
10%
15%
20%
25%
30%
35%
40%
45%
50%
Round 0 Round 1 Round 2 Round 3 Round 4 Round 5 Round 6 Round 7 Round 8
Total Market Share(Units) Each Year
Andrews
Baldwin
Chester
Digby
BBB
BB
B
CCC
CC
C
DDD
DD
D
6
0%
5%
10%
15%
20%
25%
30%
35%
40%
45%
50%
Round 0 Round 1 Round 2 Round 3 Round 4 Round 5 Round 6 Round 7 Round 8
Total Market Share($) Each Year
Andrews
Baldwin
Chester
Digby
7
COST ANALYSIS: Forthe segmentinwhichyoumake the mostprofit,analyze yourcompany’scost
positionatthe endof the game.
ProfitabilityPerSegment
DigbyWest’smostprofitable segmentisTraditional.
Round Traditional Low High Performance Size Total
Round0 $3,277 $5,539 $1,853 $478 $899 $12,046
Round1 -$1,108 -$485 $2,784 -$609 -$1,150 -$568
Round2 $1,803 -$1,008 $2,514 -$635 $888 $3,562
Round3 $4,423 $2,318 $6,367 $1,765 $3,783 $18,656
Round4 $5,735 $3,646 $5,386 $5,449 $6,530 $26,746
Round5 $12,551 $11,190 $10,408 $15,555 $18,181 $67,885
Round6 $18,894 $14,426 $7,500 $9,064 $11,764 $61,648
Round7 $12,461 $8,599 $12,214 $5,900 $11,576 $50,750
Round8 $12,811 $10,105 $9,724 $10,738 $9,148 $52,526
Total $70,847 $54,330 $58,750 $47,705 $61,619 $293,251
UnitCost: What is the full unitcostfor eachcompetingproduct,brokendownbyspecificcost
components?
For detailedlistof all costscomponentsforeachcompetingproduct,refertoAppendix D.
Note:Baldwin’stotal unitcostis$0.00 because theydidnotsell anyunitsinRound8.
$0
$5
$10
$15
$20
$25
Round 0 Round 1 Round 2 Round 3 Round 4 Round 5 Round 6 Round 7 Round 8
Total Unit Cost Each Year (Traditional)
Andrews
Baldwin
Chester
Digby
8
Note:BaldwinandChester’smaterial unitcostis$0.00 because they didnotproduce anyunitsinRound
8.
Note:BaldwinandChester’slabourunitcostis$0.00 because theydidnotproduce anyunitsinRound8.
$0
$2
$4
$6
$8
$10
$12
$14
Round 0 Round 1 Round 2 Round 3 Round 4 Round 5 Round 6 Round 7 Round 8
Material Cost Each Year (Traditional)
Andrews
Baldwin
Chester
Digby
$0
$2
$4
$6
$8
$10
$12
Round 0 Round 1 Round 2 Round 3 Round 4 Round 5 Round 6 Round 7 Round 8
Labour CostEach Year (Traditional)
Andrews
Baldwin
Chester
Digby
9
Note:Baldwin’stotal unitcostis$0.00 because theydidnotsell anyunitsinRound8.
-$5
$0
$5
$10
$15
$20
$25
Round 0 Round 1 Round 2 Round 3 Round 4 Round 5 Round 6 Round 7 Round 8
Other Costs Each Year (Traditional)
Andrews
Baldwin
Chester
Digby
$0
$5
$10
$15
$20
$25
Andrews
Baldwin
Chester
Digby
Andrews
Baldwin
Chester
Digby
Andrews
Baldwin
Chester
Digby
Andrews
Baldwin
Chester
Digby
Andrews
Baldwin
Chester
Digby
Andrews
Baldwin
Chester
Digby
Andrews
Baldwin
Chester
Digby
Andrews
Baldwin
Chester
Digby
Andrews
Baldwin
Chester
Digby
Round 0 Round 1 Round 2 Round 3 Round 4 Round 5 Round 6 Round 7 Round 8
Breakdown Of Unit Cost Per Team Each Round
Material Cost Labour Cost Other Costs
10
Sources of Cost Advantage: Identifysourcesof costadvantage andrate eachcompetitorthereon.
Andrews Baldwin Chester Digby
Sources of
Cost
Advantage
Importance
InputCosts
Material High -Average:
$8.85
-Decreasedas
approaching
the endof the
game
-Average:$9.41
-Decreasedas
approachingthe
endof the game
-Didnot applyin
Round8 because
theystopped
producing
Traditional
product
-Highest-
Average:$9.86
-Decreasedas
approachingthe
endof the game
-Didnot applyin
Round8 because
theystopped
producing
Traditional
product
-Lowest
-Average:$8.70
-Decreasedas
approaching
the endof the
game.
Labour High -Average:$8
-Didnot have
any significant
decrease in
labourcosts
-Average:$7.83
-Didnot applyin
Round8 because
theystopped
producing
Traditional
product
-Highest
-Average:$9.15
-Didnot applyin
Round8 because
theystopped
producing
Traditional
product
-Lowest
-Average:$5.21
-Decreased
significantly
since round6
Inventory
holding
costs
Low -Lowest
-Average:
$0.60
-Average:$1.72
-Didnot applyin
Round8 because
theystopped
producing
Traditional
product
-Highest
-Average:$3.39
-Incurredhigh
inventoryholding
costs inRound8
($20.28)
-Average:$1.06
Economies
Automation High -Average:4
-The
maximum
automation
level was6.
-Average:4
-The maximum
automationlevel
for Traditional
was 6.5, but got
transferredto
-Average:4
-Didnot investin
automationfor
Traditional until
round7. -Only
invested0.5for
automationfor
-Highest
-Average:6
-The maximum
automation
was 10
11
Low-Endsince
round7
Round8
production.
Capacity High -Average:
1517
-Average of
utilization
rates:99%
-Average
Production:
1725
-Lowest
utilizationrates
and Production
-Average
capacity:1500
-Average
utilizationrates:
66%
-Average
Production:
1246
-Reduce
numbersof
products=> may
have highfixed
cost/unit
-Largestcapacity
-Average
capacity:1522
-Average of
utilizationrates:
86%
-Average
Production:
14324
-Highest
Utilizationrates
and Production
-Average
capacity:1483
-Average of
utilization
rates:112%
-Average
Production:
1739
-Canspreadthe
fixedcostsover
more products
=> reduce the
fixedcost/unit
TQM -
Material
Cost
Reduction
Medium -Average
reduction:
4.76%
-Lowest
-Average
reduction:3.70%
-Average
reduction:7.48%
-Highest
-Average
reduction:
10.32%
TQM -
Labour Cost
Reduction
Medium -Average
reduction:
3.73%
-Lowest
-Average
reduction:3.64%
-Average
reduction:9.19%
-Highest
-Average
reduction:
12.25%
TQM -
AdminCost
Reduction
Low -Highest
-Average
reduction:
50.71%
-Lowest
-Average
reduction:
28.14%
-Average
reduction:
43.37%
-Average
reduction:
47.88%
Efficiency
Productivity High -Average
productivity:
108.66%
-Average
productivity:
101.46%
-Lowest
-Average
productivity:
100%
-Highest
-Average
productivity:
114.80%
Employee
Satisfaction
Low -Average
turnoverrate:
7%
-Average
turnoverrate:
9.08%
-Lowest
-Average
turnoverrate:
10%
-Lowest
-Average
turnoverrate:
6.52%
12
DEBRIEF: Analyze yourcompany’sexperience overthe eightyears.
Initial Strategy: Did yourinitial strategychange much?
Overall,ourinitial strategydidnotchange verymuchthroughoutthe game.Asa team, we feltthe
preparationandthoughtputintoearlierroundsinthe game paidoff in laterrounds.We learnedabout
certainaspectsof the game inlaterroundsas we playedandadjustedappropriately.
R&D
 Initial planwastomake necessaryinvestmentsinR&Dacross all segmentstomeetideal buyer
preferences - we maintainedthisstrategy.
 Initial planwastotransitionproductsto new segmentsinRound4(e.g.Traditional become Low
End, HighEnd became Traditional) - we maintainedthisstrategy.
Marketing
 Initial planwastomaintainhighpricesforHighEnd, Performance,andSize - we maintainedthis
strategy
 Initial planwastoaim to lowerpricesforTraditional andLow End - we maintainedthisstrategy.
 Initial planwastomaximize Marketingbudgetfor100% awarenessandmaximizeSalesbudget
for as muchaccessibilityaspossible (~80%) - we maintainedthisstrategy.
 Initial planwasforecasteachsegmentappropriatelybasedonpastmarketshare and
competitorscapabilities - we maintainedthisstrategytoa degree.Duringlaterrounds,we could
affordto produce more than we forecastedincase ourcompetitorsbackedoutof particular
segments.
Production
 Initial planwastoproduce a 10-20% thanforecastedinmarketingforeachsegmenttoproduce
a worst-bestcase scenario - we maintainedthisstrategy.
 Initial planwastoinvestincapacityand automationasneededtomeetpotential marketshare -
we maintainedthisstrategy.
Finance
 Initial planwastoleverage ourselvesthroughlong-termdebtandissuingcommonsharesin
earlierroundstoinvestinR&D,Production,HR,and TQM - we maintainedthisstrategybutwe
had to continue takingoutlong-termdebtinlaterroundsinordertocontinue investmentsin
Productionandmaintainanoptimal leverage ratio.We were notable tobuyback sharesand
retire long-termdebtlike we wantedtoinlaterrounds.
HR
 Initial planwastomaximize investmentinrecruitmentspendandtraininghoursinorderto
maximize productivity - we maintainedthisstrategy.
TQM
 Initial planwastomaximize investmentinTQMareas to reduce material costs,labourcosts,and
R&D time - we maintainedthisstrategybutwe alsowere able tomaximize investmentinTQM
areas to reduce admincostsandincrease demand.
13
Decisions:What were youmostand leasteffective decisions?
Most Effective Decisions
 KeepingupinR&D andspendinginMarketingandSalesallowed ustomaintainmarket
leadershipforHighEnd,Performance,andSize segmentstooptimize buyerpreferences,
maximizingourcustomersurveyscore.Age,Performance,Size,andReliabilityare maximized
withinthe possible budget.
 Takingadvantage of the movingsegmentstoreduce R&Dcosts for Low-EndandTraditional
segments
 MaximizingspendingonHReveryroundallowedustoincrease ouremployees’productivity,
and satisfactionwhile reducingturnover.
 Comingupwithour ownthresholdsforTQMspendingeveryroundbycalculatinghow changes
ineach TQM section’sspendingcandecrease costsorincrease demand.
 Investmentsinautomationallowedustoreduce costsforTraditional andLow Endsegmentsto
create a costadvantage overour competitors.
 IncreasingAccountReceivable daysfrom30 to 45-60 to increase customersatisfaction.The lag
alsoallowedustoadjustour cash endingpositionincase we have toomuchor short incash as
the year end.
LeastEffective Decisions
 Overproducingforeverysegment forthe purpose of meetingmarketdemandresultedinexcess
inventory,resultinginextrainventoryholdingcosts.
 We spentthe mostinMarketingand Salescomparedtoour competitors,whichresultedin
higherAwarenessandAccessibilitybutitalsoreducedournetprofits.We foundour
competitorsdidnotspendasmuch on MarketingandSalesandwere still able toyieldrelative
sales- we may have beenable tohave highernetprofitsif we reducedourMarketingandSales
budget(butwe wouldn’tbe able to know if we wouldhave soldthe same withalowerbudget).
14
CAREER TAKEAWAYS:Lessonsyouwill take away,regardinganyof the followingdimensions.
Takeaways: How to approach runninga business?
 Strategyand decision-makingistime-consumingandrequiresdatagatheringandresearch,
understandingandanalyzingouroptionsbasedoninternal andexternalfactors,anddedicating
the time neededtomake these decisions,despite beingbusywitheverydaytasks(asastudent,
we have otherclassesandhomework, asa professional,we have anever-endingto-dolist)
 Wheneverpossible, there needstobe abalance of makingshort-termandlong-termdecisions.
Ideallywe wanttoalwaysfocuson long-termdecisionsbutwe alsoneedtobe profitable inthe
short runand we needto be aware of how our short-termdecisionsimpactourlong-term
strategy.
 If you believeyoucanmake greaterreturnscomparedto the interestrate whenleveragingdebt,
we shouldborrowas muchas we can to generate value andprofits
 There isa constantneedtoevaluate ourcompetitors’strategies,evaluate ourownstrategy, and
ask “What-If”to make decisions –inmostcases,we stuck withour strategyandmade minor
adjustmentsbutwe realize theremayhave beentimeswe neededtomake majorshifts
dependingon variousfactors
 There isa constantneedtoalwayslearnfromour mistakesaswell asbestpracticesmade by
others
 We foundone of the keysto our successwasthe fact that we had an in depthunderstandingof
the rulesof the games – thisis similartoreal life where understandingbusinessbestpracticesas
well asthe overall marketandindustrywill allowyoutocreate a competitive advantage
15
FEEDBACK
What We Liked:What didyou like aboutthe simulationproject?
 We were able to applymanyof the businessconceptsandframeworkslearnedinclassto
operate the stimulationcompany,suchasthe strategicpositionandrelative source of
advantage
 We likedthe ideaof amovingsegmentbecause inreal life,productsgetolder,losesitsvalue
overtime,anddifferentcustomershave differentbuyingcriteria
 The balancedscorecardis useful togetthe projectedresultsrightaftermakingdecisions.
 We have to considerothercompetitors'possible decisionsbefore makingourfinal decisions.
Thisforcedus to put ourselvesinourcompetitor’sshoestosee whatwe woulddointheir
position,includingwhattheywoulddofortheirproductstrategy,pricing,productionlevels,and
marketing/sales.Thisforcedustothinkof differentscenarios andmake adecisionbasedonthe
strategywe thought theywere goingtotake.
 The simulationhighlightsthe positive impactsof long-terminvestments;we hadtomake
 The simulationwasforgivingtoteamsthatmade massive lossesandseemedlikethey couldn’t
come back from theirmassive emergencyloans
 We likedhowthe game wasflexibleinthe sense thatthere are a varietyof strategieswe could
have taken
 We likedhowthe game hada recessioninthe middle rounds,makingitmore realisticand
reflectiveof real life
What We Didn’t Like:What didyou findfrustratingand/orrecommenddoingdifferently?
 It requireshuge amountof time atthe beginningtogetto understandthe game andhow to
performeffectively.While thiswasfun,itwasalsoveryfrustratingwhenwe made decisionsin
earlierroundsthatwe thoughtwere rightbutendedupworkingagainstusbecause of factors
we didn’tconsider,suchasforecastingcorrectlyandhow that impactsour income statement.
 We were frustratedattime whenwe workedhardtoput togetheranideal productsegmentand
we believedwe wouldgetagreatermarketshare andlostout to inferiorproductswithless
marketingandsalesbudget
Recommendations:
 It wouldbe more valuable if there were more add-onssowe have more variableswe canlearn
withand have more optionstodifferentiateourcompanyfromcompetitors
 We thinkthe gradingcriteriashouldincludethe cumulative profittoavoidmanipulatingthe
results
 More practice roundswouldbe useful forusto make trialsand errors,while havingmore real
roundscan trulydistinguishthe winningandlosingteams.We recommendhaving3practice
roundsfirst,andhaving2 real roundsineach of the followingweeks.
 We shouldhave more time tolearnaboutthe simulationrulesbefore startingthe firstpractice
rounds.We recommendstartingthe firstpractice roundinWeek3 insteadof Week2.In Week
2, each groupcan have some in-classdiscussiononthe simulationrules.If all teamsare able to
understandfullythe simulationrulesbefore the real rounds,thenthe final resultismore likely
to dependonthe strategyof each teammade inthe real rounds.
APPENDIX A: SCORES EACH ROUND
Andrews
Round
Stock
Price Market Cap
Avg
ROE Credit Leverage
Stock
Points
MktCap
Points
ROE
Points
Credit
Points
Lev.
Points SCORE
Round1 $22.68 45,349,975 -3.29 CC 2.33 100.00 99.73 100.00 41.67 100.00 91.20
Round2 $24.02 46,978,456 -16 CC 2.33 100.00 100.00 50.44 41.67 100.00 83.82
Round3 $30.30 60,280,969 1.74 CCC 2.22 100.00 75.54 100.00 50.00 100.00 87.61
Round4 $35.11 69,268,009 3.09 CCC 2.14 80.40 52.66 100.00 50.00 100.00 76.17
Round5 $32.80 68,528,949 3.44 B 1.88 60.91 30.69 86.65 58.33 100.00 64.20
Round6 $10.76 26,963,965 -0.03 C 2.72 17.68 10.68 0.00 33.33 100.00 28.32
Round7 $1.00 2,506,969 -0.74 C 3.29 1.59 0.96 0.00 33.33 50.00 13.25
Round8 $42.04 100,145,743 1.47 B 2.04 54.85 33.16 9.37 58.33 100.00 50.98
Baldwin
Round
Stock
Price Market Cap
Avg
ROE Credit Leverage
Stock
Points
MktCap
Points
ROE
Points
Credit
Points
Lev.
Points SCORE
Round1 $9.34 19,231,599 -13.07 CC 2.65 41.18 42.29 25.17 41.67 100.00 47.90
Round2 $12.76 27,640,052 -8.07 CC 2.35 53.12 58.84 100.00 41.67 100.00 66.61
Round3 $19.95 51,011,244 -4.49 CCC 2.19 65.84 63.92 0.00 50.00 100.00 58.33
Round4 $21.94 56,094,734 -2.97 CCC 2.22 50.24 42.65 0.00 50.00 100.00 48.61
Round5 $22.28 56,970,016 -1.95 B 1.87 41.37 25.51 0.00 58.33 100.00 43.33
Round6 $1.00 2,557,137 -6.36 C 2.77 1.64 1.01 0.00 33.33 100.00 20.78
Round7 $1.00 2,557,137 -15.04 DDD 3.54 1.59 0.98 0.00 25.00 0.00 4.50
Round8 $1.00 2,557,137 -18.03 CC 2.56 1.30 0.85 0.00 41.67 100.00 21.88
17
Chester
Round
Stock
Price Market Cap
Avg
ROE Credit Leverage
Stock
Points
MktCap
Points
ROE
Points
Credit
Points
Lev.
Points SCORE
Round1 $1.00 2,145,970 -34.16 DDD 3.57 4.41 4.72 9.63 25.00 0.00 7.68
Round2 $1.00 2,038,970 -29.45 DDD 3.51 4.16 4.34 27.40 25.00 0.00 10.19
Round3 $23.82 46,142,798 -13.21 CCC 2.22 78.61 57.82 0.00 50.00 100.00 61.58
Round4 $43.67 84,596,227 -5.71 B 1.92 100.00 64.32 0.00 58.33 100.00 71.61
Round5 $10.72 24,915,559 -8.73 CCC 2.22 19.91 11.16 0.00 50.00 100.00 31.70
Round6 $17.32 38,244,443 -6.65 BB 1.86 17.68 10.68 0.00 33.33 100.00 28.32
Round7 $1.00 2,097,781 -9.85 C 3.34 1.59 0.81 0.00 33.33 0.00 5.72
Round8 $13.31 26,534,264 15.69 DDD 4.70 17.36 8.79 100.00 25.00 0.00 26.59
Digby
Round
Stock
Price Market Cap
Avg
ROE Credit Leverage
Stock
Points
MktCap
Points
ROE
Points
Credit
Points
Lev.
Points SCORE
Round1 $18.95 45,470,847 -11.77 CCC 2.28 83.55 100.00 27.95 50.00 100.00 75.94
Round2 $11.04 31,803,919 -9.4 CC 2.33 45.96 67.70 85.85 41.67 100.00 63.75
Round3 $23.09 79,801,024 -3.55 CCC 2.11 76.20 100.00 0.00 50.00 100.00 69.17
Round4 $31.72 131,530,136 -0.75 BB 1.88 72.64 100.00 0.00 66.67 100.00 70.42
Round5 $53.85 223,299,278 3.97 BB 1.78 100.00 100.00 100.00 66.67 50.00 87.50
Round6 $60.86 252,384,556 6.11 BB 2.01 100.00 100.00 100.00 66.67 100.00 95.00
Round7 $62.80 260,406,265 7.12 B 1.90 100.00 100.00 100.00 58.33 100.00 93.75
Round8 $76.65 301,965,785 8.15 BB 1.89 100.00 100.00 51.94 66.67 100.00 87.79
APPENDIX B: RANK EACH ROUND
RANK Round 1 Round 2 Round 3 Round 4 Round 5 Round 6 Round 7 Round 8
Andrews 1 1 1 1 2 2 2 2
Baldwin 3 2 4 4 3 4 4 4
Chester 4 4 3 2 4 3 3 3
Digby 2 3 2 3 1 1 1 1
19
APPENDIX C: PERFORMANCE IN INDIVIDUALCRITERIA EACH AROUND
Stock
Price Round 1 Round 2 Round 3 Round 4 Round 5 Round 6 Round 7 Round 8
Andrews $22.68 $24.02 $30.30 $35.11 $32.80 $10.76 $1.00 $42.04
Baldwin $9.34 $12.76 $19.95 $21.94 $22.28 $1.00 $1.00 $1.00
Chester $1.00 $1.00 $23.82 $43.67 $10.72 $17.32 $1.00 $13.31
Digby $18.95 $11.04 $23.09 $31.72 $53.85 $60.86 $62.80 $76.65
Market
Cap Round 1 Round 2 Round 3 Round 4 Round 5 Round 6 Round 7 Round 8
Andrews 45,349,975 46,978,456 60,280,969 69,268,009 68,528,949 26,963,965 2,506,969 100,145,743
Baldwin 19,231,599 27,640,052 51,011,244 56,094,734 56,970,016 2,557,137 2,557,137 2,557,137
Chester 2,145,970 2,038,970 46,142,798 84,596,227 24,915,559 38,244,443 2,097,781 26,534,264
Digby 45,470,847 31,803,919 79,801,024 131,530,136 223,299,278 252,384,556 260,406,265 301,965,785
Avg ROE Round 1 Round 2 Round 3 Round 4 Round 5 Round 6 Round 7 Round 8
Andrews -3.29 -16 1.74 3.09 3.44 -0.03 -0.74 1.47
Baldwin -13.07 -8.07 -4.49 -2.97 -1.95 -6.36 -15.04 -18.03
Chester -34.16 -29.45 -13.21 -5.71 -8.73 -6.65 -9.85 15.69
Digby -11.77 -9.4 -3.55 -0.75 3.97 6.11 7.12 8.15
Credit Round 1 Round 2 Round 3 Round 4 Round 5 Round 6 Round 7 Round 8
Andrews CC CC CCC CCC B C C B
Baldwin CC CC CCC CCC B C DDD CC
Chester DDD DDD CCC B CCC BB C DDD
Digby CCC CC CCC BB BB BB B BB
Leverage Round 1 Round 2 Round 3 Round 4 Round 5 Round 6 Round 7 Round 8
Andrews 2.33 2.33 2.22 2.14 1.88 2.72 3.29 2.04
Baldwin 2.65 2.35 2.19 2.22 1.87 2.77 3.54 2.56
Chester 3.57 3.51 2.22 1.92 2.22 1.86 3.34 4.70
Digby 2.28 2.33 2.11 1.88 1.78 2.01 1.90 1.89
20
APPENDIX D: UNITCOSTS FOR TRADITIONAL SEGMENT
Price Round 0 Round 1 Round 2 Round 3 Round 4 Round 5 Round 6 Round 7 Round 8
Andrews $28.00 $26.00 $25.25 $25.10 $26.00 $26.60 $22.50 $20.75 $18.50
Baldwin $28.00 $25.00 $24.50 $24.50 $24.50 $25.00 $24.50 $22.00 $0.00
Chester $28.00 $25.00 $25.00 $25.00 $25.00 $23.00 $28.49 $27.60 $26.00
Digby $28.00 $26.10 $25.60 $25.10 $28.00 $24.15 $22.50 $19.30 $16.00
Material
Cost Round 0 Round 1 Round 2 Round 3 Round 4 Round 5 Round 6 Round 7 Round 8
Andrews $11.59 $9.80 $9.52 $8.72 $8.47 $7.80 $8.18 $8.08 $7.50
Baldwin $11.59 $10.85 $10.28 $9.72 $9.04 $8.63 $8.09 $7.09 $0.00
Chester $11.59 $10.85 $10.66 $9.85 $9.13 $8.06 $9.75 $8.99 $0.00
Digby $11.59 $9.80 $8.95 $8.18 $9.67 $8.38 $7.69 $7.30 $6.78
Labour
Cost Round 0 Round 1 Round 2 Round 3 Round 4 Round 5 Round 6 Round 7 Round 8
Andrews $7.49 $7.85 $7.64 $8.18 $8.56 $8.75 $8.31 $7.52 $7.70
Baldwin $7.49 $8.59 $8.22 $8.09 $8.74 $7.89 $7.73 $5.92 $0.00
Chester $7.49 $9.18 $8.23 $8.93 $9.45 $8.87 $10.00 $11.06 $0.00
Digby $7.49 $8.22 $6.46 $6.77 $7.84 $4.86 $2.74 $1.38 $1.12
Other Costs
(Inventory
Holding,
Previous
Stock Cost) Round 0 Round 1 Round 2 Round 3 Round 4 Round 5 Round 6 Round 7 Round 8
Andrews $0.80 $2.37 $0.77 $0.17 $0.13 $0.47 -$0.07 $0.38 $0.34
Baldwin $0.80 $2.31 $0.86 $0.32 $0.35 $0.23 $0.59 $8.33 $0.00
Chester $0.80 $2.47 $1.11 $0.22 $0.17 $2.62 $1.05 $1.75 $20.28
Digby $0.80 $2.34 $2.77 $0.86 $1.53 $0.28 $0.15 $0.39 $0.42
Total Unit
Cost Round 0 Round 1 Round 2 Round 3 Round 4 Round 5 Round 6 Round 7 Round 8
Andrews $19.88 $20.02 $17.93 $17.07 $17.16 $17.02 $16.43 $15.98 $15.54
Baldwin $19.88 $21.75 $19.36 $18.13 $18.13 $16.75 $16.42 $21.34 $0.00
Chester $19.88 $22.50 $20.00 $19.00 $18.75 $19.55 $20.80 $21.80 $20.28
Digby $19.88 $20.36 $18.18 $15.81 $19.04 $13.52 $10.58 $9.07 $8.32

Final Team Analysis - Linkedin

  • 1.
    Team End-of-Simulation Analysis– Digby West November26,2014 Preparedby:ChaoNB Phan Eunice Fei Jin Shi Brian Yan Muk
  • 2.
    2 PERFORMANCE: Overall score,rank,andrelativeperformance onindividual score criteriaafter each round. Score For detailedscoresforeachround,refertoAppendix A. Rank For detailedranksforeachround,refertoAppendix B. - 10 20 30 40 50 60 70 80 90 100 Round 1 Round 2 Round 3 Round 4 Round 5 Round 6 Round 7 Round 8 Scores Each Round Andrews Baldwin Chester Digby 1 2 3 4 Round 1 Round 2 Round 3 Round 4 Round 5 Round 6 Round 7 Round 8 Rank Each Round Andrews Baldwin Chester Digby
  • 3.
    3 Performance in IndividualCriteria For detailedperformance inindividualcriteria,refertoAppendix C. $0 $10 $20 $30 $40 $50 $60 $70 $80 $90 Round 1 Round 2 Round 3 Round 4 Round 5 Round 6 Round 7 Round 8 Stock Price Each Round Andrews Baldwin Chester Digby $0 $50,000,000 $100,000,000 $150,000,000 $200,000,000 $250,000,000 $300,000,000 $350,000,000 Round 1 Round 2 Round 3 Round 4 Round 5 Round 6 Round 7 Round 8 Market Cap Each Round Andrews Baldwin Chester Digby
  • 4.
    4 -40 -30 -20 -10 0 10 20 Round 1 Round2 Round 3 Round 4 Round 5 Round 6 Round 7 Round 8 AverageROEEach Round Andrews Baldwin Chester Digby 1.5 2.0 2.5 3.0 3.5 4.0 4.5 5.0 Round 1 Round 2 Round 3 Round 4 Round 5 Round 6 Round 7 Round 8 LeverageEach Round Andrews Baldwin Chester Digby
  • 5.
    5 1 2 3 4 5 6 7 8 9 Round 1 Round2 Round 3 Round 4 Round 5 Round 6 Round 7 Round 8 Credit Rating Each Round Andrews Baldwin Chester Digby 0% 5% 10% 15% 20% 25% 30% 35% 40% 45% 50% Round 0 Round 1 Round 2 Round 3 Round 4 Round 5 Round 6 Round 7 Round 8 Total Market Share(Units) Each Year Andrews Baldwin Chester Digby BBB BB B CCC CC C DDD DD D
  • 6.
    6 0% 5% 10% 15% 20% 25% 30% 35% 40% 45% 50% Round 0 Round1 Round 2 Round 3 Round 4 Round 5 Round 6 Round 7 Round 8 Total Market Share($) Each Year Andrews Baldwin Chester Digby
  • 7.
    7 COST ANALYSIS: Forthesegmentinwhichyoumake the mostprofit,analyze yourcompany’scost positionatthe endof the game. ProfitabilityPerSegment DigbyWest’smostprofitable segmentisTraditional. Round Traditional Low High Performance Size Total Round0 $3,277 $5,539 $1,853 $478 $899 $12,046 Round1 -$1,108 -$485 $2,784 -$609 -$1,150 -$568 Round2 $1,803 -$1,008 $2,514 -$635 $888 $3,562 Round3 $4,423 $2,318 $6,367 $1,765 $3,783 $18,656 Round4 $5,735 $3,646 $5,386 $5,449 $6,530 $26,746 Round5 $12,551 $11,190 $10,408 $15,555 $18,181 $67,885 Round6 $18,894 $14,426 $7,500 $9,064 $11,764 $61,648 Round7 $12,461 $8,599 $12,214 $5,900 $11,576 $50,750 Round8 $12,811 $10,105 $9,724 $10,738 $9,148 $52,526 Total $70,847 $54,330 $58,750 $47,705 $61,619 $293,251 UnitCost: What is the full unitcostfor eachcompetingproduct,brokendownbyspecificcost components? For detailedlistof all costscomponentsforeachcompetingproduct,refertoAppendix D. Note:Baldwin’stotal unitcostis$0.00 because theydidnotsell anyunitsinRound8. $0 $5 $10 $15 $20 $25 Round 0 Round 1 Round 2 Round 3 Round 4 Round 5 Round 6 Round 7 Round 8 Total Unit Cost Each Year (Traditional) Andrews Baldwin Chester Digby
  • 8.
    8 Note:BaldwinandChester’smaterial unitcostis$0.00 becausethey didnotproduce anyunitsinRound 8. Note:BaldwinandChester’slabourunitcostis$0.00 because theydidnotproduce anyunitsinRound8. $0 $2 $4 $6 $8 $10 $12 $14 Round 0 Round 1 Round 2 Round 3 Round 4 Round 5 Round 6 Round 7 Round 8 Material Cost Each Year (Traditional) Andrews Baldwin Chester Digby $0 $2 $4 $6 $8 $10 $12 Round 0 Round 1 Round 2 Round 3 Round 4 Round 5 Round 6 Round 7 Round 8 Labour CostEach Year (Traditional) Andrews Baldwin Chester Digby
  • 9.
    9 Note:Baldwin’stotal unitcostis$0.00 becausetheydidnotsell anyunitsinRound8. -$5 $0 $5 $10 $15 $20 $25 Round 0 Round 1 Round 2 Round 3 Round 4 Round 5 Round 6 Round 7 Round 8 Other Costs Each Year (Traditional) Andrews Baldwin Chester Digby $0 $5 $10 $15 $20 $25 Andrews Baldwin Chester Digby Andrews Baldwin Chester Digby Andrews Baldwin Chester Digby Andrews Baldwin Chester Digby Andrews Baldwin Chester Digby Andrews Baldwin Chester Digby Andrews Baldwin Chester Digby Andrews Baldwin Chester Digby Andrews Baldwin Chester Digby Round 0 Round 1 Round 2 Round 3 Round 4 Round 5 Round 6 Round 7 Round 8 Breakdown Of Unit Cost Per Team Each Round Material Cost Labour Cost Other Costs
  • 10.
    10 Sources of CostAdvantage: Identifysourcesof costadvantage andrate eachcompetitorthereon. Andrews Baldwin Chester Digby Sources of Cost Advantage Importance InputCosts Material High -Average: $8.85 -Decreasedas approaching the endof the game -Average:$9.41 -Decreasedas approachingthe endof the game -Didnot applyin Round8 because theystopped producing Traditional product -Highest- Average:$9.86 -Decreasedas approachingthe endof the game -Didnot applyin Round8 because theystopped producing Traditional product -Lowest -Average:$8.70 -Decreasedas approaching the endof the game. Labour High -Average:$8 -Didnot have any significant decrease in labourcosts -Average:$7.83 -Didnot applyin Round8 because theystopped producing Traditional product -Highest -Average:$9.15 -Didnot applyin Round8 because theystopped producing Traditional product -Lowest -Average:$5.21 -Decreased significantly since round6 Inventory holding costs Low -Lowest -Average: $0.60 -Average:$1.72 -Didnot applyin Round8 because theystopped producing Traditional product -Highest -Average:$3.39 -Incurredhigh inventoryholding costs inRound8 ($20.28) -Average:$1.06 Economies Automation High -Average:4 -The maximum automation level was6. -Average:4 -The maximum automationlevel for Traditional was 6.5, but got transferredto -Average:4 -Didnot investin automationfor Traditional until round7. -Only invested0.5for automationfor -Highest -Average:6 -The maximum automation was 10
  • 11.
    11 Low-Endsince round7 Round8 production. Capacity High -Average: 1517 -Averageof utilization rates:99% -Average Production: 1725 -Lowest utilizationrates and Production -Average capacity:1500 -Average utilizationrates: 66% -Average Production: 1246 -Reduce numbersof products=> may have highfixed cost/unit -Largestcapacity -Average capacity:1522 -Average of utilizationrates: 86% -Average Production: 14324 -Highest Utilizationrates and Production -Average capacity:1483 -Average of utilization rates:112% -Average Production: 1739 -Canspreadthe fixedcostsover more products => reduce the fixedcost/unit TQM - Material Cost Reduction Medium -Average reduction: 4.76% -Lowest -Average reduction:3.70% -Average reduction:7.48% -Highest -Average reduction: 10.32% TQM - Labour Cost Reduction Medium -Average reduction: 3.73% -Lowest -Average reduction:3.64% -Average reduction:9.19% -Highest -Average reduction: 12.25% TQM - AdminCost Reduction Low -Highest -Average reduction: 50.71% -Lowest -Average reduction: 28.14% -Average reduction: 43.37% -Average reduction: 47.88% Efficiency Productivity High -Average productivity: 108.66% -Average productivity: 101.46% -Lowest -Average productivity: 100% -Highest -Average productivity: 114.80% Employee Satisfaction Low -Average turnoverrate: 7% -Average turnoverrate: 9.08% -Lowest -Average turnoverrate: 10% -Lowest -Average turnoverrate: 6.52%
  • 12.
    12 DEBRIEF: Analyze yourcompany’sexperienceoverthe eightyears. Initial Strategy: Did yourinitial strategychange much? Overall,ourinitial strategydidnotchange verymuchthroughoutthe game.Asa team, we feltthe preparationandthoughtputintoearlierroundsinthe game paidoff in laterrounds.We learnedabout certainaspectsof the game inlaterroundsas we playedandadjustedappropriately. R&D  Initial planwastomake necessaryinvestmentsinR&Dacross all segmentstomeetideal buyer preferences - we maintainedthisstrategy.  Initial planwastotransitionproductsto new segmentsinRound4(e.g.Traditional become Low End, HighEnd became Traditional) - we maintainedthisstrategy. Marketing  Initial planwastomaintainhighpricesforHighEnd, Performance,andSize - we maintainedthis strategy  Initial planwastoaim to lowerpricesforTraditional andLow End - we maintainedthisstrategy.  Initial planwastomaximize Marketingbudgetfor100% awarenessandmaximizeSalesbudget for as muchaccessibilityaspossible (~80%) - we maintainedthisstrategy.  Initial planwasforecasteachsegmentappropriatelybasedonpastmarketshare and competitorscapabilities - we maintainedthisstrategytoa degree.Duringlaterrounds,we could affordto produce more than we forecastedincase ourcompetitorsbackedoutof particular segments. Production  Initial planwastoproduce a 10-20% thanforecastedinmarketingforeachsegmenttoproduce a worst-bestcase scenario - we maintainedthisstrategy.  Initial planwastoinvestincapacityand automationasneededtomeetpotential marketshare - we maintainedthisstrategy. Finance  Initial planwastoleverage ourselvesthroughlong-termdebtandissuingcommonsharesin earlierroundstoinvestinR&D,Production,HR,and TQM - we maintainedthisstrategybutwe had to continue takingoutlong-termdebtinlaterroundsinordertocontinue investmentsin Productionandmaintainanoptimal leverage ratio.We were notable tobuyback sharesand retire long-termdebtlike we wantedtoinlaterrounds. HR  Initial planwastomaximize investmentinrecruitmentspendandtraininghoursinorderto maximize productivity - we maintainedthisstrategy. TQM  Initial planwastomaximize investmentinTQMareas to reduce material costs,labourcosts,and R&D time - we maintainedthisstrategybutwe alsowere able tomaximize investmentinTQM areas to reduce admincostsandincrease demand.
  • 13.
    13 Decisions:What were youmostandleasteffective decisions? Most Effective Decisions  KeepingupinR&D andspendinginMarketingandSalesallowed ustomaintainmarket leadershipforHighEnd,Performance,andSize segmentstooptimize buyerpreferences, maximizingourcustomersurveyscore.Age,Performance,Size,andReliabilityare maximized withinthe possible budget.  Takingadvantage of the movingsegmentstoreduce R&Dcosts for Low-EndandTraditional segments  MaximizingspendingonHReveryroundallowedustoincrease ouremployees’productivity, and satisfactionwhile reducingturnover.  Comingupwithour ownthresholdsforTQMspendingeveryroundbycalculatinghow changes ineach TQM section’sspendingcandecrease costsorincrease demand.  Investmentsinautomationallowedustoreduce costsforTraditional andLow Endsegmentsto create a costadvantage overour competitors.  IncreasingAccountReceivable daysfrom30 to 45-60 to increase customersatisfaction.The lag alsoallowedustoadjustour cash endingpositionincase we have toomuchor short incash as the year end. LeastEffective Decisions  Overproducingforeverysegment forthe purpose of meetingmarketdemandresultedinexcess inventory,resultinginextrainventoryholdingcosts.  We spentthe mostinMarketingand Salescomparedtoour competitors,whichresultedin higherAwarenessandAccessibilitybutitalsoreducedournetprofits.We foundour competitorsdidnotspendasmuch on MarketingandSalesandwere still able toyieldrelative sales- we may have beenable tohave highernetprofitsif we reducedourMarketingandSales budget(butwe wouldn’tbe able to know if we wouldhave soldthe same withalowerbudget).
  • 14.
    14 CAREER TAKEAWAYS:Lessonsyouwill takeaway,regardinganyof the followingdimensions. Takeaways: How to approach runninga business?  Strategyand decision-makingistime-consumingandrequiresdatagatheringandresearch, understandingandanalyzingouroptionsbasedoninternal andexternalfactors,anddedicating the time neededtomake these decisions,despite beingbusywitheverydaytasks(asastudent, we have otherclassesandhomework, asa professional,we have anever-endingto-dolist)  Wheneverpossible, there needstobe abalance of makingshort-termandlong-termdecisions. Ideallywe wanttoalwaysfocuson long-termdecisionsbutwe alsoneedtobe profitable inthe short runand we needto be aware of how our short-termdecisionsimpactourlong-term strategy.  If you believeyoucanmake greaterreturnscomparedto the interestrate whenleveragingdebt, we shouldborrowas muchas we can to generate value andprofits  There isa constantneedtoevaluate ourcompetitors’strategies,evaluate ourownstrategy, and ask “What-If”to make decisions –inmostcases,we stuck withour strategyandmade minor adjustmentsbutwe realize theremayhave beentimeswe neededtomake majorshifts dependingon variousfactors  There isa constantneedtoalwayslearnfromour mistakesaswell asbestpracticesmade by others  We foundone of the keysto our successwasthe fact that we had an in depthunderstandingof the rulesof the games – thisis similartoreal life where understandingbusinessbestpracticesas well asthe overall marketandindustrywill allowyoutocreate a competitive advantage
  • 15.
    15 FEEDBACK What We Liked:Whatdidyou like aboutthe simulationproject?  We were able to applymanyof the businessconceptsandframeworkslearnedinclassto operate the stimulationcompany,suchasthe strategicpositionandrelative source of advantage  We likedthe ideaof amovingsegmentbecause inreal life,productsgetolder,losesitsvalue overtime,anddifferentcustomershave differentbuyingcriteria  The balancedscorecardis useful togetthe projectedresultsrightaftermakingdecisions.  We have to considerothercompetitors'possible decisionsbefore makingourfinal decisions. Thisforcedus to put ourselvesinourcompetitor’sshoestosee whatwe woulddointheir position,includingwhattheywoulddofortheirproductstrategy,pricing,productionlevels,and marketing/sales.Thisforcedustothinkof differentscenarios andmake adecisionbasedonthe strategywe thought theywere goingtotake.  The simulationhighlightsthe positive impactsof long-terminvestments;we hadtomake  The simulationwasforgivingtoteamsthatmade massive lossesandseemedlikethey couldn’t come back from theirmassive emergencyloans  We likedhowthe game wasflexibleinthe sense thatthere are a varietyof strategieswe could have taken  We likedhowthe game hada recessioninthe middle rounds,makingitmore realisticand reflectiveof real life What We Didn’t Like:What didyou findfrustratingand/orrecommenddoingdifferently?  It requireshuge amountof time atthe beginningtogetto understandthe game andhow to performeffectively.While thiswasfun,itwasalsoveryfrustratingwhenwe made decisionsin earlierroundsthatwe thoughtwere rightbutendedupworkingagainstusbecause of factors we didn’tconsider,suchasforecastingcorrectlyandhow that impactsour income statement.  We were frustratedattime whenwe workedhardtoput togetheranideal productsegmentand we believedwe wouldgetagreatermarketshare andlostout to inferiorproductswithless marketingandsalesbudget Recommendations:  It wouldbe more valuable if there were more add-onssowe have more variableswe canlearn withand have more optionstodifferentiateourcompanyfromcompetitors  We thinkthe gradingcriteriashouldincludethe cumulative profittoavoidmanipulatingthe results  More practice roundswouldbe useful forusto make trialsand errors,while havingmore real roundscan trulydistinguishthe winningandlosingteams.We recommendhaving3practice roundsfirst,andhaving2 real roundsineach of the followingweeks.  We shouldhave more time tolearnaboutthe simulationrulesbefore startingthe firstpractice rounds.We recommendstartingthe firstpractice roundinWeek3 insteadof Week2.In Week 2, each groupcan have some in-classdiscussiononthe simulationrules.If all teamsare able to understandfullythe simulationrulesbefore the real rounds,thenthe final resultismore likely to dependonthe strategyof each teammade inthe real rounds.
  • 16.
    APPENDIX A: SCORESEACH ROUND Andrews Round Stock Price Market Cap Avg ROE Credit Leverage Stock Points MktCap Points ROE Points Credit Points Lev. Points SCORE Round1 $22.68 45,349,975 -3.29 CC 2.33 100.00 99.73 100.00 41.67 100.00 91.20 Round2 $24.02 46,978,456 -16 CC 2.33 100.00 100.00 50.44 41.67 100.00 83.82 Round3 $30.30 60,280,969 1.74 CCC 2.22 100.00 75.54 100.00 50.00 100.00 87.61 Round4 $35.11 69,268,009 3.09 CCC 2.14 80.40 52.66 100.00 50.00 100.00 76.17 Round5 $32.80 68,528,949 3.44 B 1.88 60.91 30.69 86.65 58.33 100.00 64.20 Round6 $10.76 26,963,965 -0.03 C 2.72 17.68 10.68 0.00 33.33 100.00 28.32 Round7 $1.00 2,506,969 -0.74 C 3.29 1.59 0.96 0.00 33.33 50.00 13.25 Round8 $42.04 100,145,743 1.47 B 2.04 54.85 33.16 9.37 58.33 100.00 50.98 Baldwin Round Stock Price Market Cap Avg ROE Credit Leverage Stock Points MktCap Points ROE Points Credit Points Lev. Points SCORE Round1 $9.34 19,231,599 -13.07 CC 2.65 41.18 42.29 25.17 41.67 100.00 47.90 Round2 $12.76 27,640,052 -8.07 CC 2.35 53.12 58.84 100.00 41.67 100.00 66.61 Round3 $19.95 51,011,244 -4.49 CCC 2.19 65.84 63.92 0.00 50.00 100.00 58.33 Round4 $21.94 56,094,734 -2.97 CCC 2.22 50.24 42.65 0.00 50.00 100.00 48.61 Round5 $22.28 56,970,016 -1.95 B 1.87 41.37 25.51 0.00 58.33 100.00 43.33 Round6 $1.00 2,557,137 -6.36 C 2.77 1.64 1.01 0.00 33.33 100.00 20.78 Round7 $1.00 2,557,137 -15.04 DDD 3.54 1.59 0.98 0.00 25.00 0.00 4.50 Round8 $1.00 2,557,137 -18.03 CC 2.56 1.30 0.85 0.00 41.67 100.00 21.88
  • 17.
    17 Chester Round Stock Price Market Cap Avg ROECredit Leverage Stock Points MktCap Points ROE Points Credit Points Lev. Points SCORE Round1 $1.00 2,145,970 -34.16 DDD 3.57 4.41 4.72 9.63 25.00 0.00 7.68 Round2 $1.00 2,038,970 -29.45 DDD 3.51 4.16 4.34 27.40 25.00 0.00 10.19 Round3 $23.82 46,142,798 -13.21 CCC 2.22 78.61 57.82 0.00 50.00 100.00 61.58 Round4 $43.67 84,596,227 -5.71 B 1.92 100.00 64.32 0.00 58.33 100.00 71.61 Round5 $10.72 24,915,559 -8.73 CCC 2.22 19.91 11.16 0.00 50.00 100.00 31.70 Round6 $17.32 38,244,443 -6.65 BB 1.86 17.68 10.68 0.00 33.33 100.00 28.32 Round7 $1.00 2,097,781 -9.85 C 3.34 1.59 0.81 0.00 33.33 0.00 5.72 Round8 $13.31 26,534,264 15.69 DDD 4.70 17.36 8.79 100.00 25.00 0.00 26.59 Digby Round Stock Price Market Cap Avg ROE Credit Leverage Stock Points MktCap Points ROE Points Credit Points Lev. Points SCORE Round1 $18.95 45,470,847 -11.77 CCC 2.28 83.55 100.00 27.95 50.00 100.00 75.94 Round2 $11.04 31,803,919 -9.4 CC 2.33 45.96 67.70 85.85 41.67 100.00 63.75 Round3 $23.09 79,801,024 -3.55 CCC 2.11 76.20 100.00 0.00 50.00 100.00 69.17 Round4 $31.72 131,530,136 -0.75 BB 1.88 72.64 100.00 0.00 66.67 100.00 70.42 Round5 $53.85 223,299,278 3.97 BB 1.78 100.00 100.00 100.00 66.67 50.00 87.50 Round6 $60.86 252,384,556 6.11 BB 2.01 100.00 100.00 100.00 66.67 100.00 95.00 Round7 $62.80 260,406,265 7.12 B 1.90 100.00 100.00 100.00 58.33 100.00 93.75 Round8 $76.65 301,965,785 8.15 BB 1.89 100.00 100.00 51.94 66.67 100.00 87.79
  • 18.
    APPENDIX B: RANKEACH ROUND RANK Round 1 Round 2 Round 3 Round 4 Round 5 Round 6 Round 7 Round 8 Andrews 1 1 1 1 2 2 2 2 Baldwin 3 2 4 4 3 4 4 4 Chester 4 4 3 2 4 3 3 3 Digby 2 3 2 3 1 1 1 1
  • 19.
    19 APPENDIX C: PERFORMANCEIN INDIVIDUALCRITERIA EACH AROUND Stock Price Round 1 Round 2 Round 3 Round 4 Round 5 Round 6 Round 7 Round 8 Andrews $22.68 $24.02 $30.30 $35.11 $32.80 $10.76 $1.00 $42.04 Baldwin $9.34 $12.76 $19.95 $21.94 $22.28 $1.00 $1.00 $1.00 Chester $1.00 $1.00 $23.82 $43.67 $10.72 $17.32 $1.00 $13.31 Digby $18.95 $11.04 $23.09 $31.72 $53.85 $60.86 $62.80 $76.65 Market Cap Round 1 Round 2 Round 3 Round 4 Round 5 Round 6 Round 7 Round 8 Andrews 45,349,975 46,978,456 60,280,969 69,268,009 68,528,949 26,963,965 2,506,969 100,145,743 Baldwin 19,231,599 27,640,052 51,011,244 56,094,734 56,970,016 2,557,137 2,557,137 2,557,137 Chester 2,145,970 2,038,970 46,142,798 84,596,227 24,915,559 38,244,443 2,097,781 26,534,264 Digby 45,470,847 31,803,919 79,801,024 131,530,136 223,299,278 252,384,556 260,406,265 301,965,785 Avg ROE Round 1 Round 2 Round 3 Round 4 Round 5 Round 6 Round 7 Round 8 Andrews -3.29 -16 1.74 3.09 3.44 -0.03 -0.74 1.47 Baldwin -13.07 -8.07 -4.49 -2.97 -1.95 -6.36 -15.04 -18.03 Chester -34.16 -29.45 -13.21 -5.71 -8.73 -6.65 -9.85 15.69 Digby -11.77 -9.4 -3.55 -0.75 3.97 6.11 7.12 8.15 Credit Round 1 Round 2 Round 3 Round 4 Round 5 Round 6 Round 7 Round 8 Andrews CC CC CCC CCC B C C B Baldwin CC CC CCC CCC B C DDD CC Chester DDD DDD CCC B CCC BB C DDD Digby CCC CC CCC BB BB BB B BB Leverage Round 1 Round 2 Round 3 Round 4 Round 5 Round 6 Round 7 Round 8 Andrews 2.33 2.33 2.22 2.14 1.88 2.72 3.29 2.04 Baldwin 2.65 2.35 2.19 2.22 1.87 2.77 3.54 2.56 Chester 3.57 3.51 2.22 1.92 2.22 1.86 3.34 4.70 Digby 2.28 2.33 2.11 1.88 1.78 2.01 1.90 1.89
  • 20.
    20 APPENDIX D: UNITCOSTSFOR TRADITIONAL SEGMENT Price Round 0 Round 1 Round 2 Round 3 Round 4 Round 5 Round 6 Round 7 Round 8 Andrews $28.00 $26.00 $25.25 $25.10 $26.00 $26.60 $22.50 $20.75 $18.50 Baldwin $28.00 $25.00 $24.50 $24.50 $24.50 $25.00 $24.50 $22.00 $0.00 Chester $28.00 $25.00 $25.00 $25.00 $25.00 $23.00 $28.49 $27.60 $26.00 Digby $28.00 $26.10 $25.60 $25.10 $28.00 $24.15 $22.50 $19.30 $16.00 Material Cost Round 0 Round 1 Round 2 Round 3 Round 4 Round 5 Round 6 Round 7 Round 8 Andrews $11.59 $9.80 $9.52 $8.72 $8.47 $7.80 $8.18 $8.08 $7.50 Baldwin $11.59 $10.85 $10.28 $9.72 $9.04 $8.63 $8.09 $7.09 $0.00 Chester $11.59 $10.85 $10.66 $9.85 $9.13 $8.06 $9.75 $8.99 $0.00 Digby $11.59 $9.80 $8.95 $8.18 $9.67 $8.38 $7.69 $7.30 $6.78 Labour Cost Round 0 Round 1 Round 2 Round 3 Round 4 Round 5 Round 6 Round 7 Round 8 Andrews $7.49 $7.85 $7.64 $8.18 $8.56 $8.75 $8.31 $7.52 $7.70 Baldwin $7.49 $8.59 $8.22 $8.09 $8.74 $7.89 $7.73 $5.92 $0.00 Chester $7.49 $9.18 $8.23 $8.93 $9.45 $8.87 $10.00 $11.06 $0.00 Digby $7.49 $8.22 $6.46 $6.77 $7.84 $4.86 $2.74 $1.38 $1.12 Other Costs (Inventory Holding, Previous Stock Cost) Round 0 Round 1 Round 2 Round 3 Round 4 Round 5 Round 6 Round 7 Round 8 Andrews $0.80 $2.37 $0.77 $0.17 $0.13 $0.47 -$0.07 $0.38 $0.34 Baldwin $0.80 $2.31 $0.86 $0.32 $0.35 $0.23 $0.59 $8.33 $0.00 Chester $0.80 $2.47 $1.11 $0.22 $0.17 $2.62 $1.05 $1.75 $20.28 Digby $0.80 $2.34 $2.77 $0.86 $1.53 $0.28 $0.15 $0.39 $0.42 Total Unit Cost Round 0 Round 1 Round 2 Round 3 Round 4 Round 5 Round 6 Round 7 Round 8 Andrews $19.88 $20.02 $17.93 $17.07 $17.16 $17.02 $16.43 $15.98 $15.54 Baldwin $19.88 $21.75 $19.36 $18.13 $18.13 $16.75 $16.42 $21.34 $0.00 Chester $19.88 $22.50 $20.00 $19.00 $18.75 $19.55 $20.80 $21.80 $20.28 Digby $19.88 $20.36 $18.18 $15.81 $19.04 $13.52 $10.58 $9.07 $8.32