- Aetna reported total revenue of $5.4 billion for Q1 2005, up 12.6% from $4.8 billion in Q1 2004. Net income increased 16.2% to $424 million.
- Health care premium revenue increased 13.7% to $4.1 billion, driven by growth in commercial and Medicare membership. However, medical costs ratios improved as prior period estimates were favorable.
- Operating margins increased both pre-tax and after-tax due to higher premium revenue and lower than estimated medical costs. Overall operating expenses decreased as a percentage of revenue.
- Total medical membership grew 7.3% to 14.4 million members, with strong growth across all product lines
how can I sell my pi coins for cash in a pi APPDOT TECH
You can't sell your pi coins in the pi network app. because it is not listed yet on any exchange.
The only way you can sell is by trading your pi coins with an investor (a person looking forward to hold massive amounts of pi coins before mainnet launch) .
You don't need to meet the investor directly all the trades are done with a pi vendor/merchant (a person that buys the pi coins from miners and resell it to investors)
I Will leave The telegram contact of my personal pi vendor, if you are finding a legitimate one.
@Pi_vendor_247
#pi network
#pi coins
#money
Falcon stands out as a top-tier P2P Invoice Discounting platform in India, bridging esteemed blue-chip companies and eager investors. Our goal is to transform the investment landscape in India by establishing a comprehensive destination for borrowers and investors with diverse profiles and needs, all while minimizing risk. What sets Falcon apart is the elimination of intermediaries such as commercial banks and depository institutions, allowing investors to enjoy higher yields.
how to sell pi coins in all Africa Countries.DOT TECH
Yes. You can sell your pi network for other cryptocurrencies like Bitcoin, usdt , Ethereum and other currencies And this is done easily with the help from a pi merchant.
What is a pi merchant ?
Since pi is not launched yet in any exchange. The only way you can sell right now is through merchants.
A verified Pi merchant is someone who buys pi network coins from miners and resell them to investors looking forward to hold massive quantities of pi coins before mainnet launch in 2026.
I will leave the telegram contact of my personal pi merchant to trade with.
@Pi_vendor_247
What price will pi network be listed on exchangesDOT TECH
The rate at which pi will be listed is practically unknown. But due to speculations surrounding it the predicted rate is tends to be from 30$ — 50$.
So if you are interested in selling your pi network coins at a high rate tho. Or you can't wait till the mainnet launch in 2026. You can easily trade your pi coins with a merchant.
A merchant is someone who buys pi coins from miners and resell them to Investors looking forward to hold massive quantities till mainnet launch.
I will leave the telegram contact of my personal pi vendor to trade with.
@Pi_vendor_247
Falcon stands out as a top-tier P2P Invoice Discounting platform in India, bridging esteemed blue-chip companies and eager investors. Our goal is to transform the investment landscape in India by establishing a comprehensive destination for borrowers and investors with diverse profiles and needs, all while minimizing risk. What sets Falcon apart is the elimination of intermediaries such as commercial banks and depository institutions, allowing investors to enjoy higher yields.
The European Unemployment Puzzle: implications from population agingGRAPE
We study the link between the evolving age structure of the working population and unemployment. We build a large new Keynesian OLG model with a realistic age structure, labor market frictions, sticky prices, and aggregate shocks. Once calibrated to the European economy, we quantify the extent to which demographic changes over the last three decades have contributed to the decline of the unemployment rate. Our findings yield important implications for the future evolution of unemployment given the anticipated further aging of the working population in Europe. We also quantify the implications for optimal monetary policy: lowering inflation volatility becomes less costly in terms of GDP and unemployment volatility, which hints that optimal monetary policy may be more hawkish in an aging society. Finally, our results also propose a partial reversal of the European-US unemployment puzzle due to the fact that the share of young workers is expected to remain robust in the US.
The secret way to sell pi coins effortlessly.DOT TECH
Well as we all know pi isn't launched yet. But you can still sell your pi coins effortlessly because some whales in China are interested in holding massive pi coins. And they are willing to pay good money for it. If you are interested in selling I will leave a contact for you. Just telegram this number below. I sold about 3000 pi coins to him and he paid me immediately.
Telegram: @Pi_vendor_247
how to sell pi coins at high rate quickly.DOT TECH
Where can I sell my pi coins at a high rate.
Pi is not launched yet on any exchange. But one can easily sell his or her pi coins to investors who want to hold pi till mainnet launch.
This means crypto whales want to hold pi. And you can get a good rate for selling pi to them. I will leave the telegram contact of my personal pi vendor below.
A vendor is someone who buys from a miner and resell it to a holder or crypto whale.
Here is the telegram contact of my vendor:
@Pi_vendor_247
when will pi network coin be available on crypto exchange.DOT TECH
There is no set date for when Pi coins will enter the market.
However, the developers are working hard to get them released as soon as possible.
Once they are available, users will be able to exchange other cryptocurrencies for Pi coins on designated exchanges.
But for now the only way to sell your pi coins is through verified pi vendor.
Here is the telegram contact of my personal pi vendor
@Pi_vendor_247
how can I sell pi coins after successfully completing KYCDOT TECH
Pi coins is not launched yet in any exchange 💱 this means it's not swappable, the current pi displaying on coin market cap is the iou version of pi. And you can learn all about that on my previous post.
RIGHT NOW THE ONLY WAY you can sell pi coins is through verified pi merchants. A pi merchant is someone who buys pi coins and resell them to exchanges and crypto whales. Looking forward to hold massive quantities of pi coins before the mainnet launch.
This is because pi network is not doing any pre-sale or ico offerings, the only way to get my coins is from buying from miners. So a merchant facilitates the transactions between the miners and these exchanges holding pi.
I and my friends has sold more than 6000 pi coins successfully with this method. I will be happy to share the contact of my personal pi merchant. The one i trade with, if you have your own merchant you can trade with them. For those who are new.
Message: @Pi_vendor_247 on telegram.
I wouldn't advise you selling all percentage of the pi coins. Leave at least a before so its a win win during open mainnet. Have a nice day pioneers ♥️
#kyc #mainnet #picoins #pi #sellpi #piwallet
#pinetwork
how to sell pi coins in South Korea profitably.DOT TECH
Yes. You can sell your pi network coins in South Korea or any other country, by finding a verified pi merchant
What is a verified pi merchant?
Since pi network is not launched yet on any exchange, the only way you can sell pi coins is by selling to a verified pi merchant, and this is because pi network is not launched yet on any exchange and no pre-sale or ico offerings Is done on pi.
Since there is no pre-sale, the only way exchanges can get pi is by buying from miners. So a pi merchant facilitates these transactions by acting as a bridge for both transactions.
How can i find a pi vendor/merchant?
Well for those who haven't traded with a pi merchant or who don't already have one. I will leave the telegram id of my personal pi merchant who i trade pi with.
Tele gram: @Pi_vendor_247
#pi #sell #nigeria #pinetwork #picoins #sellpi #Nigerian #tradepi #pinetworkcoins #sellmypi
how to sell pi coins on Bitmart crypto exchangeDOT TECH
Yes. Pi network coins can be exchanged but not on bitmart exchange. Because pi network is still in the enclosed mainnet. The only way pioneers are able to trade pi coins is by reselling the pi coins to pi verified merchants.
A verified merchant is someone who buys pi network coins and resell it to exchanges looking forward to hold till mainnet launch.
I will leave the telegram contact of my personal pi merchant to trade with.
@Pi_vendor_247
how to swap pi coins to foreign currency withdrawable.DOT TECH
As of my last update, Pi is still in the testing phase and is not tradable on any exchanges.
However, Pi Network has announced plans to launch its Testnet and Mainnet in the future, which may include listing Pi on exchanges.
The current method for selling pi coins involves exchanging them with a pi vendor who purchases pi coins for investment reasons.
If you want to sell your pi coins, reach out to a pi vendor and sell them to anyone looking to sell pi coins from any country around the globe.
Below is the contact information for my personal pi vendor.
Telegram: @Pi_vendor_247
US Economic Outlook - Being Decided - M Capital Group August 2021.pdfpchutichetpong
The U.S. economy is continuing its impressive recovery from the COVID-19 pandemic and not slowing down despite re-occurring bumps. The U.S. savings rate reached its highest ever recorded level at 34% in April 2020 and Americans seem ready to spend. The sectors that had been hurt the most by the pandemic specifically reduced consumer spending, like retail, leisure, hospitality, and travel, are now experiencing massive growth in revenue and job openings.
Could this growth lead to a “Roaring Twenties”? As quickly as the U.S. economy contracted, experiencing a 9.1% drop in economic output relative to the business cycle in Q2 2020, the largest in recorded history, it has rebounded beyond expectations. This surprising growth seems to be fueled by the U.S. government’s aggressive fiscal and monetary policies, and an increase in consumer spending as mobility restrictions are lifted. Unemployment rates between June 2020 and June 2021 decreased by 5.2%, while the demand for labor is increasing, coupled with increasing wages to incentivize Americans to rejoin the labor force. Schools and businesses are expected to fully reopen soon. In parallel, vaccination rates across the country and the world continue to rise, with full vaccination rates of 50% and 14.8% respectively.
However, it is not completely smooth sailing from here. According to M Capital Group, the main risks that threaten the continued growth of the U.S. economy are inflation, unsettled trade relations, and another wave of Covid-19 mutations that could shut down the world again. Have we learned from the past year of COVID-19 and adapted our economy accordingly?
“In order for the U.S. economy to continue growing, whether there is another wave or not, the U.S. needs to focus on diversifying supply chains, supporting business investment, and maintaining consumer spending,” says Grace Feeley, a research analyst at M Capital Group.
While the economic indicators are positive, the risks are coming closer to manifesting and threatening such growth. The new variants spreading throughout the world, Delta, Lambda, and Gamma, are vaccine-resistant and muddy the predictions made about the economy and health of the country. These variants bring back the feeling of uncertainty that has wreaked havoc not only on the stock market but the mindset of people around the world. MCG provides unique insight on how to mitigate these risks to possibly ensure a bright economic future.
US Economic Outlook - Being Decided - M Capital Group August 2021.pdf
aetna table 2005 1st
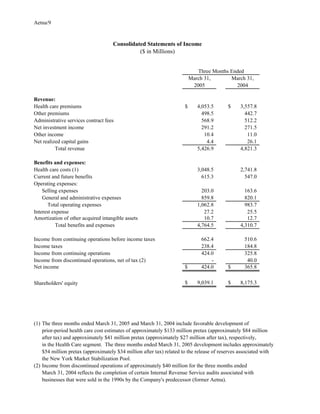
1. Aetna/9
Consolidated Statements of Income
($ in Millions)
Three Months Ended
March 31, March 31,
2005 2004
Revenue:
Health care premiums $ 4,053.5 $ 3,557.8
Other premiums 498.5 442.7
Administrative services contract fees 568.9 512.2
Net investment income 291.2 271.5
Other income 10.4 11.0
Net realized capital gains 4.4 26.1
Total revenue 5,426.9 4,821.3
Benefits and expenses:
Health care costs (1) 3,048.5 2,741.8
Current and future benefits 615.3 547.0
Operating expenses:
Selling expenses 203.0 163.6
General and administrative expenses 859.8 820.1
Total operating expenses 1,062.8 983.7
Interest expense 27.2 25.5
Amortization of other acquired intangible assets 10.7 12.7
Total benefits and expenses 4,764.5 4,310.7
Income from continuing operations before income taxes 662.4 510.6
Income taxes 238.4 184.8
Income from continuing operations 424.0 325.8
Income from discontinued operations, net of tax (2) - 40.0
Net income $ 424.0 $ 365.8
$ 9,039.1 $ 8,175.3
Shareholders' equity
(1) The three months ended March 31, 2005 and March 31, 2004 include favorable development of
prior-period health care cost estimates of approximately $133 million pretax (approximately $84 million
after tax) and approximately $41 million pretax (approximately $27 million after tax), respectively,
in the Health Care segment. The three months ended March 31, 2005 development includes approximately
$54 million pretax (approximately $34 million after tax) related to the release of reserves associated with
the New York Market Stabilization Pool.
(2) Income from discontinued operations of approximately $40 million for the three months ended
March 31, 2004 reflects the completion of certain Internal Revenue Service audits associated with
businesses that were sold in the 1990s by the Company's predecessor (former Aetna).
2. Aetna/10
Summary of Results (1)
($ in Millions)
Three Months Ended
March 31, March 31,
2005 2004
Operating earnings, excluding favorable development $ 337.1 $ 281.8
Favorable development of prior-period health care cost estimates 84.0 27.0
Operating earnings 421.1 308.8
Net realized capital gains 2.9 17.0
Income from continuing operations (GAAP measure) 424.0 325.8
Income from discontinued operations (2) - 40.0
Net income (GAAP measure) $ 424.0 $ 365.8
Weighted average common shares - basic 293,304,437 307,836,718
Weighted average common shares - diluted 306,006,348 320,835,386
Summary of Results Per Common Share (1)
Operating earnings, excluding favorable development $ 1.10 $ .88
Favorable development of prior-period health care cost estimates .28 .08
Operating earnings 1.38 .96
Net realized capital gains .01 .06
Income from continuing operations (GAAP measure) 1.39 1.02
Income from discontinued operations (2) - .12
Net income (GAAP measure) $ 1.39 $ 1.14
Shareholders' equity (3) $ 31.12 $ 26.82
(1) Prior period results per common share and weighted average common shares have been adjusted to reflect the
March 11, 2005 two-for-one stock split.
(2) Income from discontinued operations of approximately $40 million for the three months ended March 31, 2004
reflects the completion of certain Internal Revenue Service audits associated with former Aetna.
(3) Actual common shares outstanding were 290.4 million at March 31, 2005 and 304.9 million at March 31, 2004.
3. Aetna/11
Segment Information (1)
($ in Millions)
Three Months Ended
March 31, March 31,
2005 2004
Health Care:
Total revenue $ 4,693.9 $ 4,146.8
Selling expenses $ 183.9 $ 148.8
General and administrative expenses 812.3 775.4
Total operating expenses $ 996.2 $ 924.2
Operating earnings, excluding favorable development $ 320.0 $ 261.4
Favorable development of prior-period health care cost estimates 84.0 27.0
Operating earnings 404.0 288.4
Net realized capital gains 1.3 7.1
Net income (GAAP measure) $ 405.3 $ 295.5
Group Insurance:
Total revenue $ 534.7 $ 484.9
Selling expenses $ 19.1 $ 14.8
General and administrative expenses 42.6 39.7
Total operating expenses $ 61.7 $ 54.5
Operating earnings $ 30.7 $ 30.8
Net realized capital gains 1.4 7.9
Net income (GAAP measure) $ 32.1 $ 38.7
Large Case Pensions:
Total revenue $ 198.3 $ 189.6
Operating earnings $ 4.1 $ 6.1
Net realized capital gains .2 2.0
Net income (GAAP measure) $ 4.3 $ 8.1
Corporate Interest:
Interest expense, net of tax $ 17.7 $ 16.5
Total Company:
Total revenue $ 5,426.9 $ 4,821.3
Selling expenses $ 203.0 $ 163.6
General and administrative expenses 859.8 820.1
Total operating expenses $ 1,062.8 $ 983.7
(1) Revenue and operating expense information is presented before income taxes. Operating earnings information
is presented net of income taxes.
4. Aetna/12
Enrollment
(Members in Thousands)
March 31, March 31, December 31,
2005 2004 2004
Medical Membership:
Commercial 14,162 13,136 13,446
Medicare 101 102 97
Medicaid 112 106 113
Total Medical Membership 14,375 13,344 13,656
Dental Membership 12,791 11,214 11,932
Pharmacy Membership:
Pharmacy Benefit Management Services 8,505 7,693 7,989
Mail Order (1) 501 364 458
Total Pharmacy Membership 9,006 8,057 8,447
Group Insurance Membership 14,040 12,394 13,494
Aetna HealthFund® (2) 361 183 222
Health Care Medical Cost Ratios (3)
($ in Millions)
Three Months Ended
March 31, March 31,
2005 2004
Health Care Premiums:
Health Care Risk (A) $ 4,053.5 $ 3,557.8
Commercial Risk (B) $ 3,805.8 $ 3,326.2
Medicare (C) $ 247.7 $ 231.6
Health Care Costs:
Health Care Risk
Health care costs (D) (GAAP measure) $ 3,048.5 $ 2,741.8
Favorable development of prior-period health care cost estimates 133.0 41.0
Health care costs - Adjusted (E) $ 3,181.5 $ 2,782.8
Commercial Risk
Health care costs (F) (GAAP measure) $ 2,837.9 $ 2,546.3
Favorable development of prior-period health care cost estimates 127.0 36.0
Health care costs - Adjusted (G) $ 2,964.9 $ 2,582.3
Medicare
Health care costs (H) (GAAP measure) $ 210.6 $ 195.6
Favorable development of prior-period health care cost estimates 6.0 5.0
Health care costs - Adjusted (I) $ 216.6 $ 200.6
Health Care Medical Cost Ratios:
Health Care Risk (D)/(A) (GAAP measure) 75.2% 77.1%
Health Care Risk - Adjusted (E)/(A) 78.5% 78.2%
Commercial Risk (F)/(B) (GAAP measure) 74.6% 76.6%
Commercial Risk - Adjusted (G)/(B) 77.9% 77.6%
Medicare (H)/(C) (GAAP measure) 85.0% 84.5%
Medicare - Adjusted (I)/(C) 87.4% 86.6%
(1) Represents members who purchased medications through Aetna's mail order pharmacy during the quarterly period.
(2) Represents members in consumer-directed health plan products included in Aetna's Commercial medical membership.
(3) Health Care Risk includes all medical and dental risk products. Commercial Risk includes all medical and dental risk products except Medicare
and Medicaid. Risk includes all medical and dental products for which the Company assumes all or a majority of health care cost, utilization
or other risk.
5. Aetna/13
Operating Margins
($ in Millions)
Three Months Ended
March 31, March 31,
2005 2004
Reconciliation to Income from continuing operations before income taxes:
Operating earnings before income taxes, excluding interest expense, amortization of other
acquired intangible assets and favorable development (A) $ 562.9 $ 481.7
Favorable development of prior-period health care cost estimates 133.0 41.0
Operating earnings before income taxes, excluding interest expense and amortization of other
acquired intangible assets (B) 695.9 522.7
Interest expense (27.2) (25.5)
Amortization of other acquired intangible assets (10.7) (12.7)
Net realized capital gains 4.4 26.1
Income from continuing operations before income taxes (C) (GAAP measure) $ 662.4 $ 510.6
Reconciliation to Income from continuing operations:
Operating earnings, excluding interest expense, amortization of other acquired intangible
assets and favorable development (D) $ 361.8 $ 306.6
Favorable development of prior-period health care cost estimates, net of tax 84.0 27.0
Operating earnings, excluding interest expense and amortization of other acquired intangible
assets (E) 445.8 333.6
Interest expense, net of tax (17.7) (16.5)
Amortization of other acquired intangible assets, net of tax (7.0) (8.3)
Net realized capital gains, net of tax 2.9 17.0
Income from continuing operations (F) (GAAP measure) $ 424.0 $ 325.8
Reconciliation of Revenue:
Revenue, excluding net realized capital gains (G) $ 5,422.5 $ 4,795.2
Net realized capital gains 4.4 26.1
Total revenue (H) (GAAP measure) $ 5,426.9 $ 4,821.3
Operating Margins:
Pretax operating margin (B)/(G) 12.8% 10.9%
Pretax operating margin - Adjusted (A)/(G) 10.4% 10.0%
Pretax operating margin (C)/(H) (GAAP measure) 12.2% 10.6%
After-tax operating margin (E)/(G) 8.2% 7.0%
After-tax operating margin - Adjusted (D)/(G) 6.7% 6.4%
After-tax operating margin (F)/(H) (GAAP measure) 7.8% 6.8%
Operating Expenses
($ in Millions)
Total operating expenses (I) (GAAP measure) $ 1,062.8 $ 983.7
Operating Expenses Percentages:
Operating expenses as a % of revenue (I)/(G) 19.6% 20.5%
Total operating expenses as a % of total revenue (I)/(H) (GAAP measure) 19.6% 20.4%