Powerpoint from Marieke Gelissen, conceptmaker Ideeel+ for the Eutopia Academy Masterclass 2009 'Democracy in Action', which took place on July 11th 2009 in Centraal Museum, Utrecht.
This presentation was given at SMX \'09 up in Seattle. I cover a number of tools/applications companies can use to begin, grow and manage their Twitter efforts when hoping to gain a competitive edge in the social media space.
Empowering the Unbanked: The Vital Role of NBFCs in Promoting Financial Inclu...Vighnesh Shashtri
In India, financial inclusion remains a critical challenge, with a significant portion of the population still unbanked. Non-Banking Financial Companies (NBFCs) have emerged as key players in bridging this gap by providing financial services to those often overlooked by traditional banking institutions. This article delves into how NBFCs are fostering financial inclusion and empowering the unbanked.
Resume
• Real GDP growth slowed down due to problems with access to electricity caused by the destruction of manoeuvrable electricity generation by Russian drones and missiles.
• Exports and imports continued growing due to better logistics through the Ukrainian sea corridor and road. Polish farmers and drivers stopped blocking borders at the end of April.
• In April, both the Tax and Customs Services over-executed the revenue plan. Moreover, the NBU transferred twice the planned profit to the budget.
• The European side approved the Ukraine Plan, which the government adopted to determine indicators for the Ukraine Facility. That approval will allow Ukraine to receive a EUR 1.9 bn loan from the EU in May. At the same time, the EU provided Ukraine with a EUR 1.5 bn loan in April, as the government fulfilled five indicators under the Ukraine Plan.
• The USA has finally approved an aid package for Ukraine, which includes USD 7.8 bn of budget support; however, the conditions and timing of the assistance are still unknown.
• As in March, annual consumer inflation amounted to 3.2% yoy in April.
• At the April monetary policy meeting, the NBU again reduced the key policy rate from 14.5% to 13.5% per annum.
• Over the past four weeks, the hryvnia exchange rate has stabilized in the UAH 39-40 per USD range.
Falcon stands out as a top-tier P2P Invoice Discounting platform in India, bridging esteemed blue-chip companies and eager investors. Our goal is to transform the investment landscape in India by establishing a comprehensive destination for borrowers and investors with diverse profiles and needs, all while minimizing risk. What sets Falcon apart is the elimination of intermediaries such as commercial banks and depository institutions, allowing investors to enjoy higher yields.
Currently pi network is not tradable on binance or any other exchange because we are still in the enclosed mainnet.
Right now the only way to sell pi coins is by trading with a verified merchant.
What is a pi merchant?
A pi merchant is someone verified by pi network team and allowed to barter pi coins for goods and services.
Since pi network is not doing any pre-sale The only way exchanges like binance/huobi or crypto whales can get pi is by buying from miners. And a merchant stands in between the exchanges and the miners.
I will leave the telegram contact of my personal pi merchant. I and my friends has traded more than 6000pi coins successfully
Tele-gram
@Pi_vendor_247
USDA Loans in California: A Comprehensive Overview.pptxmarketing367770
USDA Loans in California: A Comprehensive Overview
If you're dreaming of owning a home in California's rural or suburban areas, a USDA loan might be the perfect solution. The U.S. Department of Agriculture (USDA) offers these loans to help low-to-moderate-income individuals and families achieve homeownership.
Key Features of USDA Loans:
Zero Down Payment: USDA loans require no down payment, making homeownership more accessible.
Competitive Interest Rates: These loans often come with lower interest rates compared to conventional loans.
Flexible Credit Requirements: USDA loans have more lenient credit score requirements, helping those with less-than-perfect credit.
Guaranteed Loan Program: The USDA guarantees a portion of the loan, reducing risk for lenders and expanding borrowing options.
Eligibility Criteria:
Location: The property must be located in a USDA-designated rural or suburban area. Many areas in California qualify.
Income Limits: Applicants must meet income guidelines, which vary by region and household size.
Primary Residence: The home must be used as the borrower's primary residence.
Application Process:
Find a USDA-Approved Lender: Not all lenders offer USDA loans, so it's essential to choose one approved by the USDA.
Pre-Qualification: Determine your eligibility and the amount you can borrow.
Property Search: Look for properties in eligible rural or suburban areas.
Loan Application: Submit your application, including financial and personal information.
Processing and Approval: The lender and USDA will review your application. If approved, you can proceed to closing.
USDA loans are an excellent option for those looking to buy a home in California's rural and suburban areas. With no down payment and flexible requirements, these loans make homeownership more attainable for many families. Explore your eligibility today and take the first step toward owning your dream home.
how can i use my minded pi coins I need some funds.DOT TECH
If you are interested in selling your pi coins, i have a verified pi merchant, who buys pi coins and resell them to exchanges looking forward to hold till mainnet launch.
Because the core team has announced that pi network will not be doing any pre-sale. The only way exchanges like huobi, bitmart and hotbit can get pi is by buying from miners.
Now a merchant stands in between these exchanges and the miners. As a link to make transactions smooth. Because right now in the enclosed mainnet you can't sell pi coins your self. You need the help of a merchant,
i will leave the telegram contact of my personal pi merchant below. 👇 I and my friends has traded more than 3000pi coins with him successfully.
@Pi_vendor_247
how to swap pi coins to foreign currency withdrawable.DOT TECH
As of my last update, Pi is still in the testing phase and is not tradable on any exchanges.
However, Pi Network has announced plans to launch its Testnet and Mainnet in the future, which may include listing Pi on exchanges.
The current method for selling pi coins involves exchanging them with a pi vendor who purchases pi coins for investment reasons.
If you want to sell your pi coins, reach out to a pi vendor and sell them to anyone looking to sell pi coins from any country around the globe.
Below is the contact information for my personal pi vendor.
Telegram: @Pi_vendor_247
Poonawalla Fincorp and IndusInd Bank Introduce New Co-Branded Credit Cardnickysharmasucks
The unveiling of the IndusInd Bank Poonawalla Fincorp eLITE RuPay Platinum Credit Card marks a notable milestone in the Indian financial landscape, showcasing a successful partnership between two leading institutions, Poonawalla Fincorp and IndusInd Bank. This co-branded credit card not only offers users a plethora of benefits but also reflects a commitment to innovation and adaptation. With a focus on providing value-driven and customer-centric solutions, this launch represents more than just a new product—it signifies a step towards redefining the banking experience for millions. Promising convenience, rewards, and a touch of luxury in everyday financial transactions, this collaboration aims to cater to the evolving needs of customers and set new standards in the industry.
what is the best method to sell pi coins in 2024DOT TECH
The best way to sell your pi coins safely is trading with an exchange..but since pi is not launched in any exchange, and second option is through a VERIFIED pi merchant.
Who is a pi merchant?
A pi merchant is someone who buys pi coins from miners and pioneers and resell them to Investors looking forward to hold massive amounts before mainnet launch in 2026.
I will leave the telegram contact of my personal pi merchant to trade pi coins with.
@Pi_vendor_247
Turin Startup Ecosystem 2024 - Ricerca sulle Startup e il Sistema dell'Innov...Quotidiano Piemontese
Turin Startup Ecosystem 2024
Una ricerca de il Club degli Investitori, in collaborazione con ToTeM Torino Tech Map e con il supporto della ESCP Business School e di Growth Capital
how to sell pi coins on Bitmart crypto exchangeDOT TECH
Yes. Pi network coins can be exchanged but not on bitmart exchange. Because pi network is still in the enclosed mainnet. The only way pioneers are able to trade pi coins is by reselling the pi coins to pi verified merchants.
A verified merchant is someone who buys pi network coins and resell it to exchanges looking forward to hold till mainnet launch.
I will leave the telegram contact of my personal pi merchant to trade with.
@Pi_vendor_247
What price will pi network be listed on exchangesDOT TECH
The rate at which pi will be listed is practically unknown. But due to speculations surrounding it the predicted rate is tends to be from 30$ — 50$.
So if you are interested in selling your pi network coins at a high rate tho. Or you can't wait till the mainnet launch in 2026. You can easily trade your pi coins with a merchant.
A merchant is someone who buys pi coins from miners and resell them to Investors looking forward to hold massive quantities till mainnet launch.
I will leave the telegram contact of my personal pi vendor to trade with.
@Pi_vendor_247
Greek trade a pillar of dynamic economic growth - European Business Review
aetna table 2006 1st
1. Aetna/8
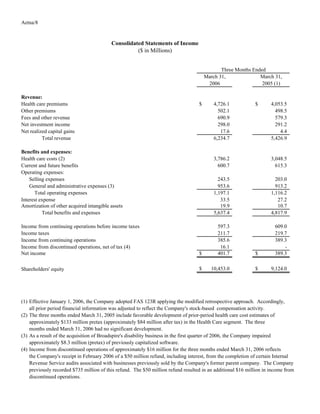
Consolidated Statements of Income
($ in Millions)
Three Months Ended
March 31, March 31,
2006 2005 (1)
Revenue:
Health care premiums $ 4,726.1 $ 4,053.5
Other premiums 502.1 498.5
Fees and other revenue 690.9 579.3
Net investment income 298.0 291.2
Net realized capital gains 17.6 4.4
Total revenue 6,234.7 5,426.9
Benefits and expenses:
Health care costs (2) 3,786.2 3,048.5
Current and future benefits 600.7 615.3
Operating expenses:
Selling expenses 243.5 203.0
General and administrative expenses (3) 953.6 913.2
Total operating expenses 1,197.1 1,116.2
Interest expense 33.5 27.2
Amortization of other acquired intangible assets 19.9 10.7
Total benefits and expenses 5,637.4 4,817.9
Income from continuing operations before income taxes 597.3 609.0
Income taxes 211.7 219.7
Income from continuing operations 385.6 389.3
Income from discontinued operations, net of tax (4) 16.1 -
Net income $ 401.7 $ 389.3
$ 10,453.0 $ 9,124.0
Shareholders' equity
(1) Effective January 1, 2006, the Company adopted FAS 123R applying the modified retrospective approach. Accordingly,
all prior period financial information was adjusted to reflect the Company's stock-based compensation activity.
(2) The three months ended March 31, 2005 include favorable development of prior-period health care cost estimates of
approximately $133 million pretax (approximately $84 million after tax) in the Health Care segment. The three
months ended March 31, 2006 had no significant development.
(3) As a result of the acquisition of Broadspire's disability business in the first quarter of 2006, the Company impaired
approximately $8.3 million (pretax) of previously capitalized software.
(4) Income from discontinued operations of approximately $16 million for the three months ended March 31, 2006 reflects
the Company's receipt in February 2006 of a $50 million refund, including interest, from the completion of certain Internal
Revenue Service audits associated with businesses previously sold by the Company's former parent company. The Company
previously recorded $735 million of this refund. The $50 million refund resulted in an additional $16 million in income from
discontinued operations.
2. Aetna/9
Summary of Results
(in Millions)
Three Months Ended
March 31, March 31,
2006 2005 (1)
Operating earnings, excluding favorable development $ 380.3 $ 302.4
Favorable development of prior-period health care cost estimates - 84.0
Operating earnings 380.3 386.4
Acquisition related software charge (6.2) -
Net realized capital gains 11.5 2.9
Income from continuing operations (GAAP measure) 385.6 389.3
Income from discontinued operations (2) 16.1 -
Net income (GAAP measure) $ 401.7 $ 389.3
Weighted average common shares - basic 567.4 586.6
Weighted average common shares - diluted 593.1 613.0
Summary of Results Per Common Share
Operating earnings, excluding favorable development $ .64 $ .49
Favorable development of prior-period health care cost estimates - .14
Operating earnings .64 .63
Acquisition related software charge (.01) -
Net realized capital gains .02 .01
Income from continuing operations (GAAP measure) .65 .64
Income from discontinued operations (2) .03 -
Net income (GAAP measure) $ .68 $ .64
Shareholders' equity (3) $ 18.44 $ 15.71
(1) Effective January 1, 2006, the Company adopted FAS 123R applying the modified retrospective approach. Accordingly, all prior period
financial information was adjusted to reflect the Company's stock-based compensation activity. Additionally, results per common share
and weighted average common shares have been adjusted to reflect the February 17, 2006 two-for-one stock split.
(2) Income from discontinued operations of approximately $16 million for the three months ended March 31, 2006 reflects the Company's
receipt in February 2006 of a $50 million refund, including interest, from the completion of certain Internal Revenue Service audits
associated with businesses previously sold by the Company's former parent company. The Company previously recorded $735 million
of this refund. The $50 million refund resulted in an additional $16 million in income from discontinued operations.
(3) Actual common shares outstanding were 567.0 million at March 31, 2006 and 580.9 million at March 31, 2005.
3. Aetna/10
Segment Information (1)
($ in Millions)
Three Months Ended
March 31, March 31,
2006 2005 (2)
Health Care:
Total revenue $ 5,495.9 $ 4,693.9
Selling expenses $ 221.4 $ 183.9
General and administrative expenses 899.0 863.9
Total operating expenses $ 1,120.4 $ 1,047.8
Operating earnings, excluding favorable development $ 360.6 $ 286.5
Favorable development of prior-period health care cost estimates - 84.0
Operating earnings 360.6 370.5
Net realized capital gains 3.7 1.3
Net income (GAAP measure) $ 364.3 $ 371.8
Group Insurance:
Total revenue $ 535.2 $ 534.7
Selling expenses $ 22.1 $ 19.1
General and administrative expenses 41.9 44.4
Operating expenses, excluding other item 64.0 63.5
Acquisition related software charge 8.3 -
Total operating expenses (GAAP measure) $ 72.3 $ 63.5
Operating earnings $ 32.2 $ 29.5
Acquisition related software charge (6.2) -
Net realized capital gains 2.2 1.4
Net income (GAAP measure) $ 28.2 $ 30.9
Large Case Pensions:
Total revenue $ 203.6 $ 198.3
Operating earnings $ 9.3 $ 4.1
Net realized capital gains 5.6 .2
Net income (GAAP measure) $ 14.9 $ 4.3
Corporate Interest:
Interest expense, net of tax $ 21.8 $ 17.7
Total Company:
Total revenue $ 6,234.7 $ 5,426.9
Selling expenses $ 243.5 $ 203.0
General and administrative expenses 945.3 913.2
Operating expenses, excluding other item 1,188.8 1,116.2
Acquisition related software charge 8.3 -
Total operating expenses (GAAP measure) $ 1,197.1 $ 1,116.2
(1) Revenue and operating expense information is presented before income taxes. Operating earnings information is presented
net of income taxes.
(2) Effective January 1, 2006, the Company adopted FAS 123R applying the modified retrospective approach. Accordingly,
all prior period financial information was adjusted to reflect the Company's stock-based compensation activity.
4. Aetna/11
Enrollment
(Members in Thousands)
March 31, March 31, December 31,
2006 2005 2005
Medical Membership:
Commercial 15,176 14,162 14,521
Medicare (1) 132 101 120
Medicaid 110 112 114
Total Medical Membership 15,418 14,375 14,755
Dental Membership 13,331 12,833 13,098
Pharmacy Membership: (2)
Pharmacy Benefit Management Services 9,557 8,505 8,885
Mail Order 594 501 560
Total Pharmacy Membership 10,151 9,006 9,445
Medicare PDP (stand-alone) 278 - -
Medicare Advantage PDP 107 - -
Consumer-Directed Health Plans (3) 614 404 453
Group Insurance Membership (4) 13,089 14,040 13,618
Health Care Medical Cost Ratios (5)
($ in Millions)
Three Months Ended
March 31, March 31,
2006 2005
Health Care Premiums:
Health Care Risk (A) $ 4,726.1 $ 4,053.5
Commercial Risk (B) $ 4,296.5 $ 3,805.8
Medicare (C) $ 429.6 $ 247.7
Health Care Costs:
Health Care Risk
Health care costs (D) (GAAP measure) $ 3,786.2 $ 3,048.5
Favorable development of prior-period health care cost estimates - 133.0
Health care costs - Adjusted (E) $ 3,786.2 $ 3,181.5
Commercial Risk
Health care costs (F) (GAAP measure) $ 3,411.2 $ 2,837.9
Favorable development of prior-period health care cost estimates - 127.0
Health care costs - Adjusted (G) $ 3,411.2 $ 2,964.9
Medicare
Health care costs (H) (GAAP measure) $ 375.0 $ 210.6
Favorable development of prior-period health care cost estimates - 6.0
Health care costs - Adjusted (I) $ 375.0 $ 216.6
Health Care Medical Cost Ratios:
Health Care Risk (D)/(A) (GAAP measure) 80.1% 75.2%
Health Care Risk - Adjusted (E)/(A) 80.1% 78.5%
Commercial Risk (F)/(B) (GAAP measure) 79.4% 74.6%
Commercial Risk - Adjusted (G)/(B) 79.4% 77.9%
Medicare (H)/(C) (GAAP measure) 87.3% 85.0%
Medicare - Adjusted (I)/(C) 87.3% 87.4%
(1) Includes 15 thousand and 19 thousand Medicare ASC members at March 31, 2006 and December 31, 2005, respectively, that represent those
members served through the Company's participation in the Medicare Health Support Program.
(2) Includes 278 thousand Medicare PDP (stand-alone) and 107 thousand Medicare Advantage PDP members at March 31, 2006. Mail Order represents
members who purchased medications through the Company's mail order pharmacy during the quarterly period.
(3) Represents members in consumer-directed health plans included in the Company's Commercial medical membership.
(4) Excludes approximately 2.4 million disability members acquired from Broadspire on March 31, 2006.
(5) Health Care Risk includes all medical and dental risk products. Commercial Risk includes all medical and dental risk products except Medicare and
Medicaid. Risk includes all medical and dental products for which the Company assumes all or a majority of health care cost, utilization or other risk.
5. Aetna/12
Operating Margins
($ in Millions)
Three Months Ended
March 31, March 31,
2006 2005 (1)
Reconciliation to Income from continuing operations before income taxes:
Operating earnings before income taxes, excluding interest expense, amortization of other
acquired intangible assets and favorable development (A) $ 641.4 $ 509.5
Favorable development of prior-period health care cost estimates - 133.0
Operating earnings before income taxes, excluding interest expense and amortization of other
acquired intangible assets (B) 641.4 642.5
Interest expense (33.5) (27.2)
Amortization of other acquired intangible assets (19.9) (10.7)
Acquisition related software charge (8.3) -
Net realized capital gains 17.6 4.4
Income from continuing operations before income taxes (C) (GAAP measure) $ 597.3 $ 609.0
Reconciliation to Income from continuing operations:
Operating earnings, excluding interest expense, amortization of other acquired intangible
assets and favorable development (D) $ 415.0 $ 327.1
Favorable development of prior-period health care cost estimates, net of tax - 84.0
Operating earnings, excluding interest expense and amortization of other acquired intangible
assets (E) 415.0 411.1
Interest expense, net of tax (21.8) (17.7)
Amortization of other acquired intangible assets, net of tax (12.9) (7.0)
Acquisition related software charge, net of tax (6.2) -
Net realized capital gains, net of tax 11.5 2.9
Income from continuing operations (F) (GAAP measure) $ 385.6 $ 389.3
Reconciliation of Revenue:
Revenue, excluding net realized capital gains (G) $ 6,217.1 $ 5,422.5
Net realized capital gains 17.6 4.4
Total revenue (H) (GAAP measure) $ 6,234.7 $ 5,426.9
Operating Margins:
Pretax operating margin (B)/(G) 10.3% 11.8%
Pretax operating margin - Adjusted (A)/(G) 10.3% 9.4%
Pretax operating margin (C)/(H) (GAAP measure) 9.6% 11.2%
After-tax operating margin (E)/(G) 6.7% 7.6%
After-tax operating margin - Adjusted (D)/(G) 6.7% 6.0%
After-tax operating margin (F)/(H) (GAAP measure) 6.2% 7.2%
Operating Expenses
($ in Millions)
Reconciliation of Operating Expenses:
Operating expenses, excluding other item (I) $ 1,188.8 $ 1,116.2
Acquisition related software charge 8.3 -
Total operating expenses (J) (GAAP measure) $ 1,197.1 $ 1,116.2
Operating Expenses Percentages:
Operating expenses as a % of revenue (I)/(G) 19.1% 20.6%
Total operating expenses as a % of total revenue (J)/(H) (GAAP measure) 19.2% 20.6%
(1) Effective January 1, 2006, the Company adopted FAS 123R applying the modified retrospective approach. Accordingly,
all prior period financial information was adjusted to reflect the Company's stock-based compensation activity.