Download to read offline

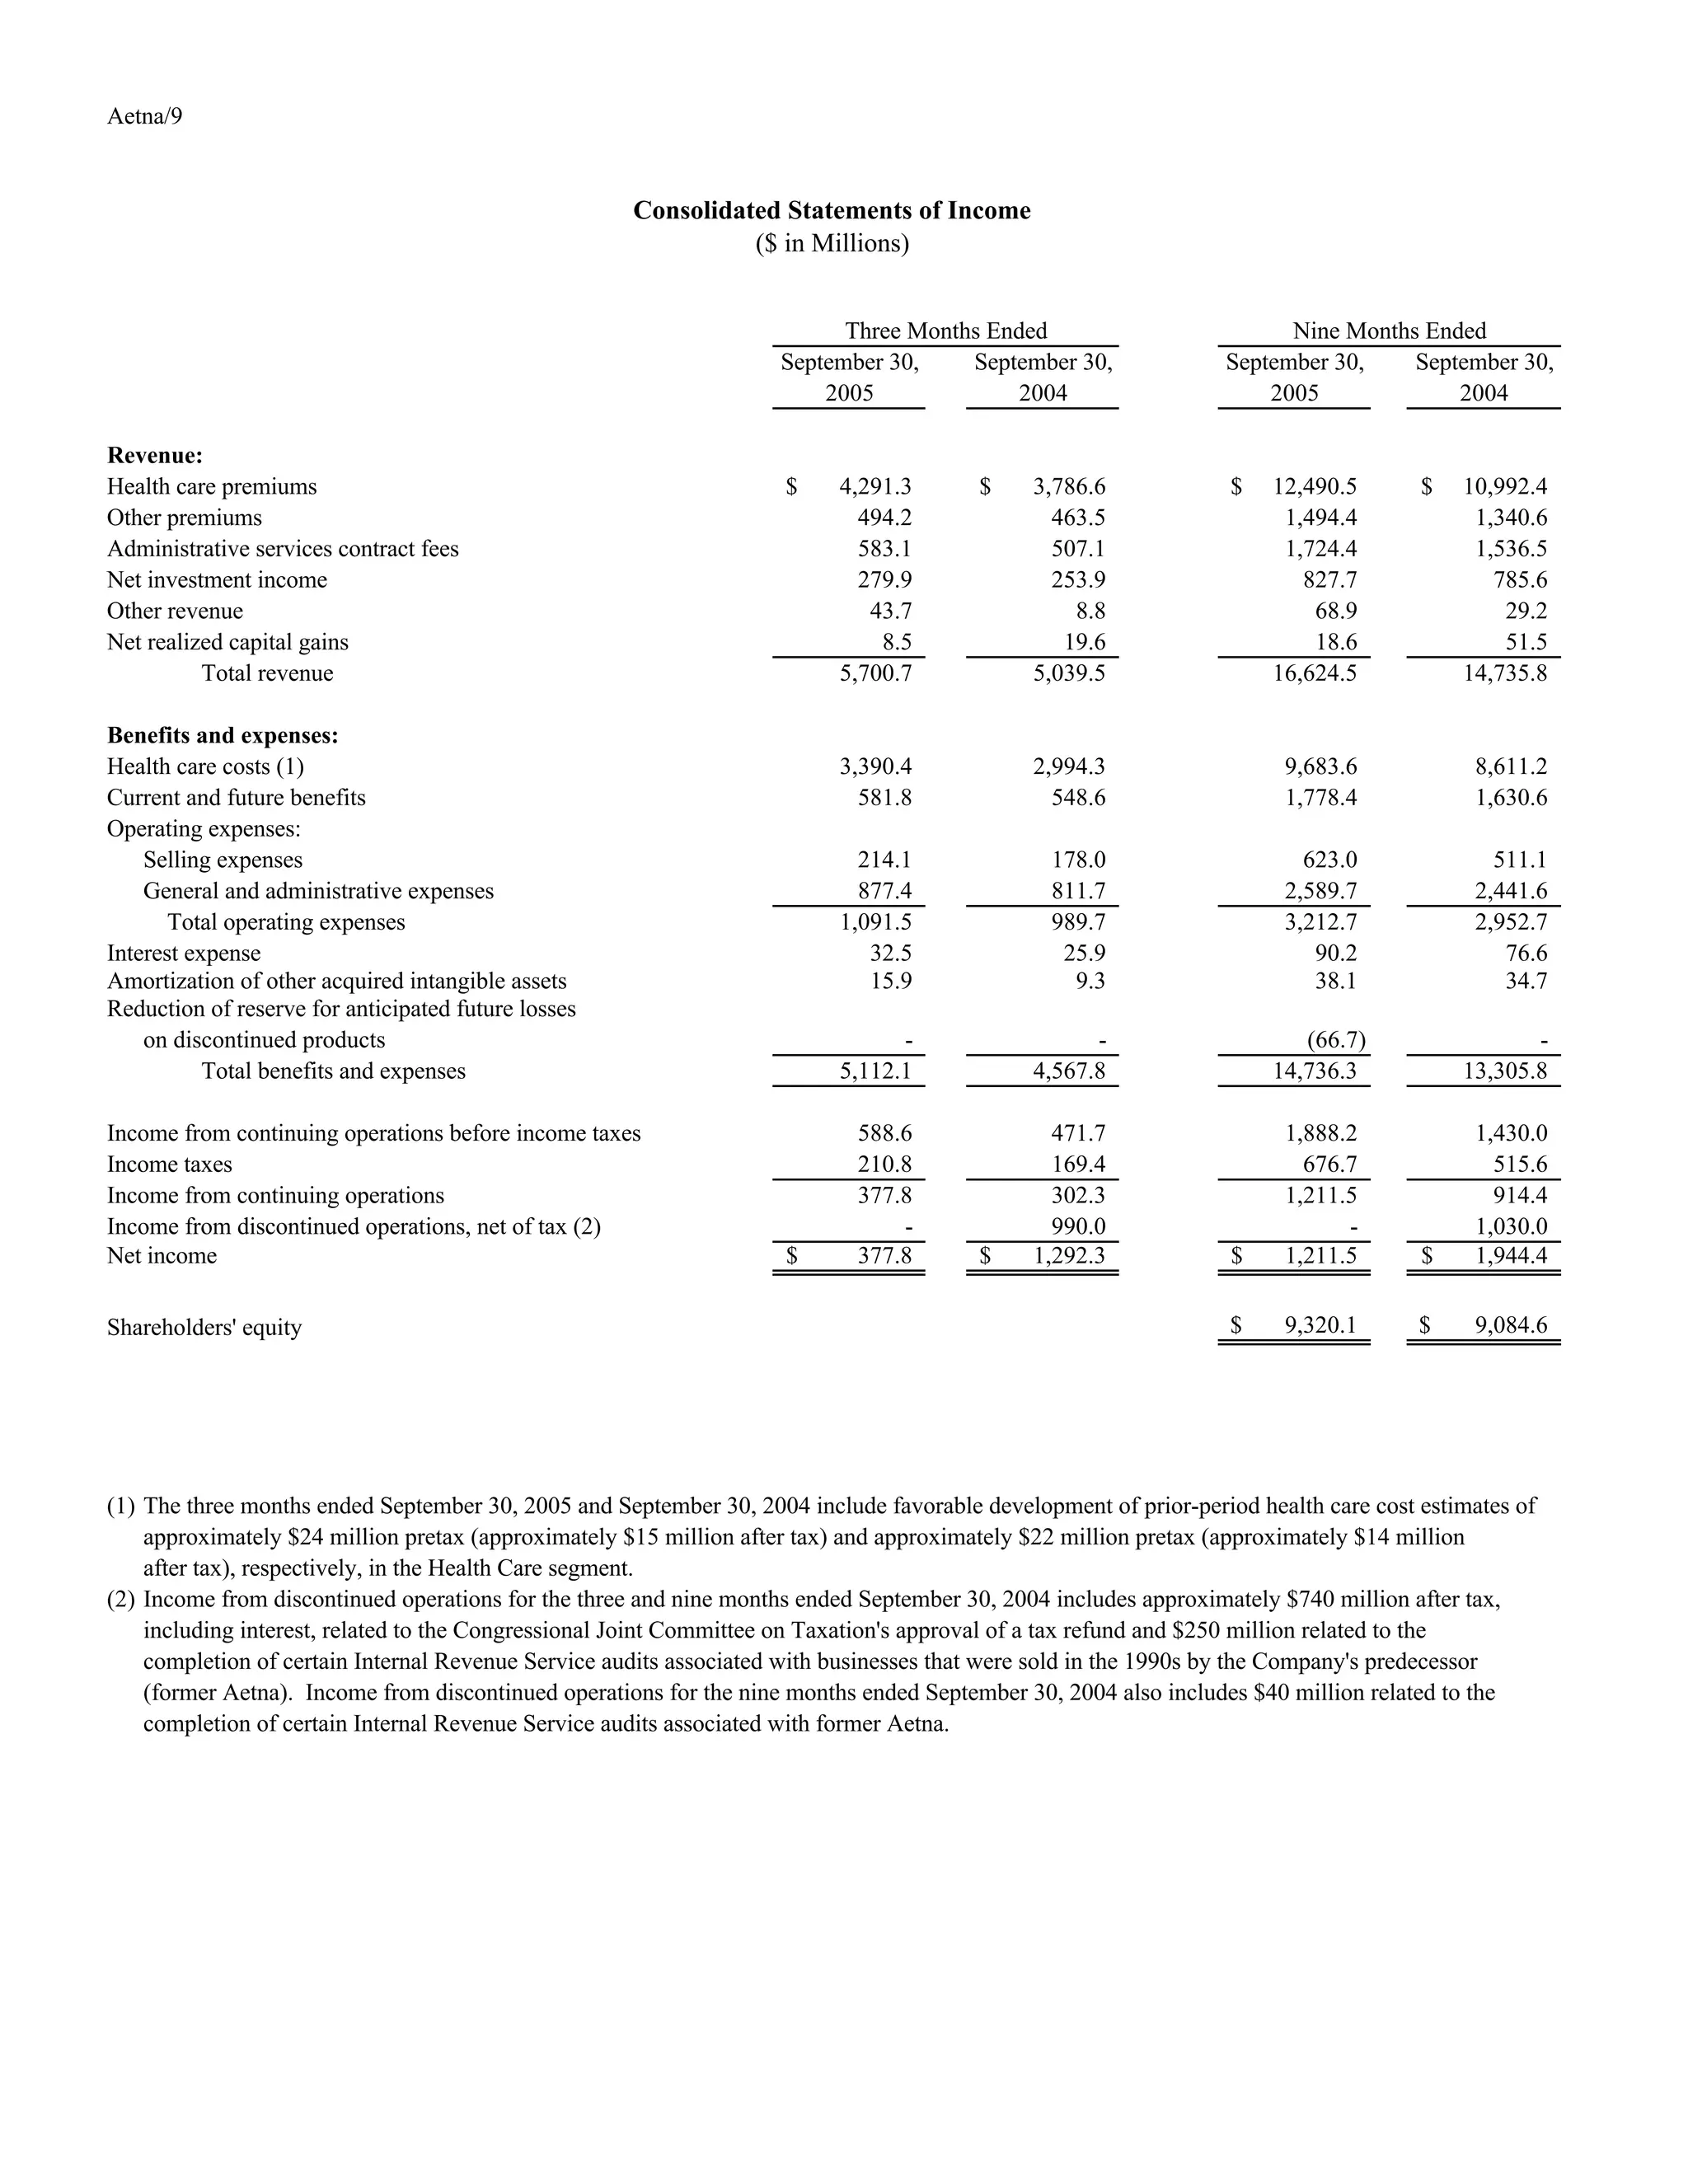
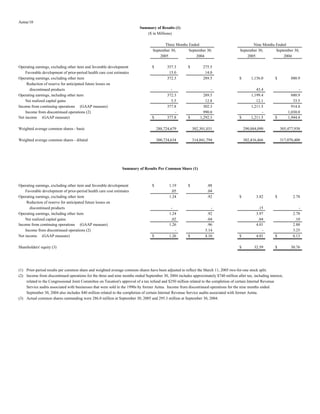
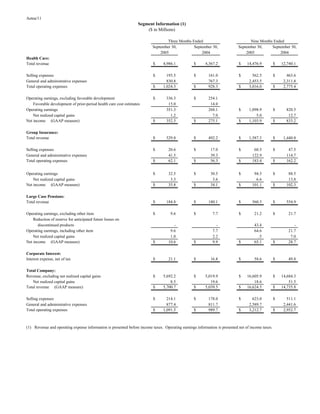
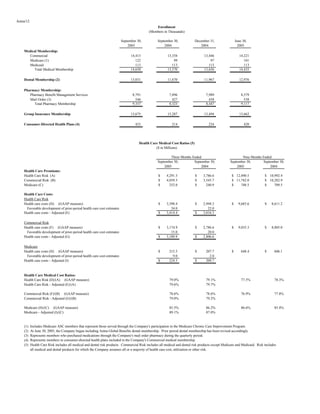
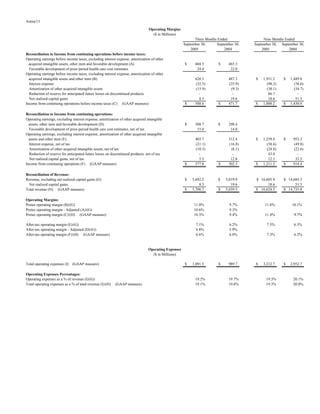
This document summarizes Aetna's financial performance for the third quarter and first nine months of 2005 compared to the same periods in 2004. It shows that total revenue, health care costs, and income from continuing operations increased from the prior year periods. However, net income decreased due to a large tax refund received in 2004 that was not repeated in 2005. On a per share basis, income from continuing operations increased while net income decreased year-over-year due to the one-time tax refund in the prior period. Shareholders' equity also increased over this time period.


