Download to read offline

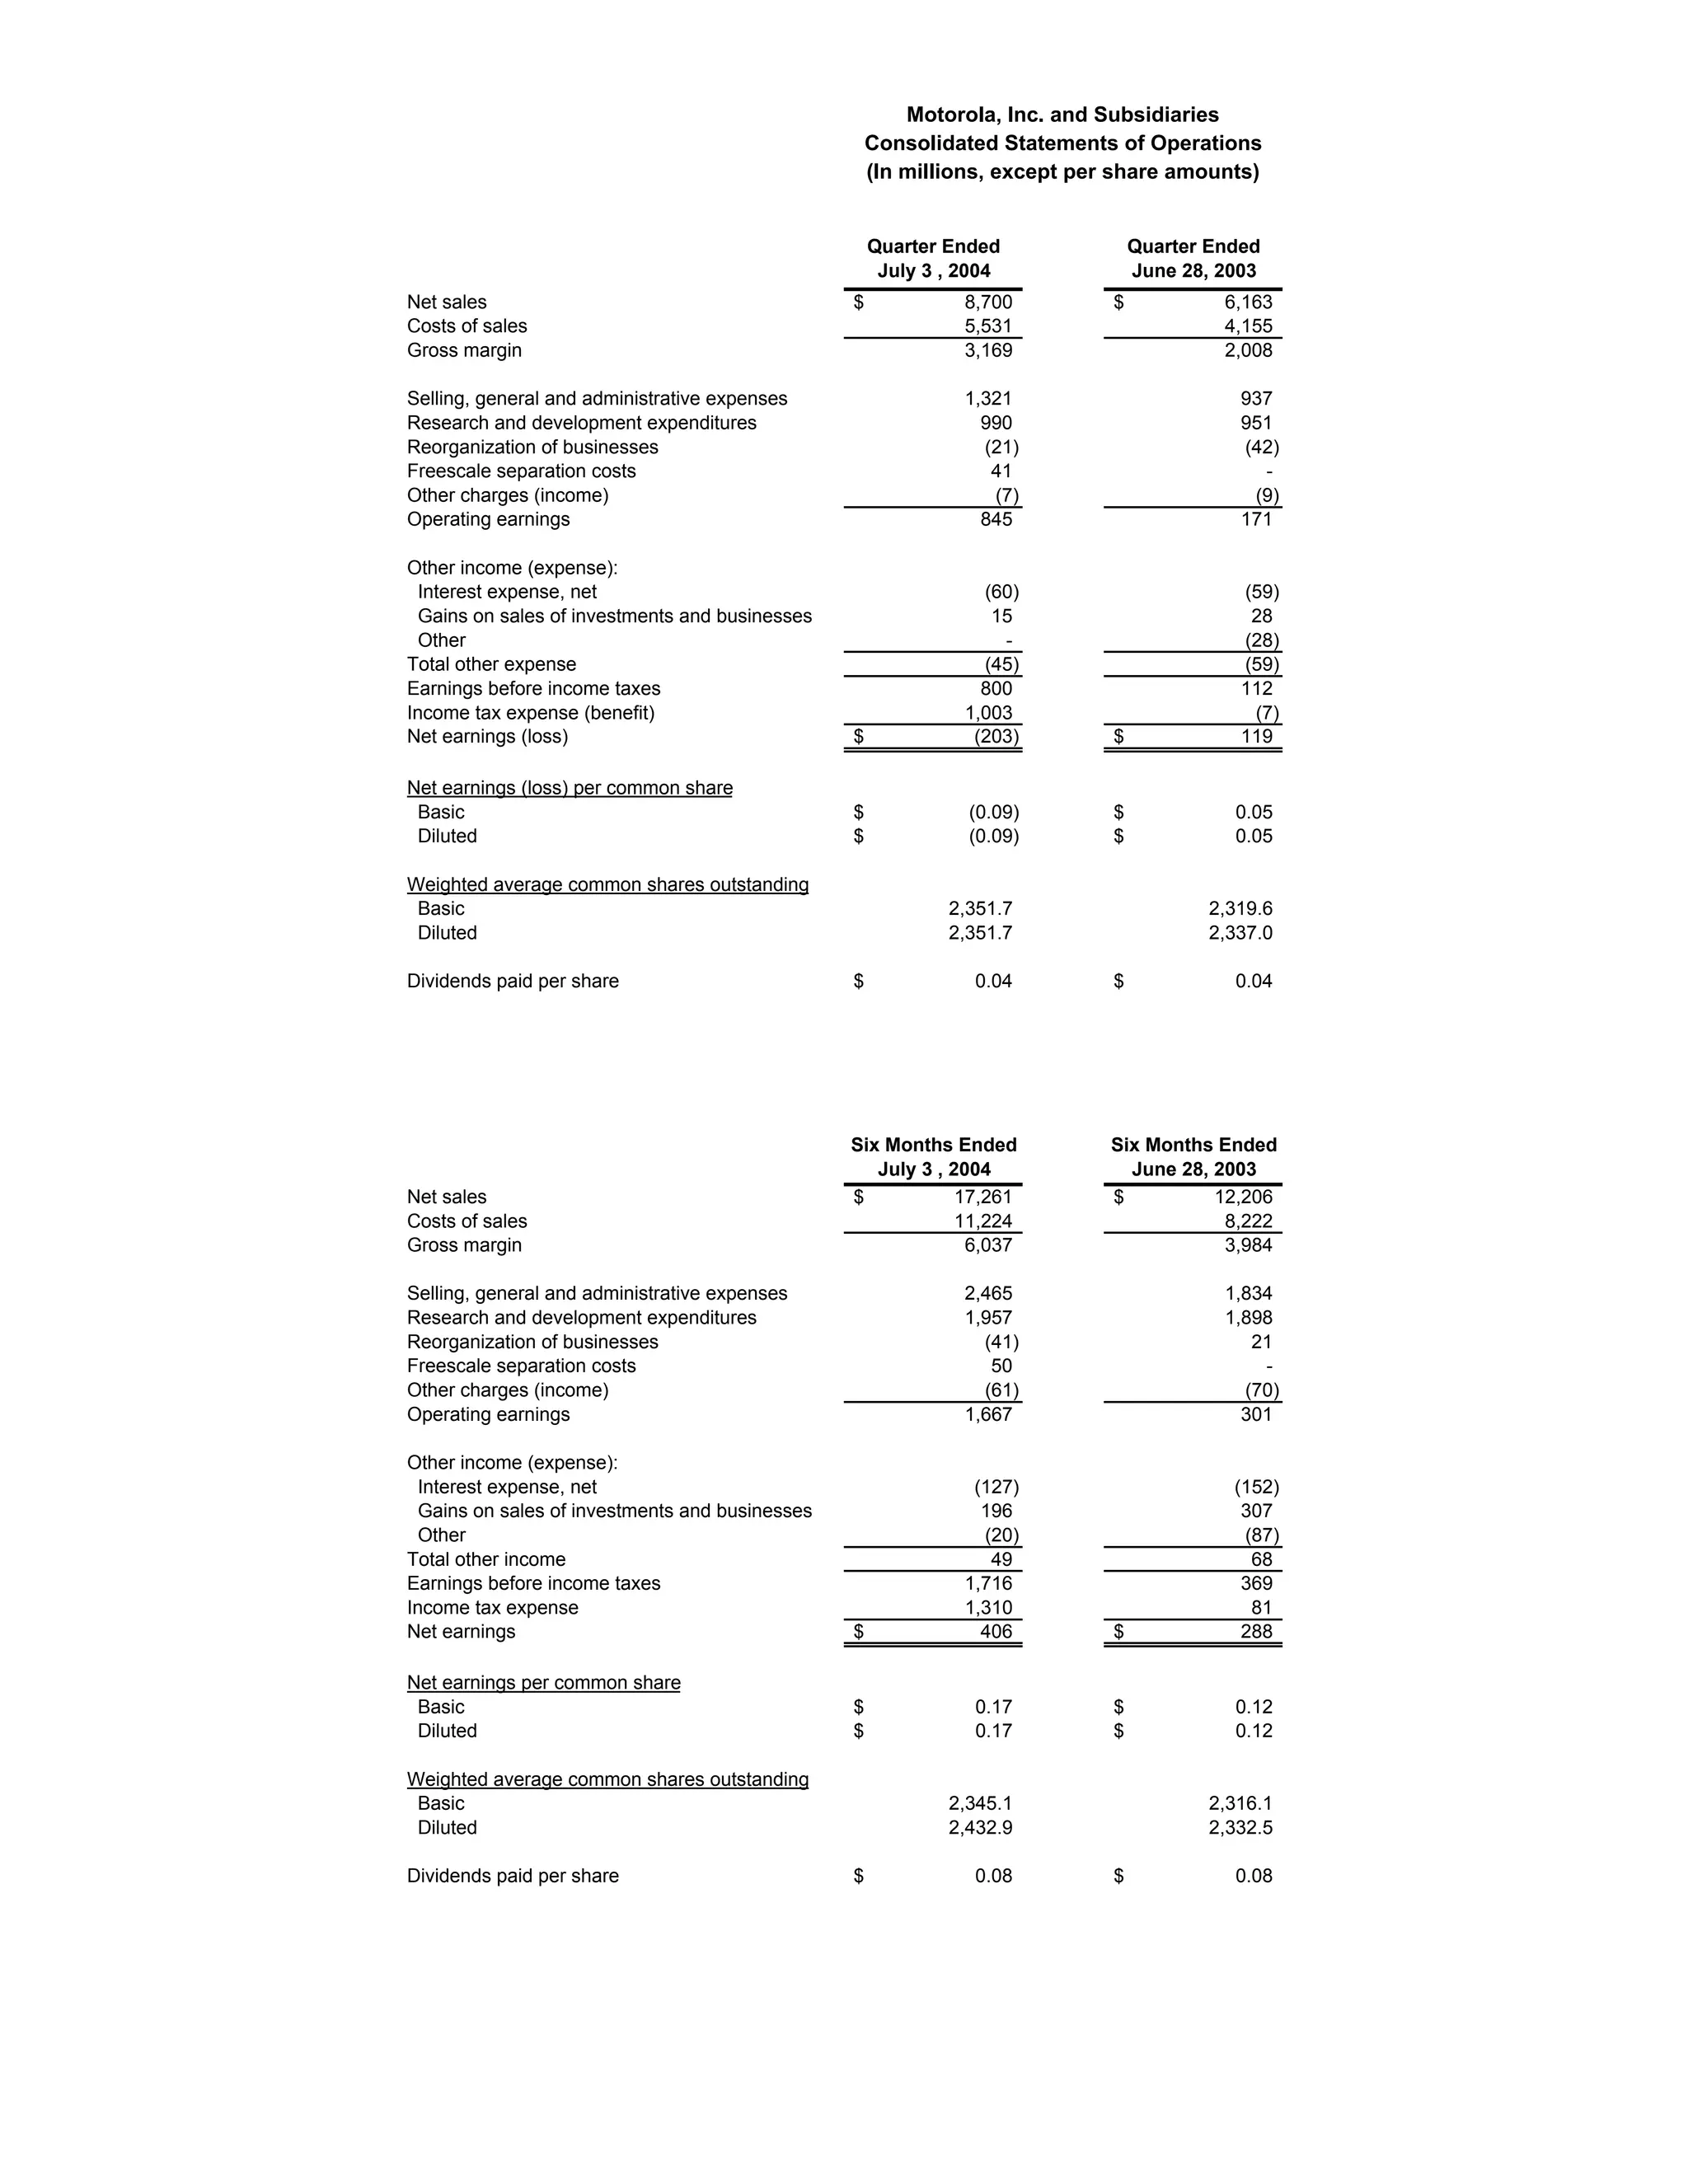
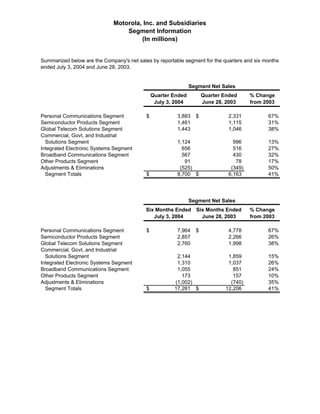
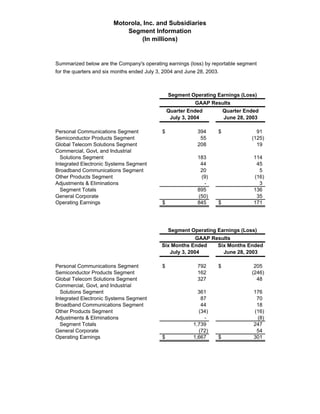
- Motorola reported a net loss of $203 million for the quarter ended July 3, 2004 compared to net earnings of $119 million for the same period in 2003. Revenues increased 41% to $8.7 billion for the quarter. - For the six months ended July 3, 2004, Motorola reported net earnings of $406 million on revenues of $17.3 billion, up 41% compared to the same period in 2003. - Motorola's Personal Communications segment led growth, with revenues up 67% for both the quarter and six months, while operating earnings increased across most business segments.


