Download to read offline


![NetFlow Reports Details
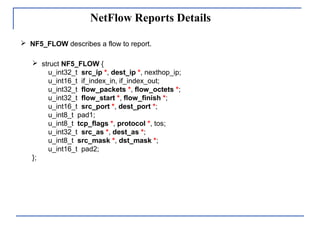
It is the Cisco Netflow(tm) version 5 packet format based on:
http://www.cisco.com/univercd/cc/td/doc/product/rtrmgmt/nfc/nfc_3_0/nfc_ug/nfcform.htm
NetFlow Reports packet format:
[NF5_HEADER, NF5_FLOW, NF5_FLOW, NF5_FLOW, …]
NF5_HEADER resumes a description of the set of flows to report.
struct NF5_HEADER {
u_int16_t version, flows *;
u_int32_t uptime_ms, time_sec, time_nanosec, flow_sequence;
u_int8_t engine_type, engine_id, reserved1, reserved2;
// Added to support the Traffic Emulation Service
u_int32_t emulator_monitor_adr *;
};](https://image.slidesharecdn.com/nsp-150410142137-conversion-gate01/85/Adaptive-Traffic-Sampling-and-Management-Platform-4-320.jpg)
![Pcap Library
Real Node
Interface
Per-Monitor
TcpDump
Headers
Input
1 2
Control
Messages
Input
Virtual Interface
Module
NetFlow Flow Constructer and Exporter
Module NetFlow
Reports
Output
Sampling
Algorithm
Sampling Module
Sampling Rate
Control Server
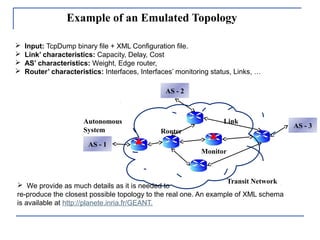
Zoom on the Traffic Monitoring and Sampling
Service
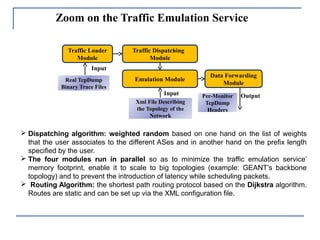
Sampling algorithm: If a user chooses a sampling rate of A/B (A packets among B packets,
A < B, B > 0, A >= 0), then every B packets, the sampling module generates randomly a set S
of A numbers within the interval [1, B]. Packets with numbers outside the set S are rejected
and only the remaining packets are considered for 5-tuple flow construction.
Sampling Rate Control server:
Enables to remotely control the
sampling rate.
Flow Constructor and Exporter:
constructs 5-tuple flows starting from the
sampled packets, merges them within
NetFlow reports and sends them to the
Collector.](https://image.slidesharecdn.com/nsp-150410142137-conversion-gate01/85/Adaptive-Traffic-Sampling-and-Management-Platform-8-320.jpg)


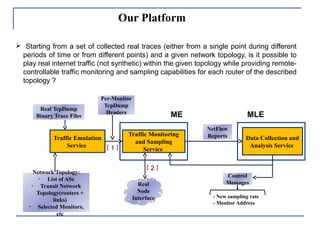
The document describes an adaptive traffic sampling and management platform that aims to: 1) Provide an emulation platform for network-wide traffic sampling and monitoring that allows users to control experiments by tuning parameters like traffic sources, network topology, and sampling rates. 2) Enable experiments to be easily reproduced. 3) Allow developed solutions to be tested in real environments. 4) Be extensible and scale to large scenarios by changing sampling algorithms or adding advanced monitoring methods.


