1) A new ocean observing station was established off Eglin Air Force Base in Fort Walton Beach, Florida to monitor waves, currents, and tides using an ADCP.
2) Hourly data on currents, waves, water depth were communicated to researchers and used to study storm impacts and nearshore morphology.
3) The station consisted of an upward-looking ADCP moored to a surface buoy and collected data from 2005-2008, until it was damaged by Hurricane Dennis.
![A WAVCIS Based Ocean Observing Station to
Provide Hydrodynamic Data off Eglin Air Force
Base, Fort Walton, Florida, USA
Gregory W. Stone
Coastal Studies Institute and
Department of
Oceanography and Coastal
Sciences, Louisiana State
University, Baton Rouge,
LA 70803, USA
Felix Jose
Coastal Studies
Institute,
Louisiana State
University,
Baton Rouge,
LA 70803, USA
Yixin Luo
Coastal Studies
Institute,
Louisiana State
University, Baton
Rouge, LA
70803, USA
Seyed M. SiadatMousavi
Coastal Studies Institute and
Department of
Oceanography and Coastal
Sciences, Louisiana State
University, Baton Rouge,
LA 70803, USA
Todd Holland
Naval Research
Laboratory, Code
7440.3, Building
1005, Stennis Space
Center, MS 39529,
USA
Abstract: A new coastal ocean observing station has been established for the west Florida shelf, off Eglin Air Force Base, with an
upward looking ADCP deployed at the approximate 11 m isobath for measuring the coastal currents, waves and tide. Hourly processed
data were communicated to the WAVCIS station, through secured cellular communication. Vertical profiles of current speed and
direction were continuously monitored until summer 2008. Also, directional wave spectra, bulk wave parameters and spectral evolution
were computed from the ADCP measurements. These data are critical in monitoring wave and current transformation over the
innershelf, associated with the passage of tropical cyclones and winter storms. NRL is using the data to enhance understanding of the
nearshore/beach morphodynamics. The entire automated operation was executed by software developed in-house, taking advantage of
interface-drivers for the data-loggers. The user-developed software controls the sampling scheme and the operational control of all of
the sensors and the onsite computer.
I. INTRODUCTION
The Wave-Current-Surge Information System (WAVCIS) is a near real-time ocean observing program implemented for the
northern Gulf of Mexico [1-3]. WAVCIS measures met-ocean processes and sea state information for offshore Louisiana,
Mississippi and the Florida Panhandle. The information measured includes waves, currents, water depth, surge, salinity,
water temperature and meteorological conditions. The data measured from offshore stations are transmitted on a near real
time basis, through cellular communication, to the WAVCIS Laboratory and are published online (www.wavcis.lsu.edu). As
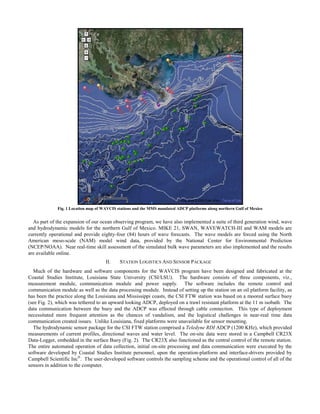
of August 2009, there are six operational stations (Fig. 1) and more stations have been planned for future deployments,
particularly off western Louisiana coast. Archived data are also available for some of the stations which are no longer active
(yellow dots in Fig. 1).
For this project, the CSI FTW station (see Fig. 2) was deployed offshore, off a 91.4 m tall meteorological tower at Eglin
Air Force Base, along the Florida Panhandle coast. The system was originally deployed during summer 2005 and was
severely damaged when Hurricane Dennis made landfall on 10th
July, 2005, which came ashore slightly west of Fort Walton
Beach [4]. The station was re-deployed shortly thereafter and remained operational until early summer 2008[5]; the station
location was 86º 45.797' W and 30º 23.057' N. The oceanographic data collected from the station along with meteorological
data from a nearby NOAA station, are discussed in this paper. The Florida observation station (CSI FTW) consisted of an
upward looking 1200 KHz Teledyne RDI Acoustic Doppler Current Profiler (ADCP) deployed at the ~11 m isobaths. The
ADCP was tethered to a surface buoy (see Fig. 2) in order to facilitate real time transmission of the data back to the ground
station. The on-site data were stored in a Campbell CR23X Data logger which was housed inside the surface buoy. Field
measurements from the CSI FTW station included wave height, wave period, wave direction, directional wave spectra,
current speed & direction profiles and water depth. Meteorological data were collected from a nearby station PCLF1,
operated and maintained by NOAA’s National Ocean Service.
The broad objective of this coastal program is to establish monitoring stations along the northern Gulf of Mexico, capable
of providing near-real time met-ocean data, in support of an effort to understand the coupled dynamics of waves, currents,
and sediments in heterogeneous environments. The station location of CSI FTW, in a tectonically stable and sandy West
Florida coast [6-7], as opposed to the muddy/fine sand shelf environment off Louisiana, provides ample opportunity to
compare and contrast wave and current transformation across different shelf environments along the northern Gulf of Mexico.
Also, these diverse coastal settings provide a natural laboratory for calibrating and validating wave and hydrodynamic models,
as many of the 3rd
generation hydrodynamic models are rarely being tested in contrasting bottom friction conditions.
0-933957-38-1 ©2009 MTS](https://image.slidesharecdn.com/e86a490a-64d5-405d-a955-a92a5405b860-160513202849/85/ADA527503-1-320.jpg)
![A WAVCIS Based Ocean Observing Station to
Provide Hydrodynamic Data off Eglin Air Force
Base, Fort Walton, Florida, USA
Gregory W. Stone
Coastal Studies Institute and
Department of
Oceanography and Coastal
Sciences, Louisiana State
University, Baton Rouge,
LA 70803, USA
Felix Jose
Coastal Studies
Institute,
Louisiana State
University,
Baton Rouge,
LA 70803, USA
Yixin Luo
Coastal Studies
Institute,
Louisiana State
University, Baton
Rouge, LA
70803, USA
Seyed M. SiadatMousavi
Coastal Studies Institute and
Department of
Oceanography and Coastal
Sciences, Louisiana State
University, Baton Rouge,
LA 70803, USA
Todd Holland
Naval Research
Laboratory, Code
7440.3, Building
1005, Stennis Space
Center, MS 39529,
USA
Abstract: A new coastal ocean observing station has been established for the west Florida shelf, off Eglin Air Force Base, with an
upward looking ADCP deployed at the approximate 11 m isobath for measuring the coastal currents, waves and tide. Hourly processed
data were communicated to the WAVCIS station, through secured cellular communication. Vertical profiles of current speed and
direction were continuously monitored until summer 2008. Also, directional wave spectra, bulk wave parameters and spectral evolution
were computed from the ADCP measurements. These data are critical in monitoring wave and current transformation over the
innershelf, associated with the passage of tropical cyclones and winter storms. NRL is using the data to enhance understanding of the
nearshore/beach morphodynamics. The entire automated operation was executed by software developed in-house, taking advantage of
interface-drivers for the data-loggers. The user-developed software controls the sampling scheme and the operational control of all of
the sensors and the onsite computer.
I. INTRODUCTION
The Wave-Current-Surge Information System (WAVCIS) is a near real-time ocean observing program implemented for the
northern Gulf of Mexico [1-3]. WAVCIS measures met-ocean processes and sea state information for offshore Louisiana,
Mississippi and the Florida Panhandle. The information measured includes waves, currents, water depth, surge, salinity,
water temperature and meteorological conditions. The data measured from offshore stations are transmitted on a near real
time basis, through cellular communication, to the WAVCIS Laboratory and are published online (www.wavcis.lsu.edu). As
of August 2009, there are six operational stations (Fig. 1) and more stations have been planned for future deployments,
particularly off western Louisiana coast. Archived data are also available for some of the stations which are no longer active
(yellow dots in Fig. 1).
For this project, the CSI FTW station (see Fig. 2) was deployed offshore, off a 91.4 m tall meteorological tower at Eglin
Air Force Base, along the Florida Panhandle coast. The system was originally deployed during summer 2005 and was
severely damaged when Hurricane Dennis made landfall on 10th
July, 2005, which came ashore slightly west of Fort Walton
Beach [4]. The station was re-deployed shortly thereafter and remained operational until early summer 2008[5]; the station
location was 86º 45.797' W and 30º 23.057' N. The oceanographic data collected from the station along with meteorological
data from a nearby NOAA station, are discussed in this paper. The Florida observation station (CSI FTW) consisted of an
upward looking 1200 KHz Teledyne RDI Acoustic Doppler Current Profiler (ADCP) deployed at the ~11 m isobaths. The
ADCP was tethered to a surface buoy (see Fig. 2) in order to facilitate real time transmission of the data back to the ground
station. The on-site data were stored in a Campbell CR23X Data logger which was housed inside the surface buoy. Field
measurements from the CSI FTW station included wave height, wave period, wave direction, directional wave spectra,
current speed & direction profiles and water depth. Meteorological data were collected from a nearby station PCLF1,
operated and maintained by NOAA’s National Ocean Service.
The broad objective of this coastal program is to establish monitoring stations along the northern Gulf of Mexico, capable
of providing near-real time met-ocean data, in support of an effort to understand the coupled dynamics of waves, currents,
and sediments in heterogeneous environments. The station location of CSI FTW, in a tectonically stable and sandy West
Florida coast [6-7], as opposed to the muddy/fine sand shelf environment off Louisiana, provides ample opportunity to
compare and contrast wave and current transformation across different shelf environments along the northern Gulf of Mexico.
Also, these diverse coastal settings provide a natural laboratory for calibrating and validating wave and hydrodynamic models,
as many of the 3rd
generation hydrodynamic models are rarely being tested in contrasting bottom friction conditions.
0-933957-38-1 ©2009 MTS](https://image.slidesharecdn.com/e86a490a-64d5-405d-a955-a92a5405b860-160513202849/75/ADA527503-1-2048.jpg)
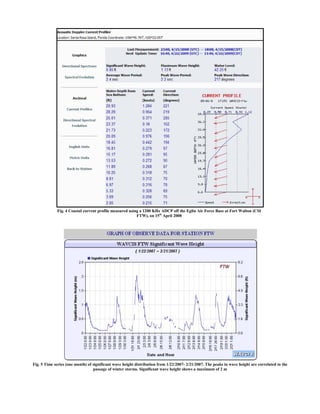
![Fig. 2 Surface Buoy at the Fort Walton WAVCIS station (CSI FTW)
The ADCP was operated in burst mode and the data measured offshore were stored in the Campbell data logger on-site and
transferred to the WAVCIS data processing laboratory via cellular telecommunication. A router was set-up on the
meteorological tower, located on Santa Rosa Island, to facilitate secured and rapid communication with Data Servers located
in the WAVCIS Laboratory. Downloaded data were processed by a post-processing program. This program reads the semi-
processed data, which had been initially processed on-board for the wave and current components. The post-processing
program also read each time, related settings of the ADCP prior to processing them. After QA/QC, the processed real-time
data were archived in an SQL database which was viewed and queried by users using the web interface. For the WAVCIS
stations, in general, hourly communications of met-ocean data were accomplished through a dedicated telephone line at the
receiving station. The automated communication is controlled by Symantec’s®
PC Anywhere®
software with the capability
of regular data downloading and remote control of the station computer and sensors from the base station. The data sampling
and communication schemes can be modified remotely from the land station. The remote access capability also allowed
quality checks of the various sensor packages as well as the station power supply.
III. DATA PROCESSING
A. Meteorological Data
Wind and other meteorological data from the region were analyzed using in-situ data from the weather station PCLF1,
located at Pensacola Bay, owned and maintained by NOAA’s National Ocean Service. This station was located well inside
the Bay and was far away from the CSI FTW station. Unfortunately, another coastal station, located at Panama City, farther
east, was not operational during the study period. Annual met-ocean conditions in Pensacola Bay, based on data from PCLF1,
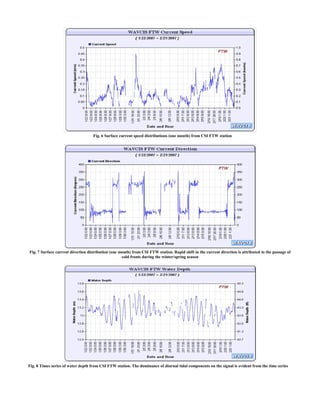
are provided in Fig. 3. The data correspond to 2007 and no major hurricanes or tropical storms impacted the coast during this
period. Wind-climate for the study area was characterized by a low-energy regime, except during the cold front season, when
wind speed increased and the direction changed from south-easterly/southerly to north-westerly/northerly, as the storm
crossed the coast. This has been well documented in [8-10]. The in-situ data from the station for 2007 (2007/01/01-
2007/12/31) indicated that approximately 60% of the duration of this study, wind speed was less than or equal to 3 m s-1
and
for 30% of the time, between 3 and 6 m s-1
. Because no major hurricanes or tropical storms came ashore during 2007, the
maximum wind speed recorded was approximately 15 m/s. Winds predominantly blew from the north to southwest, although
the direction was highly variable (Fig. 3). Atmospheric pressure annual statistics shows a normal distribution with almost 40%
of the time surface pressure was in the range 1015-1020 hPa. Sea Surface temperature also shows warm trends with 25-30o
C
prevailing for almost 30% of the year.](https://image.slidesharecdn.com/e86a490a-64d5-405d-a955-a92a5405b860-160513202849/85/ADA527503-3-320.jpg)
![Fig. 3 Annual met-ocean statistics for 2007, compiled from weather station PCLF1. The coastal
station was located at Pensacola Bay, western Florida
B. Ocean Data
Sampling Scheme and Data Processing
The RD Instrument’s ADCP was remotely controlled and initiated by the on-site computer via the PC208 Software. The
“WAVESMON” program controls the ADCP and provides for the storage of the raw data as well as initial processing.
Current speed and direction were provided as profiles, extending from near bottom to near water surface in successive bins of
35cm bin-width. Significant wave height, peak wave height, average period, peak period, peak wave direction and the
directional wave spectra were the parameters computed on-site (Spectral analysis procedure) and were transferred to the
WAVCIS Lab via the PC Anywhere software.
The data were processed automatically following successive data downloading every hour. The data were archived in a
relational database, and posted to the web simultaneously. The interactive web page is designed not only for users to acquire
the latest updated information, but also to provide an interface for users to access our online database. All information in the
database can be retrieved, queried, and graphically viewed on the web page. The Raw ADCP data were retrieved periodically
from the site and archived for further research and model validation studies. Also, raw data were periodically transferred to
the project sponsor at the Naval Research Laboratory (NRL), who has been using the data to enhance the understanding of
the nearshore/beach morphodynamics. Due to the classified nature of the data, access to the hydrodynamic observations from
the CSI FTW station has been restricted. The following figures (Fig. 4-8) provide a representative illustration of the met-
ocean data collected and processed from the CSI FTW station.
Directional Spectrum
The directional spectrum provides the distribution of wave energy in the frequency-direction domain. Given the complex
interaction of swells propagating from offshore and locally generated seas along the coastal waters, this analysis offers a
better understanding of sea state at any given time. Especially, during the approaching phase of Tropical Cyclones and other
extra tropical storms, the bimodal distribution of wave energy could be studied from this analysis. From the given plot of the
directional spectra (Fig. 9 left) it is shown that southerly waves, approaching from a broad window, 110o
– 250o
, with a wider
band width (mix of sea and swell waves), dominated the study area. This corresponds to a pre-frontal wave climate for the
coast. The wave spectrum after 10 hours, on 1st
January 2007, is provided in Fig. 9 right. The bimodal distribution of wave
energy, long period swells propagate from the south along with higher frequency westerly waves, indicates the passage of an
extra-tropical storm in the study area. This is a typical spectral evolution pattern associated with a frontal passage along the
northern Gulf of Mexico on the upper shoreface (fetch-limited condition), during winter and early spring season and has been
discussed in [9, 11].](https://image.slidesharecdn.com/e86a490a-64d5-405d-a955-a92a5405b860-160513202849/85/ADA527503-4-320.jpg)
![Fig. 9 Directional wave spectra during an extra-tropical winter storm crossing the coast; pre-frontal phase of the storm (left) and when the front
approaches the station (right). The evolution in the directional spectra occurred within a time period of 10 hours on 1st
January 2007. The spectral
density values are magnified for visualization purposes.
IV. DATA QUALITY CONTROL
To ensure a high level of accuracy of WAVCIS data, standardized quality control procedures have been implemented and
which consisted of four parts: 1. automatic screening, 2. Visual screening, 3. Field calibration, and 4. Documentation.
Automatic screening is designed in the post processing program which checks the range of each parameter to eliminate
outliers or other failures. Manual visual screening is performed after every download during working days and at least twice
a day during weekends and holiday seasons. Trained personnel inspect the time series graphics for each parameter, compare
different parameters with neighboring stations, e.g. wave height, direction vs. wind speed and direction. This procedure can
detect problems that the automatic procedure may not find. Field calibration was performed whenever the field crew was
deployed to the stations to ensure proper functioning of all sensors of the station. Documentation was kept on all raw data
format change, detected errors in previous procedures and might be used for future re-calculation of the raw data.
V. WAVE FORECASTING AND MODEL SKILL ASSESSMENT
As discussed in an earlier section, the vast array of observational data being collected from the WAVCIS stations have
been further used for skill assessment and for fine tuning of hydrodynamic models, viz., MIKE 21, WAVEWATCH-III,
WAM, and SWAN. As an example, MIKE 21 SW model implementation is discussed in the following section.
A MIKE 21 SW (Wave forecasting)
The MIKE 21 Spectral Wave (SW) model has been developed by DHI Water and Environment®
and has been implemented
successfully for modeling coastal wave characteristics in the North Sea [12]. The model has been implemented for the Gulf
of Mexico[13-14]. Ref. [15] implemented the model for the Florida Panhandle coast to study the bottom shear stress and
wave induced sediment re-suspension during Hurricanes Ivan and Dennis. References [16] and unpublished [17] used the
model for analyzing the hydrodynamics of Ship Shoal and Sabine Bank, along the Northern Gulf coast. The model is based
on unstructured meshes and it simulates the growth, decay and transformation of wind generated waves and swells in
offshore and coastal areas. The discretization in geographical and spectral space is performed using a cell-centered finite
volume method. In the geographical domain, an unstructured mesh is used. The integration in time is based on a fractional
step approach [12].
The model has been implemented for the Gulf of Mexico to forecast bulk wave parameters. Fine resolution synoptic
forecast maps of significant wave height and wave direction for the Gulf of Mexico and for all the coastal zones bordering the
Gulf of Mexico, including the Gulf coast of United States (see Fig. 10) Cuba and Mexico are accessible from the website.
Eighty-four (84) hour forecasts are updated daily on the WAVCIS site at 05:00 (Local Time). The model is skill assessed
with observed data from CSI FTW and the remainder of the coastal stations located along the Louisiana coast. Simulated
bulk wave parameters (significant wave height, peak wave period and mean wave direction) were plotted against hourly in](https://image.slidesharecdn.com/e86a490a-64d5-405d-a955-a92a5405b860-160513202849/85/ADA527503-7-320.jpg)
![situ observations from WAVCIS stations and the statistical parameters were computed. Results from the skill assessment of
the MIKE 21 SW model, using in situ data from various WAVCIS stations, are also posted on the web.
VI. CONCLUSIONS
A new WAVCIS station has been set-up for the west Florida shelf, off Eglin Air Force Base, with an upward looking
ADCP deployed at ~11 m isobath for measuring the coastal currents, waves and tide. The system was originally deployed
during summer 2005 and was severely damaged due to Hurricane Dennis and was re-deployed shortly thereafter and
remained operational until early summer 2008. Meteorological data were collected from a nearby station PCLF1, operated
and maintained by NOAA’s National Ocean Service. In situ observations from CSI FTW station include current speed &
direction profiles, bulk wave parameters, directional wave spectra and water depth. Hourly processed data were
communicated to the WAVCIS station, based at Louisiana State University, through secured cellular communication. The
data are critical in monitoring wave and current transformation over the innershelf, associated with the passage of tropical
cyclones and winter storms. The user-developed software controls the sampling scheme and the operational control of all of
the sensors and even the communication protocol with the land station.
ACKNOWLEDGMENTS
This coastal observation program was funded through the Naval Research Laboratory, Stennis Space Center; Award #
N00173-04-01-G906. Mr. William J. Gibson and the staff from Coastal Studies Institute’s Field Support Group conducted
all the field operations. Mr. Steve Dartez and Mr. Ronald Stanford are acknowledged for their technical support during the
early phase of the project. Mr. Yuliang Chen, WAVCIS Lab, is acknowledged for the GIS and Web applications support.
REFERENCES
[1] X. Zhang, "Design and Implementation of an Ocean Observing System: WAVCIS (Wave-Current-Surge Information System) and its Application
to the Louisiana Coast," Ph.D Ph.D Dissertation, Louisiana State University, Baton Rouge, 2003, p 182
[2] G. W. Stone, X. Zhang, J. Li, and A. Sheremet, "Coastal Observing Systems: Key to the future of coastal dynamics investigation,"
GCAGS/GCSSEPM Transactions, vol. 53, pp. 783-799, 2003.
[3] G. W. Stone, X. P. Zhang, W. Gibson, and R. Frederichs, "A new wave-current online information system for oil spill contigency planning
(WAVCIS)," in 24th Arctic and Marine Oil spill Program Technical Seminar, Edmonton, Alberta, CANADA, 2001, pp. 401-425.
[4] J. Beven, "Tropical Cyclone Report- Hurricane Dennis," National Hurricane Center, Miami, Florida2005. p 25.
[5] G. W. Stone, Jose, F., Luo, Y., SiadatMousavi, S.M. and Gibson, W.J., "A WAVCIS-Based Ocean Observing Station off Eglin Air Force Base,
Fort Walton, Florida," Louisiana State University, Baton RougeJuly 2009 2009. p 45.
[6] L. E. Cipriani and G. W. Stone, "Net longshore sediment transport and textural changes in beach sediments along the southwest Alabama and
Mississippi barrier islands, USA," Journal of Coastal Research, vol. 17, pp. 443-458, SPR 2001.
[7] G. W. Stone, F. W. Stapor, J. P. May, and J. P. Morgan, "Multiple Sediment Sources and A Cellular, Non-Integrated, Longshore-Drift System -
Northwest Florida and Southeast Alabama Coast, Usa," Marine Geology, vol. 105, pp. 141-154, 1992.
[8] I. Y. Georgiou, D. M. FitzGerald, and G. W. Stone, "The impact of physical processes along the Louisiana coast," Journal of Coastal Research,
vol. 44, pp. 72-89, 2005.
[9] H. H. Roberts, O. K. Huh, S. A. Hsu, L. J. Rouse, and D. A. Rickman, "Winter storm impacts on the Chenier Plain coast of southwestern
Louisiana," Gulf Coast Association of Geological Societies Transactions, vol. 34, pp. 515-522, 1989.
[10] G. W. Stone, B. Z. Liu, D. A. Pepper, and P. Wang, "The importance of extratropical and tropical cyclones on the short-term evolution of barrier
islands along the northern Gulf of Mexico, USA," Marine Geology, vol. 210, pp. 63-78, 2004.
Fig. 10 Forecast of significant wave height and mean wave direction for the northern Gulf of Mexico, using the MIKE 21 Spectral wave
model. The red dots on the plot correspond to WAVCIS stations for which near-real time model skill assessment is implemented.](https://image.slidesharecdn.com/e86a490a-64d5-405d-a955-a92a5405b860-160513202849/85/ADA527503-8-320.jpg)
![[11] G. W. Stone, R. Condrey, and J. Fleeger, "Environmental investigation of the long-term use of Ship Shoal sand resources for large-scale beach
and coastal restoration in Louisiana," 2009. p
[12] O. R. Sorensen, H. Kofoed-Hansen, M. Rugbjerg, and L. S. Sorensen, "A third-generation spectral wave model using an unstructured finite
volume technique," in International Conference on Coastal Engineering 29, 2004, pp. 894-906.
[13] F. Jose, D. Kobashi, and G. W. Stone, "Spectral wave transformation over an elongated sand shoal off south central Louisiana, USA," Journal of
Coastal Research, vol. SI 50, pp. 757-761, 2007.
[14] F. Jose and G. W. Stone, "Forecast of nearshore wave parameters using MIKE 21 spectral wave model," Transactions, Gulf Coast Association of
Geological Societies, vol. 56, pp. 323-327, 2006.
[15] A. L. Spaziani, Jose, F. and Stone, G.W., "Sediment dynamics on an innershelf shoal during storm events in the northeastern Gulf of Mexico,"
Journal of Coastal Research, vol. , pp. 668-672, 2009.
[16] D. Kobashi, G. W. Stone, S. M. Khalil, and D. R. Kerper, "Impacts of sand removal from a shore-parallel Holocene transgressive shoal on
hydrodynamics and sediment transport, south-central Louisiana, USA," vol. In Preparation, 2009.
[17] F. Jose, Stone, G.W., Kobashi, D., SiadatMousavi, S.M. and Liu, B, "Hydrodynamic Response of a Transgressive Shoal to the Proposed Mining
for Restoring Adjacent Beaches and Barriers: Sabine Bank off Louisiana-Texas Coast, United States," in Coastal Dynamics '09, Tokyo, Japan,
2009.](https://image.slidesharecdn.com/e86a490a-64d5-405d-a955-a92a5405b860-160513202849/85/ADA527503-9-320.jpg)


