Downloaded 106 times


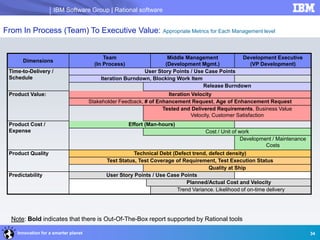


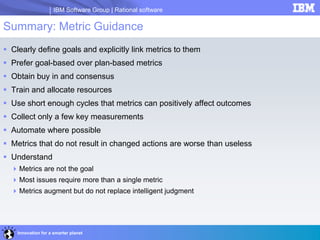


The document discusses the importance of metrics in project and software development, highlighting the correlation between measurement and successful outcomes. It outlines various types of metrics such as design, quality, and project metrics, emphasizing the preference for goal-based metrics over plan-based metrics. It also covers best practices for implementing metrics, including training personnel and ensuring proper analysis and usage of collected data.