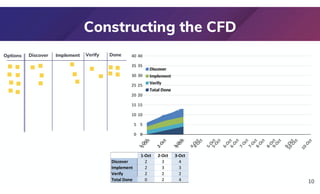
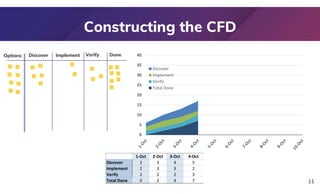
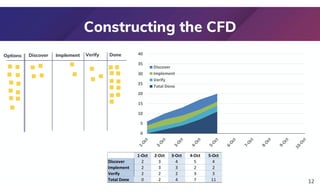
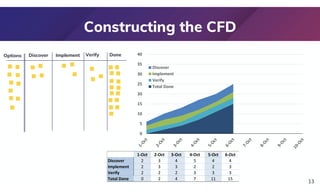
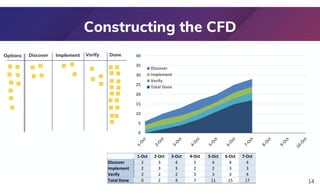
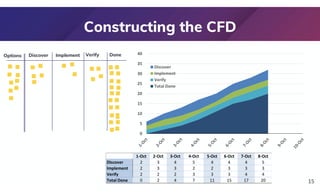
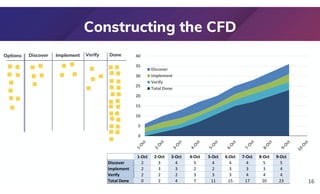
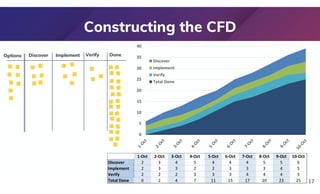
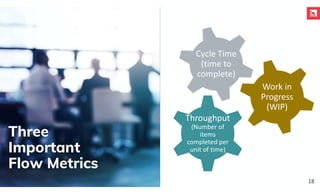
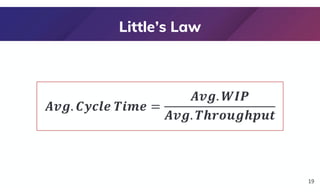
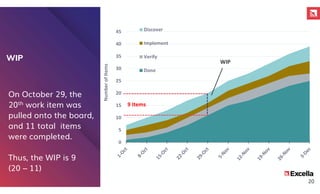
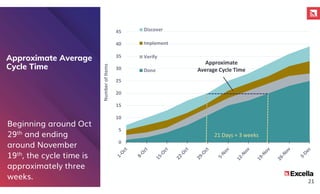
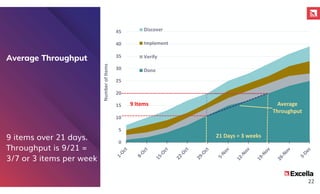
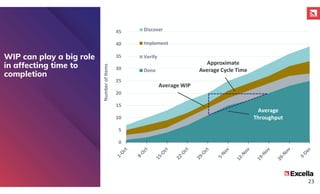
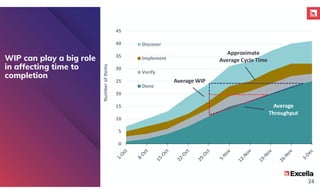
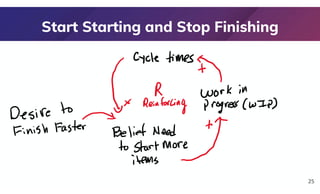
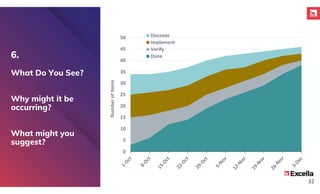
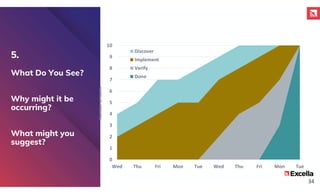
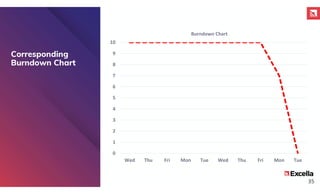
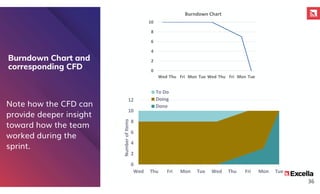
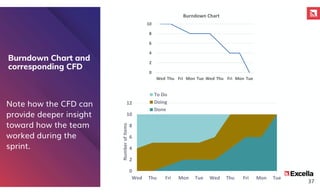
Interpreting Cumulative Flow
Diagram (CFD) Patterns.
What YOU Need to Know!
Mark Grove
mkgrov
Managing Consultant / Ten years as Agile Coach
Professional Interests: system optimization, value delivery, flow of work
Personal Interests: Amateur astronomer/ Photographer
Mark Grove
mkgrov
Today’s
Agenda
3
 My Motivation
 Why care about the CFD?
 Constructing the CFD
 Three important flow metrics
 Identifying CFD patterns
 CFDs and burndown charts
(complementing, replacing?)
Today’s discussion is tool agnostic.
My Motivation
4
• Beginner agilists/metrics
• Moved to Kanban recently
• Not enough attention to flow
• For Scrum teams: Burndowns only
• Complements my other flow
workshops (with Trent Hone)
Why Care
About the CFD?
5
 Provides graphical view of work
item flow across team board
 Identify recurring patterns
 Highlight bottlenecks and their impacts
 Provide insight into predictability
 Keeps front and center the
interrelationship of three very
important flow metrics
 Provides deeper insight than a
velocity-based burnup or
burndown chart
Constructing
the CFD
7
Discover Implement Verify Done
Options
0
5
10
15
20
25
30
35
40
Discover
Implement
Verify
Total Done
Constructing the CFD
1-Oct
Discover 2
Implement 2
Verify 2
Total Done 0
8
0
5
10
15
20
25
30
35
40
Discover
Implement
Verify
Total Done
Discover Implement Verify Done
Options
0
5
10
15
20
25
30
35
40
Discover
Implement
Verify
Total Done
Constructing the CFD
9
1-Oct 2-Oct
Discover 2 3
Implement 2 3
Verify 2 2
Total Done 0 2
Discover Implement Verify Done
Options
0
5
10
15
20
25
30
35
40
Discover
Implement
Verify
Total Done
Constructing the CFD
10
1-Oct 2-Oct 3-Oct
Discover 2 3 4
Implement 2 3 3
Verify 2 2 2
Total Done 0 2 4
0
5
10
15
20
25
30
35
40
Discover
Implement
Verify
Total Done
Discover Implement Verify Done
Options
0
5
10
15
20
25
30
35
40
Discover
Implement
Verify
Total Done
Constructing the CFD
11
1-Oct 2-Oct 3-Oct 4-Oct
Discover 2 3 4 5
Implement 2 3 3 2
Verify 2 2 2 3
Total Done 0 2 4 7
Discover Implement Verify Done
Options
Constructing the CFD
12
0
5
10
15
20
25
30
35
40
Discover
Implement
Verify
Total Done
1-Oct 2-Oct 3-Oct 4-Oct 5-Oct
Discover 2 3 4 5 4
Implement 2 3 3 2 2
Verify 2 2 2 3 3
Total Done 0 2 4 7 11
Discover Implement Verify Done
Options
Constructing the CFD
13
0
5
10
15
20
25
30
35
40
Discover
Implement
Verify
Total Done
1-Oct 2-Oct 3-Oct 4-Oct 5-Oct 6-Oct
Discover 2 3 4 5 4 4
Implement 2 3 3 2 2 3
Verify 2 2 2 3 3 3
Total Done 0 2 4 7 11 15
Discover Implement Verify Done
Options
Constructing the CFD
14
1-Oct 2-Oct 3-Oct 4-Oct 5-Oct 6-Oct 7-Oct
Discover 2 3 4 5 4 4 4
Implement 2 3 3 2 2 3 3
Verify 2 2 2 3 3 3 4
Total Done 0 2 4 7 11 15 17
0
5
10
15
20
25
30
35
40
Discover
Implement
Verify
Total Done
Discover Implement Verify Done
Options
Constructing the CFD
15
0
5
10
15
20
25
30
35
40
Discover
Implement
Verify
Total Done
1-Oct 2-Oct 3-Oct 4-Oct 5-Oct 6-Oct 7-Oct 8-Oct
Discover 2 3 4 5 4 4 4 5
Implement 2 3 3 2 2 3 3 3
Verify 2 2 2 3 3 3 4 4
Total Done 0 2 4 7 11 15 17 20
Discover Implement Verify Done
Options
Constructing the CFD
16
0
5
10
15
20
25
30
35
40
Discover
Implement
Verify
Total Done
1-Oct 2-Oct 3-Oct 4-Oct 5-Oct 6-Oct 7-Oct 8-Oct 9-Oct
Discover 2 3 4 5 4 4 4 5 5
Implement 2 3 3 2 2 3 3 3 4
Verify 2 2 2 3 3 3 4 4 4
Total Done 0 2 4 7 11 15 17 20 23
Discover Implement Verify Done
Options
Constructing the CFD
17
0
5
10
15
20
25
30
35
40
Discover
Implement
Verify
Total Done
1-Oct 2-Oct 3-Oct 4-Oct 5-Oct 6-Oct 7-Oct 8-Oct 9-Oct 10-Oct
Discover 2 3 4 5 4 4 4 5 5 6
Implement 2 3 3 2 2 3 3 3 4 5
Verify 2 2 2 3 3 3 4 4 4 3
Total Done 0 2 4 7 11 15 17 20 23 25
Discover Implement Verify Done
Options
Three
Important
Flow Metrics
Throughput
(Number of
items
completed per
unit of time)
Cycle Time
(time to
complete)
Work in
Progress
(WIP)
18
Little’s Law
19
WIP
On October 29, the
20th work item was
pulled onto the board,
and 11 total items
were completed.
Thus, the WIP is 9
(20 – 11)
0
5
10
15
20
25
30
35
40
45
Number
of
Items
Discover
Implement
Verify
Done
9 Items
20
WIP
0
5
10
15
20
25
30
35
40
45
Number
of
Items
Discover
Implement
Verify
Done
Approximate Average
Cycle Time
Beginning around Oct
29th and ending
around November
19th, the cycle time is
approximately three
weeks.
21 Days = 3 weeks
Approximate
Average Cycle Time
21
Average Throughput
9 items over 21 days.
Throughput is 9/21 =
3/7 or 3 items per week
0
5
10
15
20
25
30
35
40
45
Number
of
Items
Discover
Implement
Verify
Done
Average
Throughput
9 Items
21 Days = 3 weeks
22
0
5
10
15
20
25
30
35
40
45
Number
of
Items
Discover
Implement
Verify
Done
Average WIP
Approximate
Average Cycle Time
Average
Throughput
WIP can play a big role
in affecting time to
completion
23
0
5
10
15
20
25
30
35
40
45
Number
of
Items
Discover
Implement
Verify
Done
WIP can play a big role
in affecting time to
completion
Approximate
Average Cycle Time
Average WIP
Average
Throughput
24
Start Starting and Stop Finishing
25
Start Starting and Stop Finishing
Stop Starting and Start Finishing!
26
 What do you see?
Observe each CFD. What are you noticing?
What patterns may be present? Are there
any trends? What does the team see?
What could be causing this pattern? Have
you seen this before? What has prior
experience taught you? What questions
would you have for the team? What does
the team think?
What ideas do you have that may address
the pattern? Are there experiments worth
trying? What has the team already tried?
Did it work?
 Why might it be occurring?
 What might you suggest?
Identifying
CFD
Patterns
27
1.
What Do You See?
Why might it be
occurring?
What might you
suggest? 0
5
10
15
20
25
30
35
Number
of
Items
Discover
Implement
Verify
Done
28
0
5
10
15
20
25
30
35
Number
of
Items
Discover
Implement
Verify
Done
2.
What Do You See?
Why might it be
occurring?
What might you
suggest?
29
3.
What Do You See?
Why might it be
occurring?
What might you
suggest?
0
5
10
15
20
25
30
35
40
Number
of
Items
Discover
Implement
Verify
Done
30
0
2
4
6
8
10
12
Wed Thu Fri Mon Tue Wed Thu Fri Mon Tue
Number
of
Items
Discover
Implement
Verify
Done
4.
What Do You See?
Why might it be
occurring?
What might you
suggest?
31
6.
What Do You See?
Why might it be
occurring?
What might you
suggest?
0
5
10
15
20
25
30
35
40
45
50
Number
of
Items
Discover
Implement
Verify
Done
32
 Let’s take a look how a CFD could
complement and perhaps simply
replace a burndown chart.
CFDs and
Burndown
Charts 33
 Let’s assume a Scrum team
5.
What Do You See?
Why might it be
occurring?
What might you
suggest?
0
1
2
3
4
5
6
7
8
9
10
Wed Thu Fri Mon Tue Wed Thu Fri Mon Tue
Number
of
Items
Discover
Implement
Verify
Done
34
0
1
2
3
4
5
6
7
8
9
10
Wed Thu Fri Mon Tue Wed Thu Fri Mon Tue
Burndown Chart
Corresponding
Burndown Chart
35
Burndown Chart and
corresponding CFD
36
0
2
4
6
8
10
12
Wed Thu Fri Mon Tue Wed Thu Fri Mon Tue
Number
of
Items
To Do
Doing
Done
0
2
4
6
8
10
Wed Thu Fri Mon Tue Wed Thu Fri Mon Tue
Burndown Chart
Note how the CFD can
provide deeper insight
toward how the team
worked during the
sprint.
37
0
2
4
6
8
10
12
Wed Thu Fri Mon Tue Wed Thu Fri Mon Tue
Number
of
Items
To Do
Doing
Done
0
2
4
6
8
10
Wed Thu Fri Mon Tue Wed Thu Fri Mon Tue
Burndown Chart
Burndown Chart and
corresponding CFD
Note how the CFD can
provide deeper insight
toward how the team
worked during the
sprint.
excella.com | @excellaco
Mark Grove

Interpreting Cumulative Flow Diagrams (CFDs)_Mark Grove.pdf