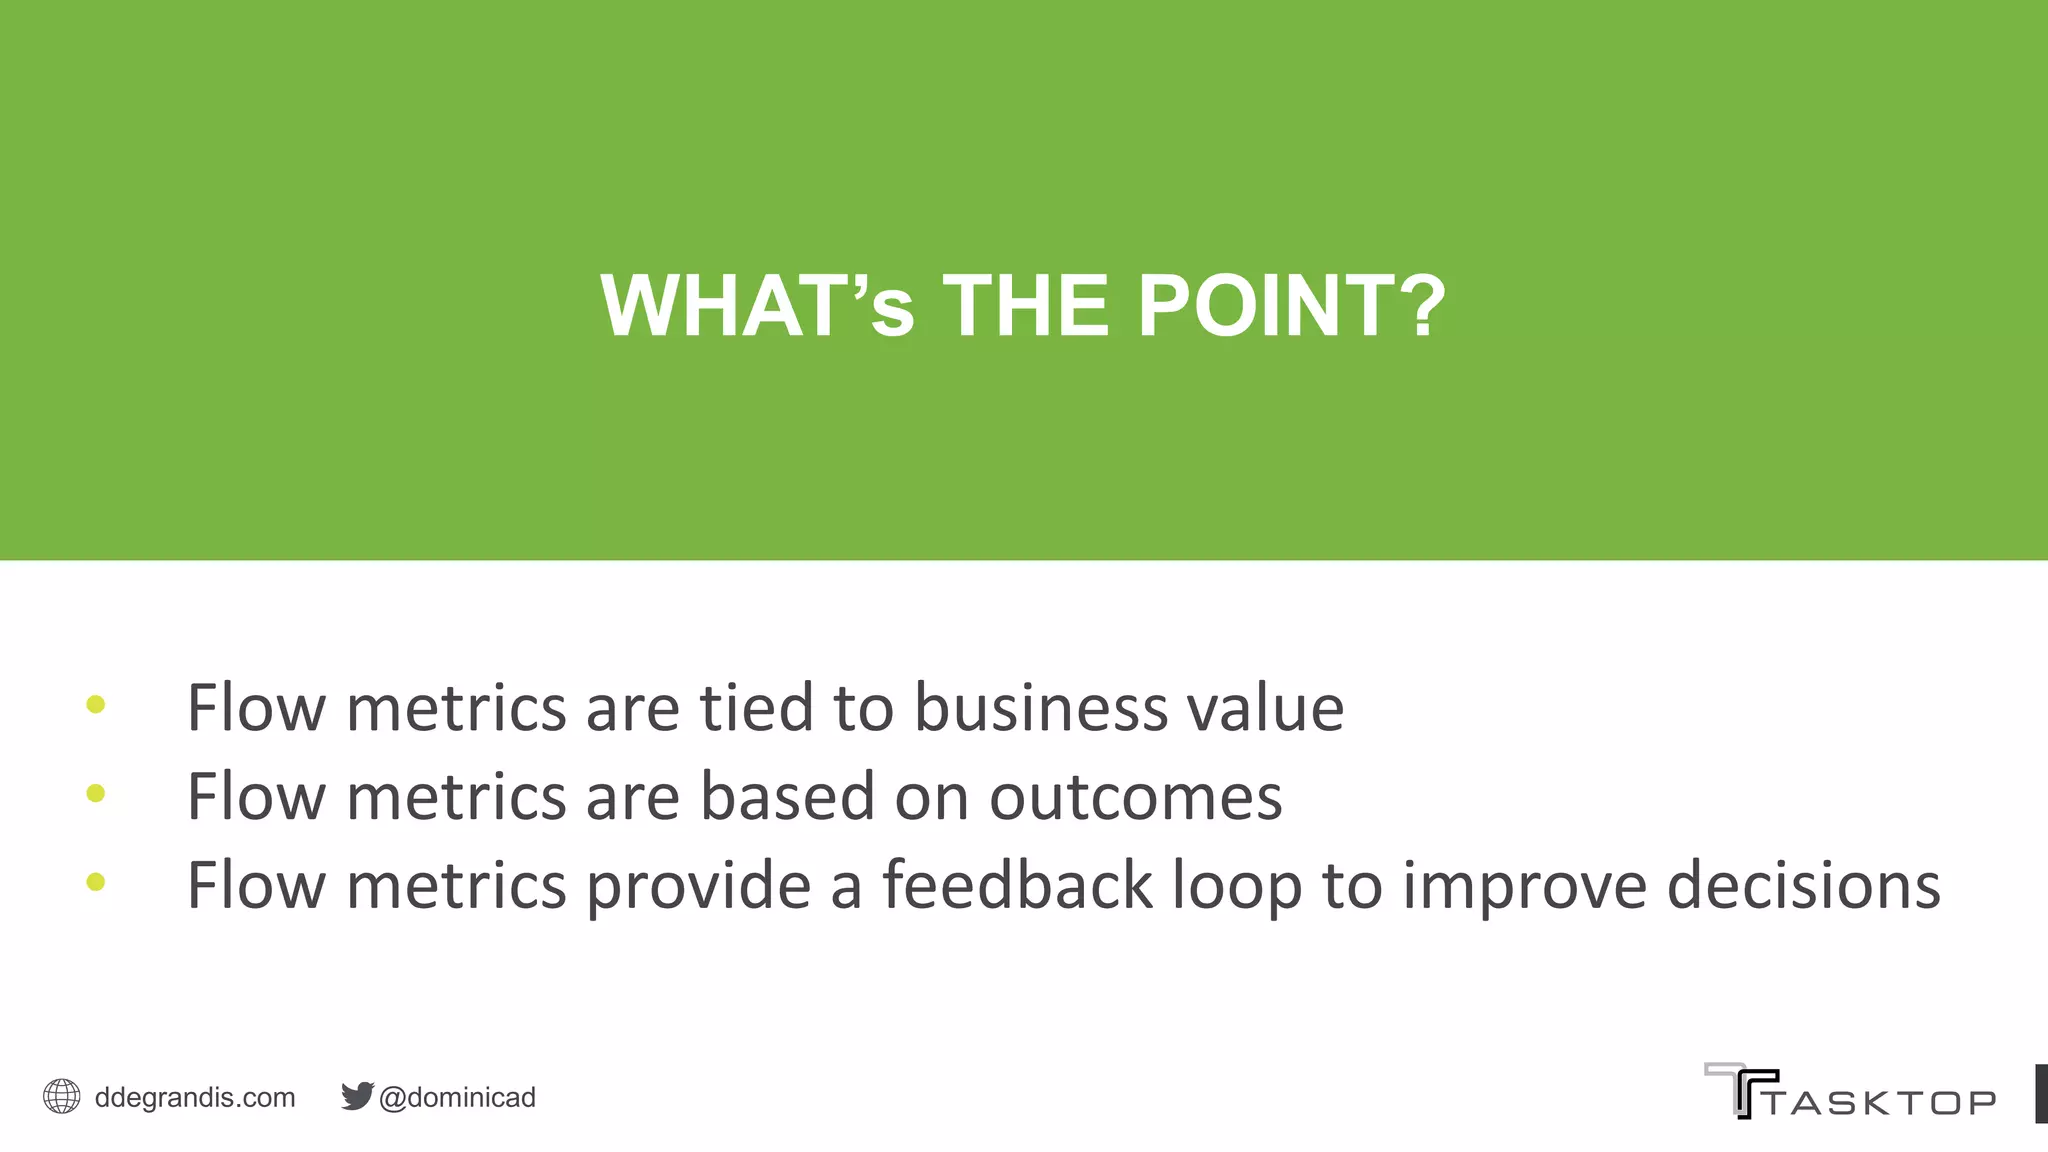
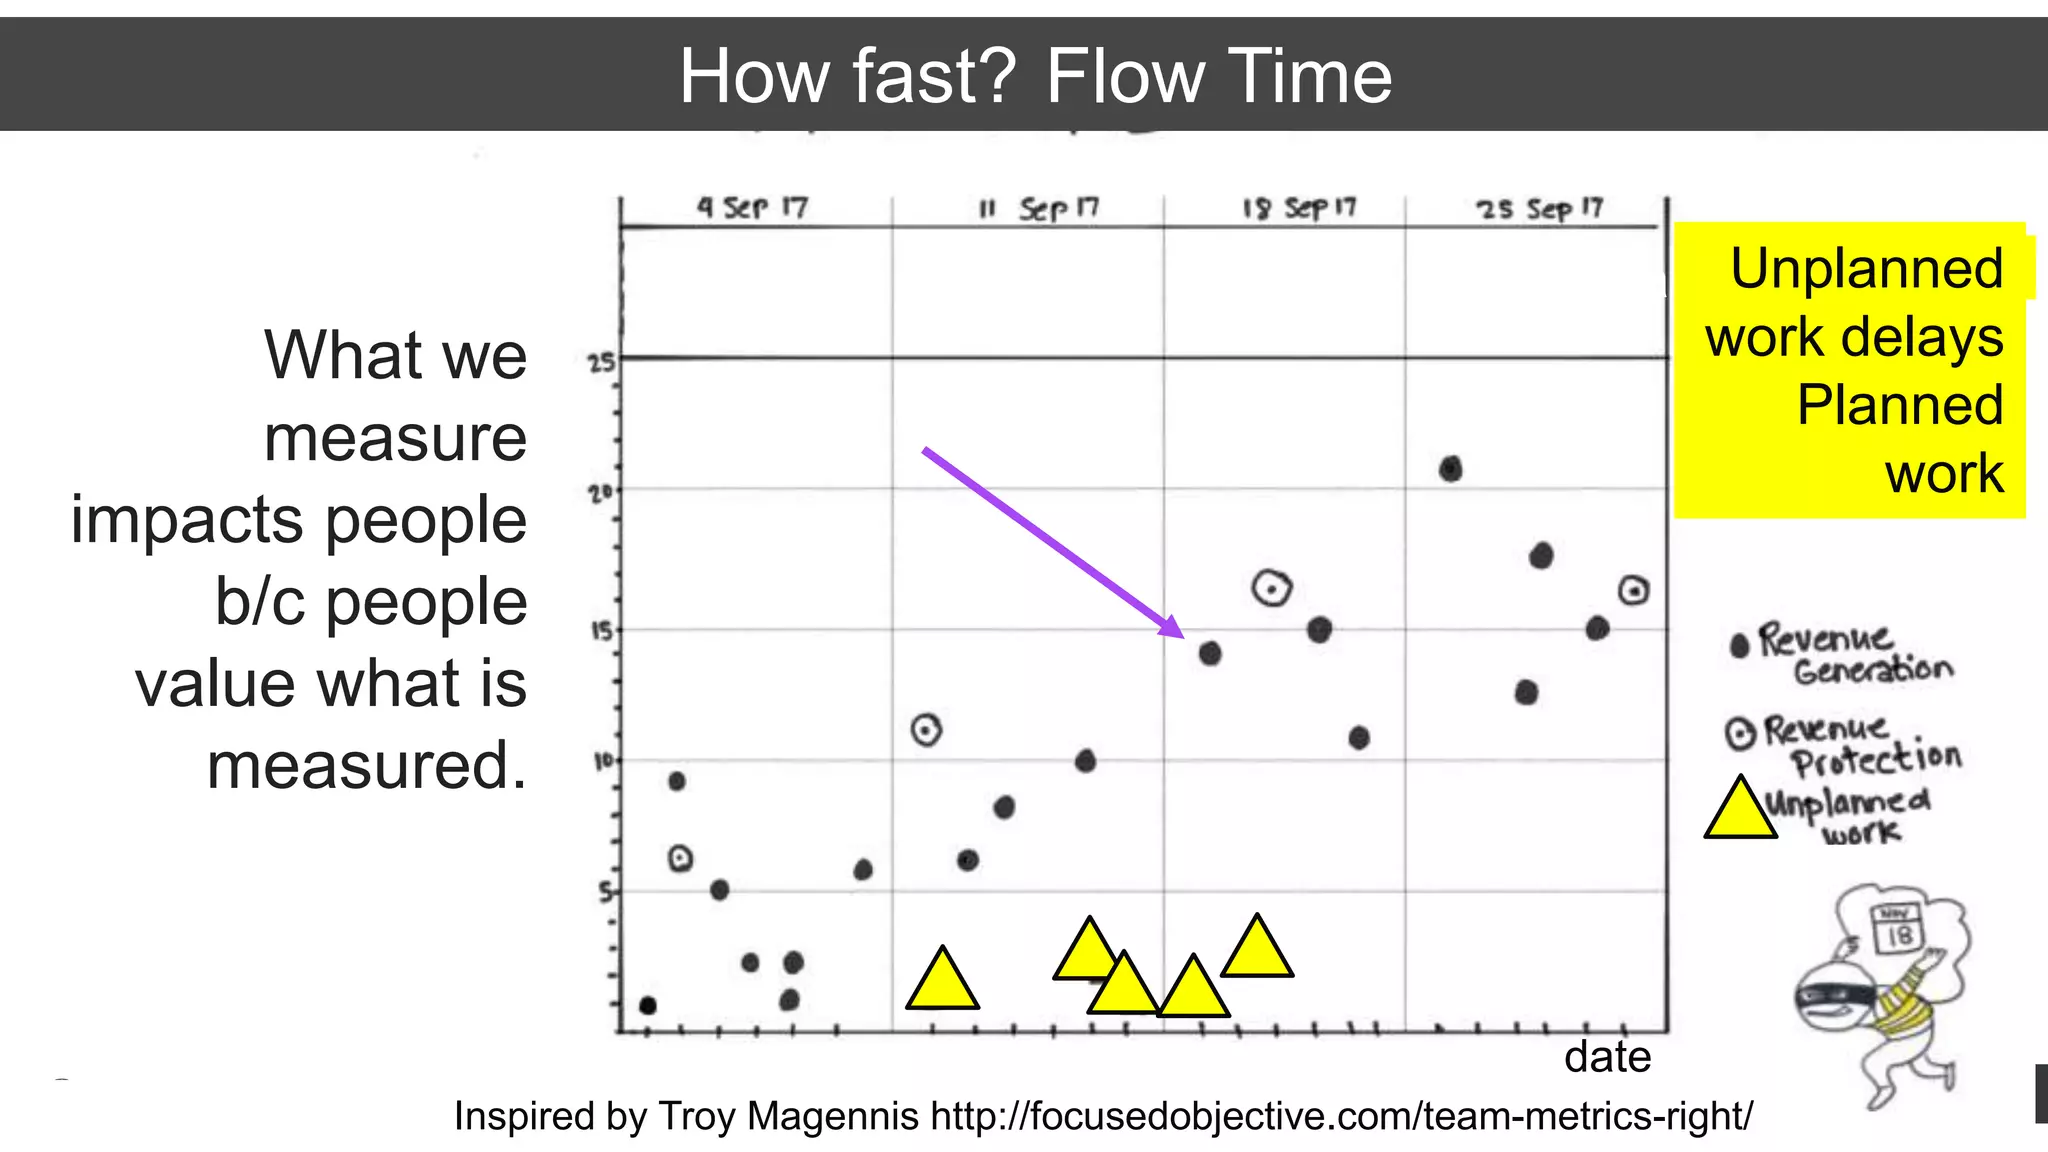
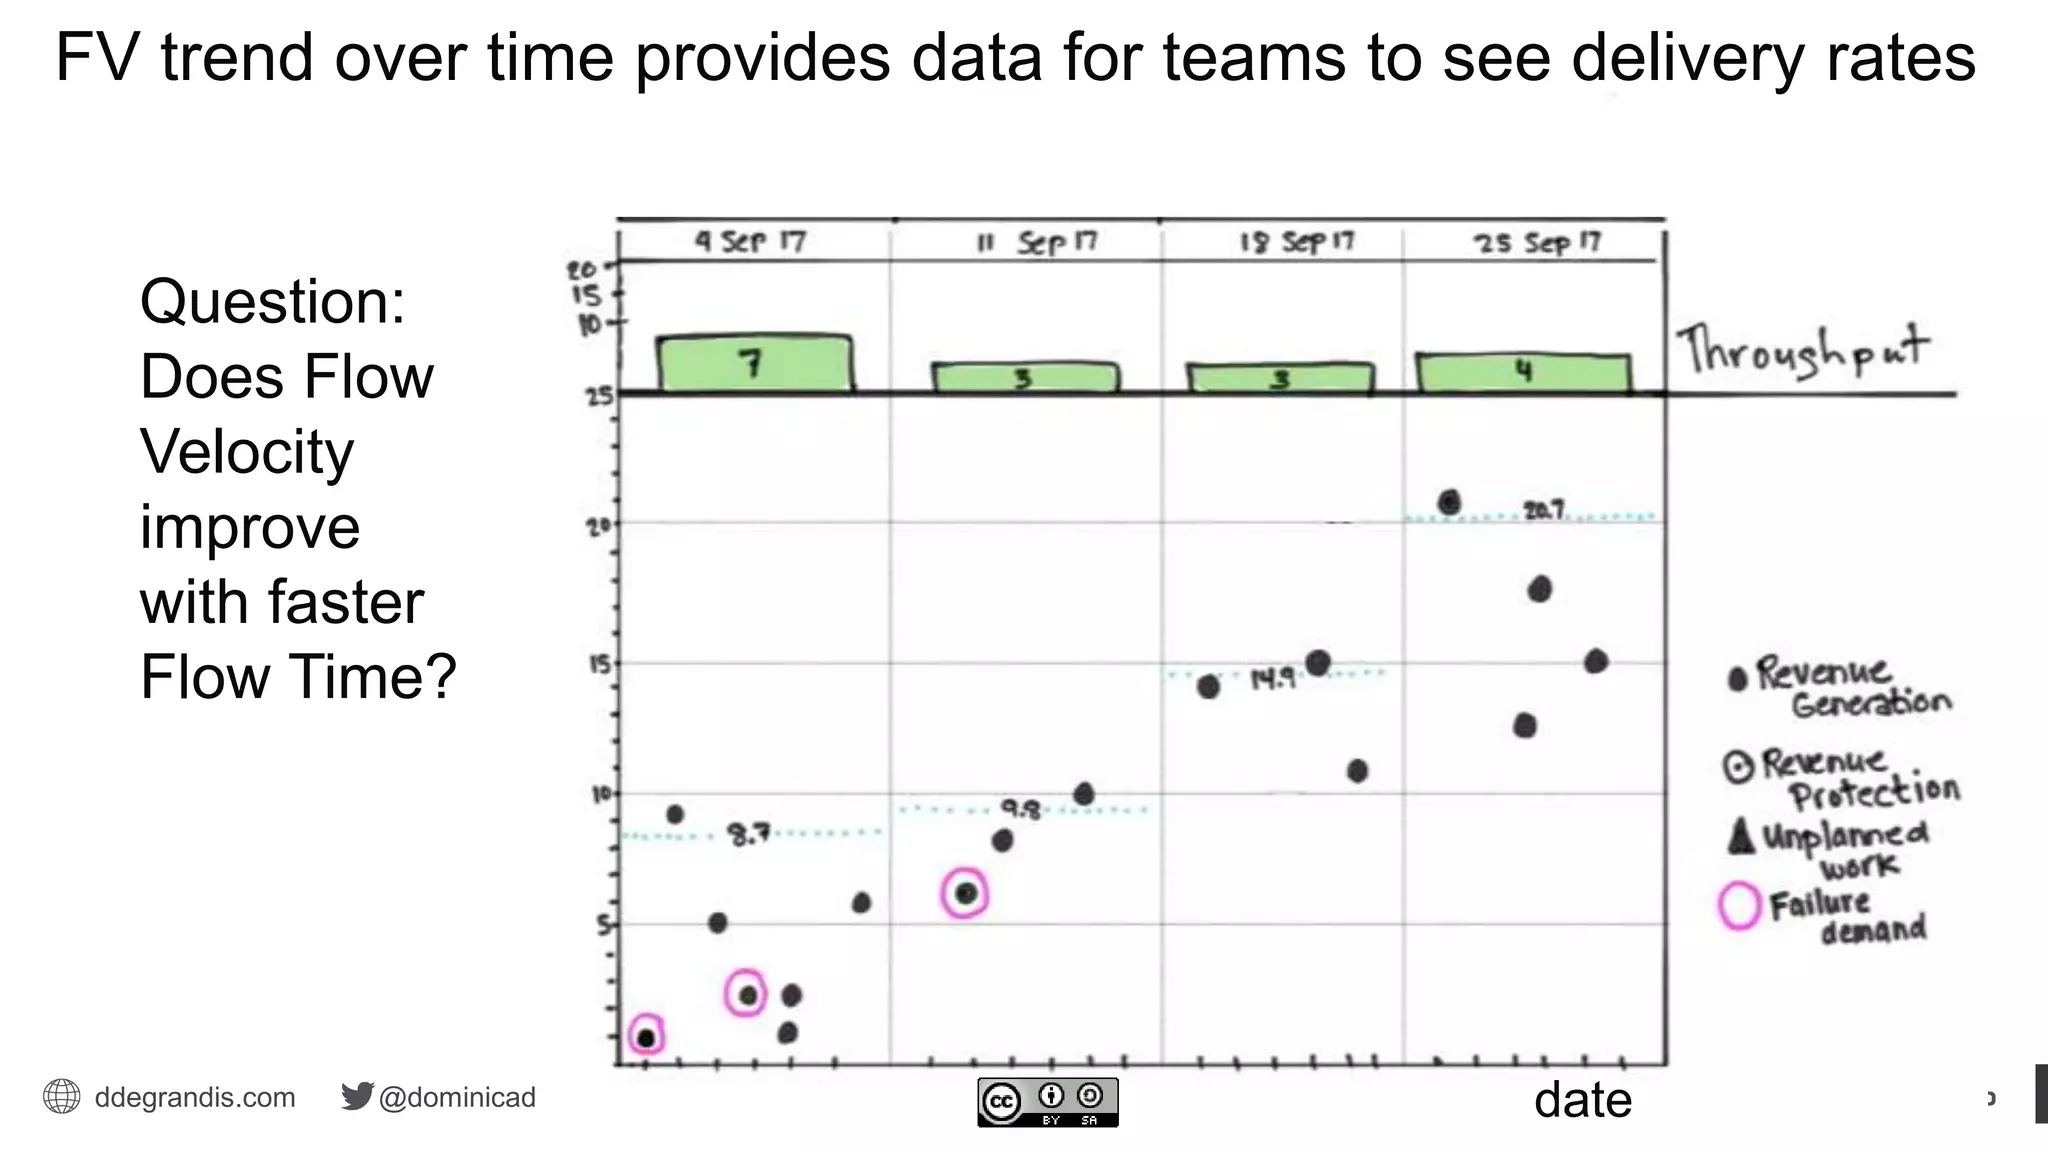
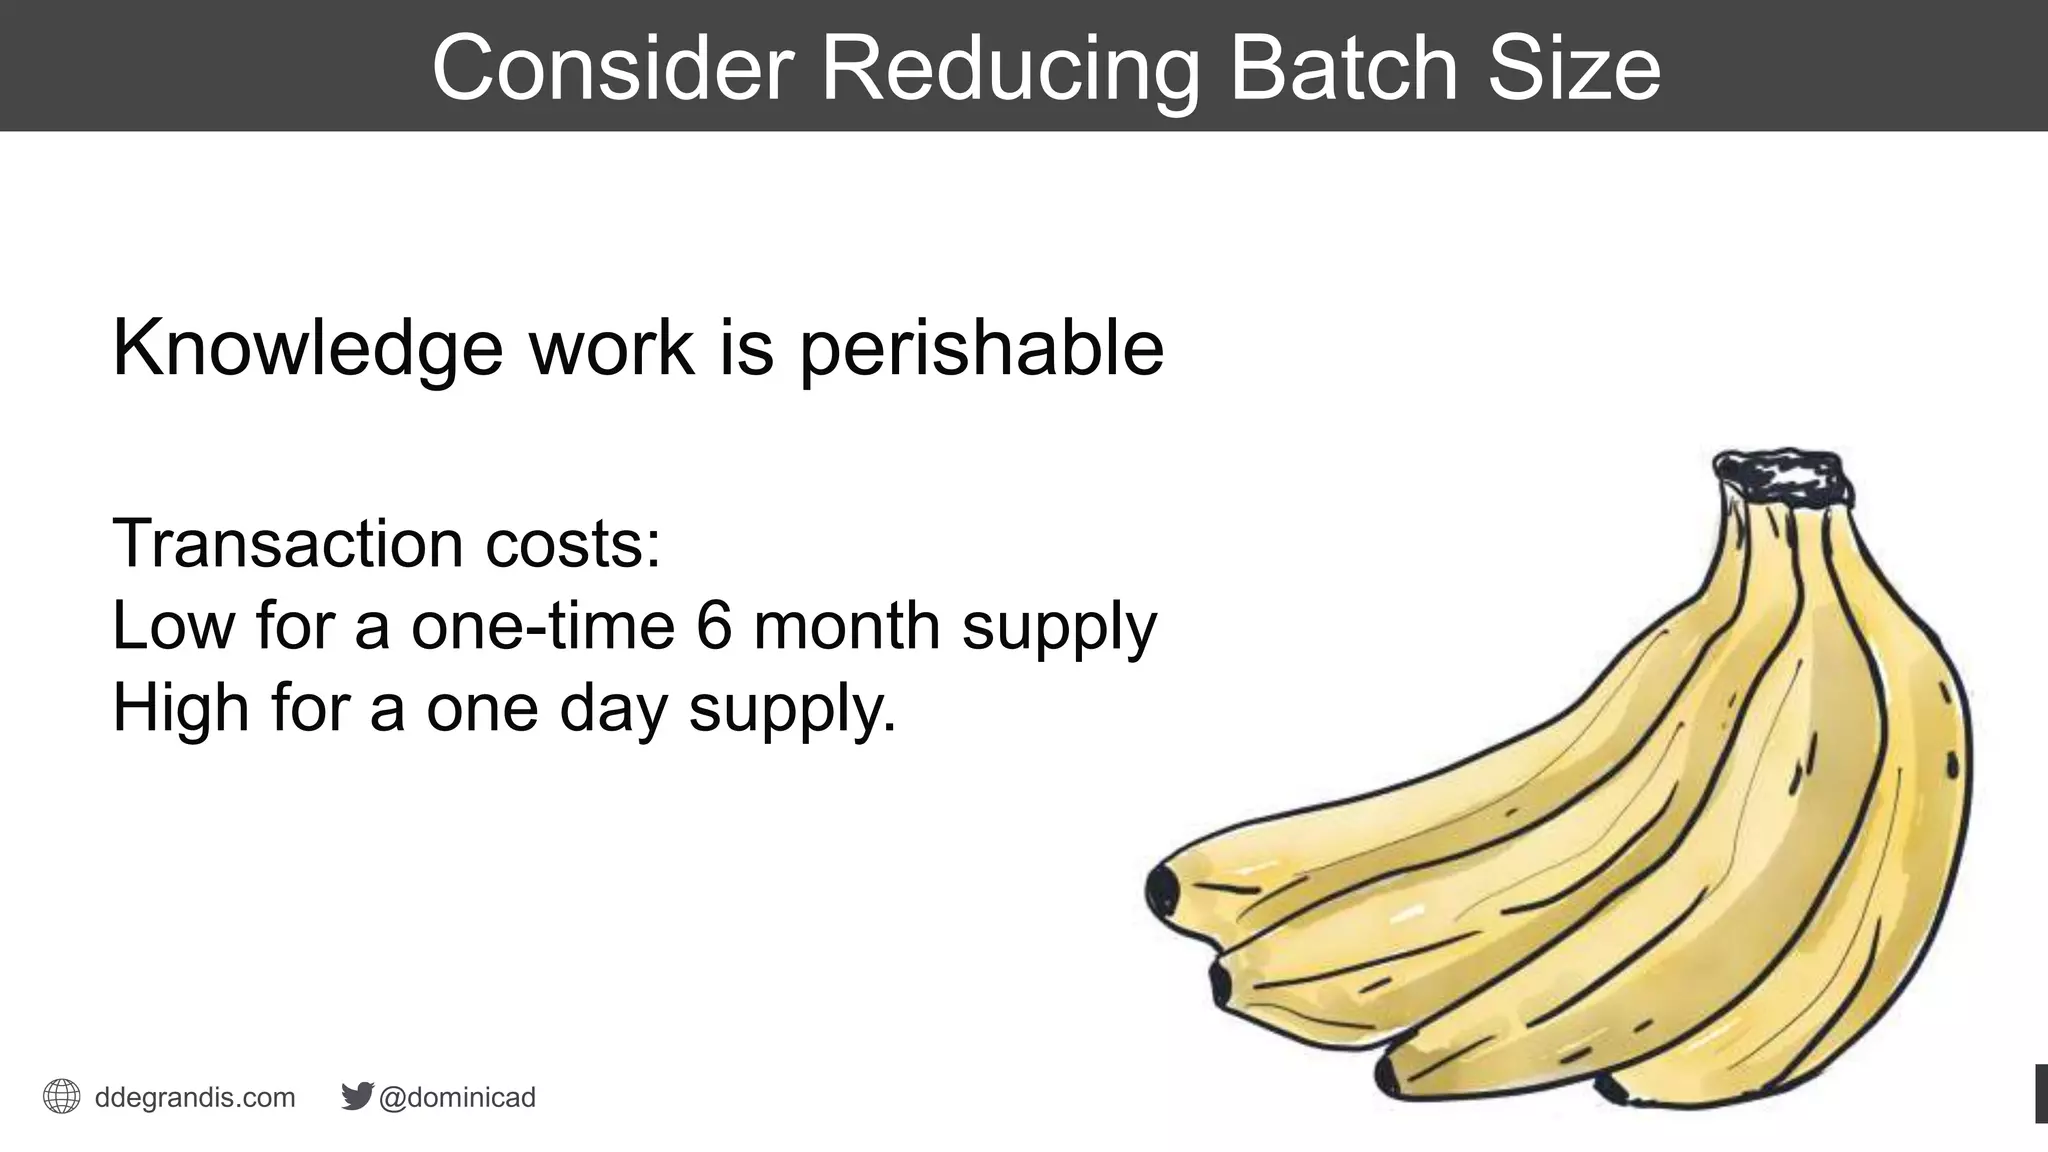
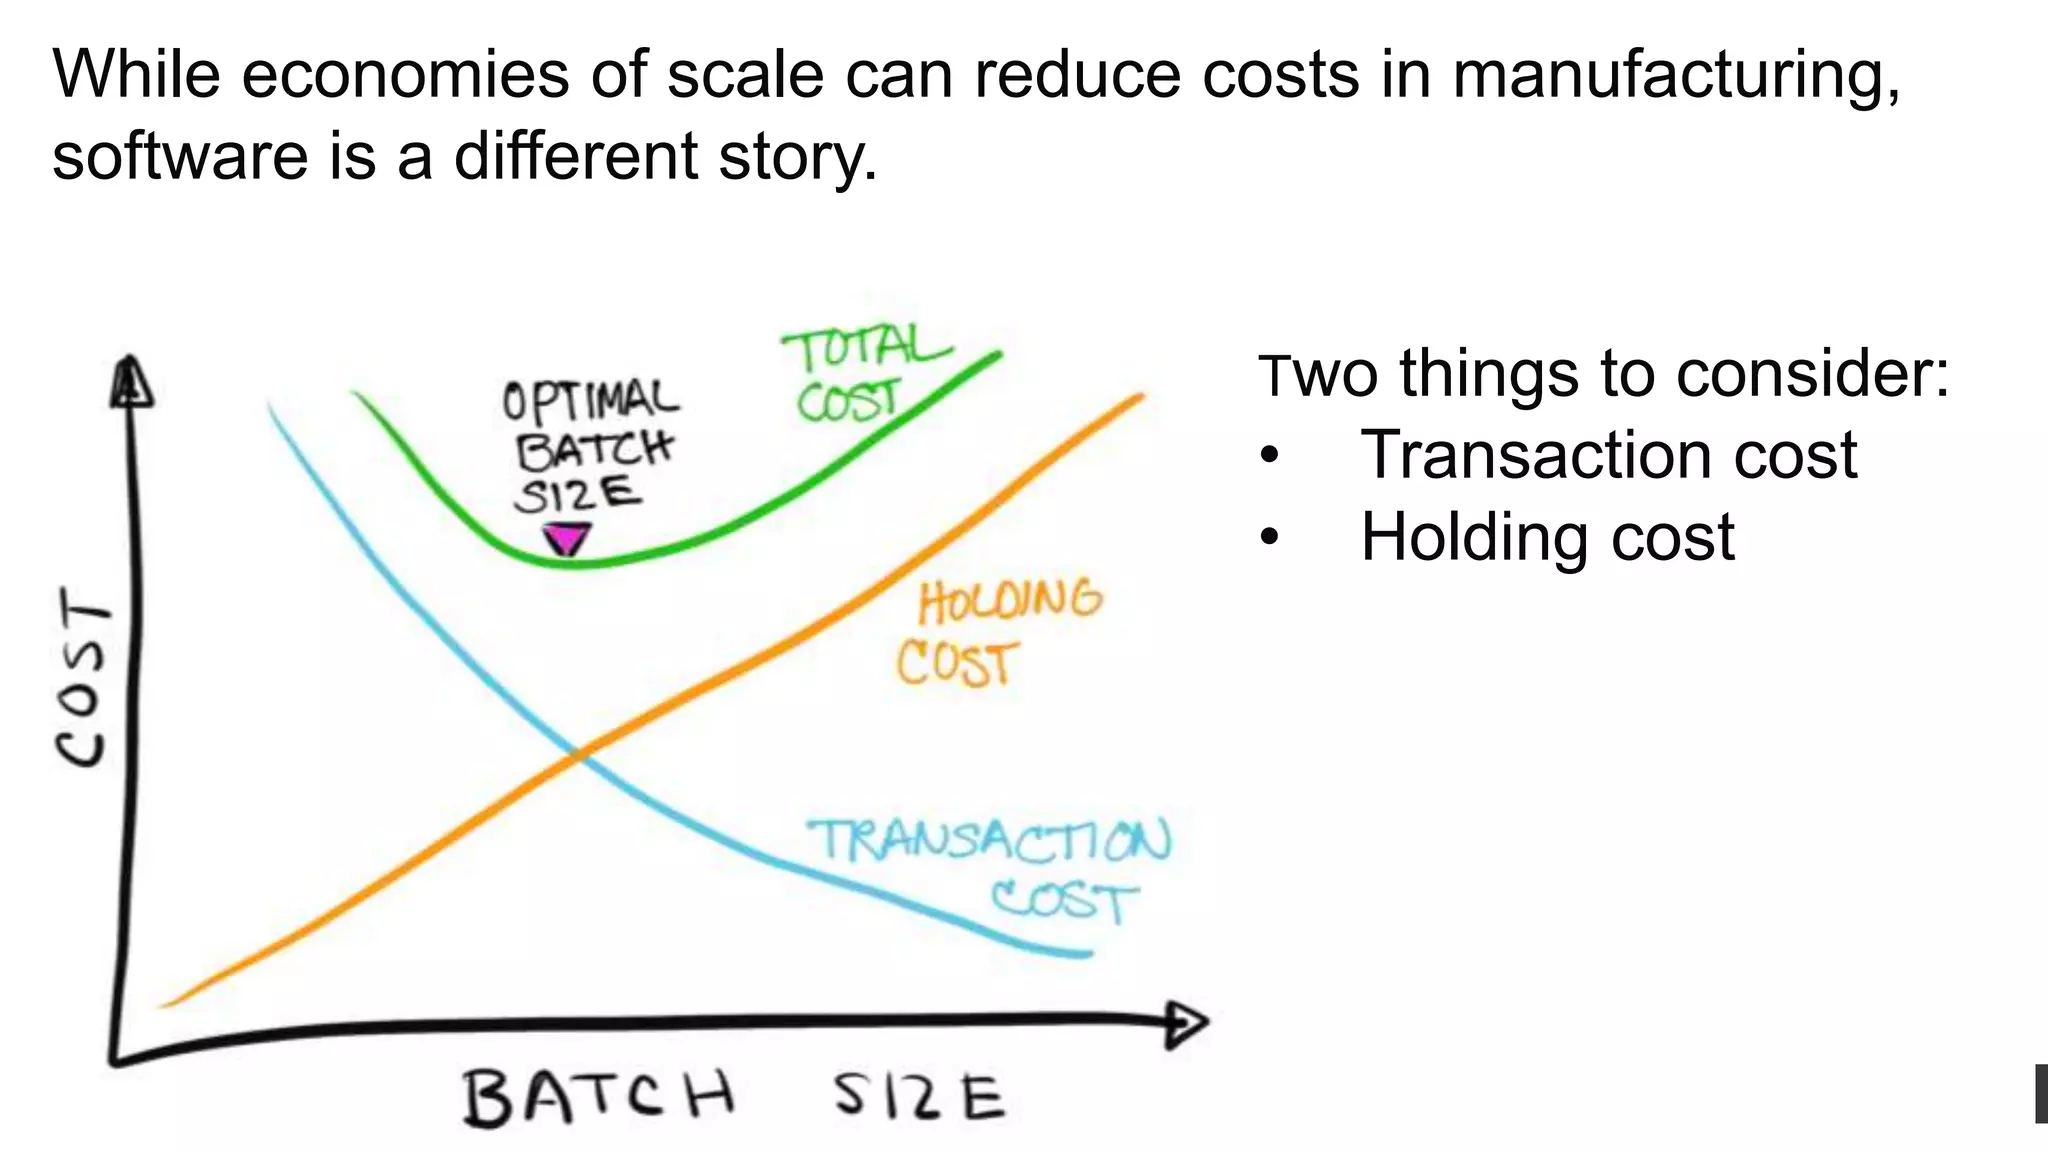
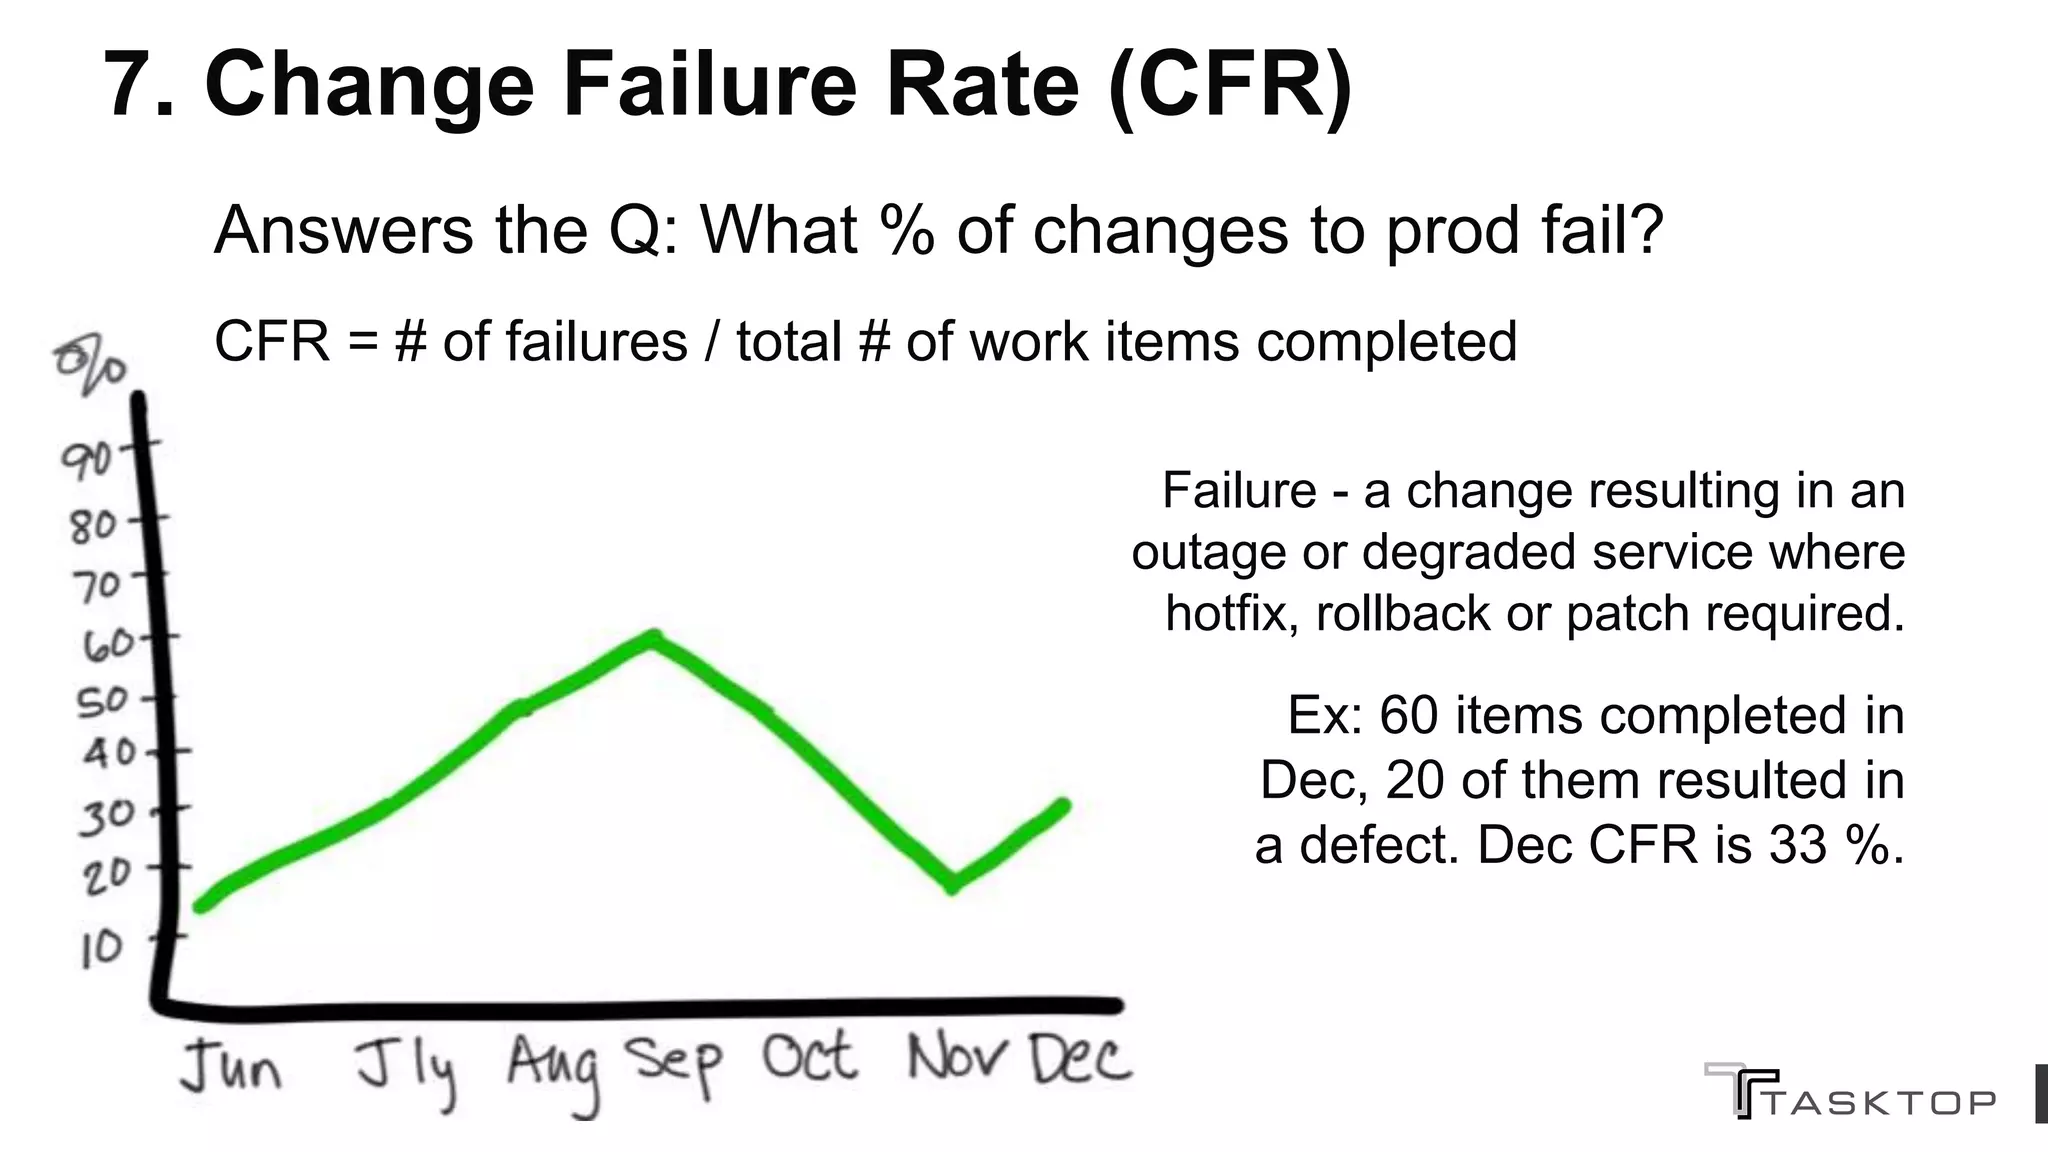
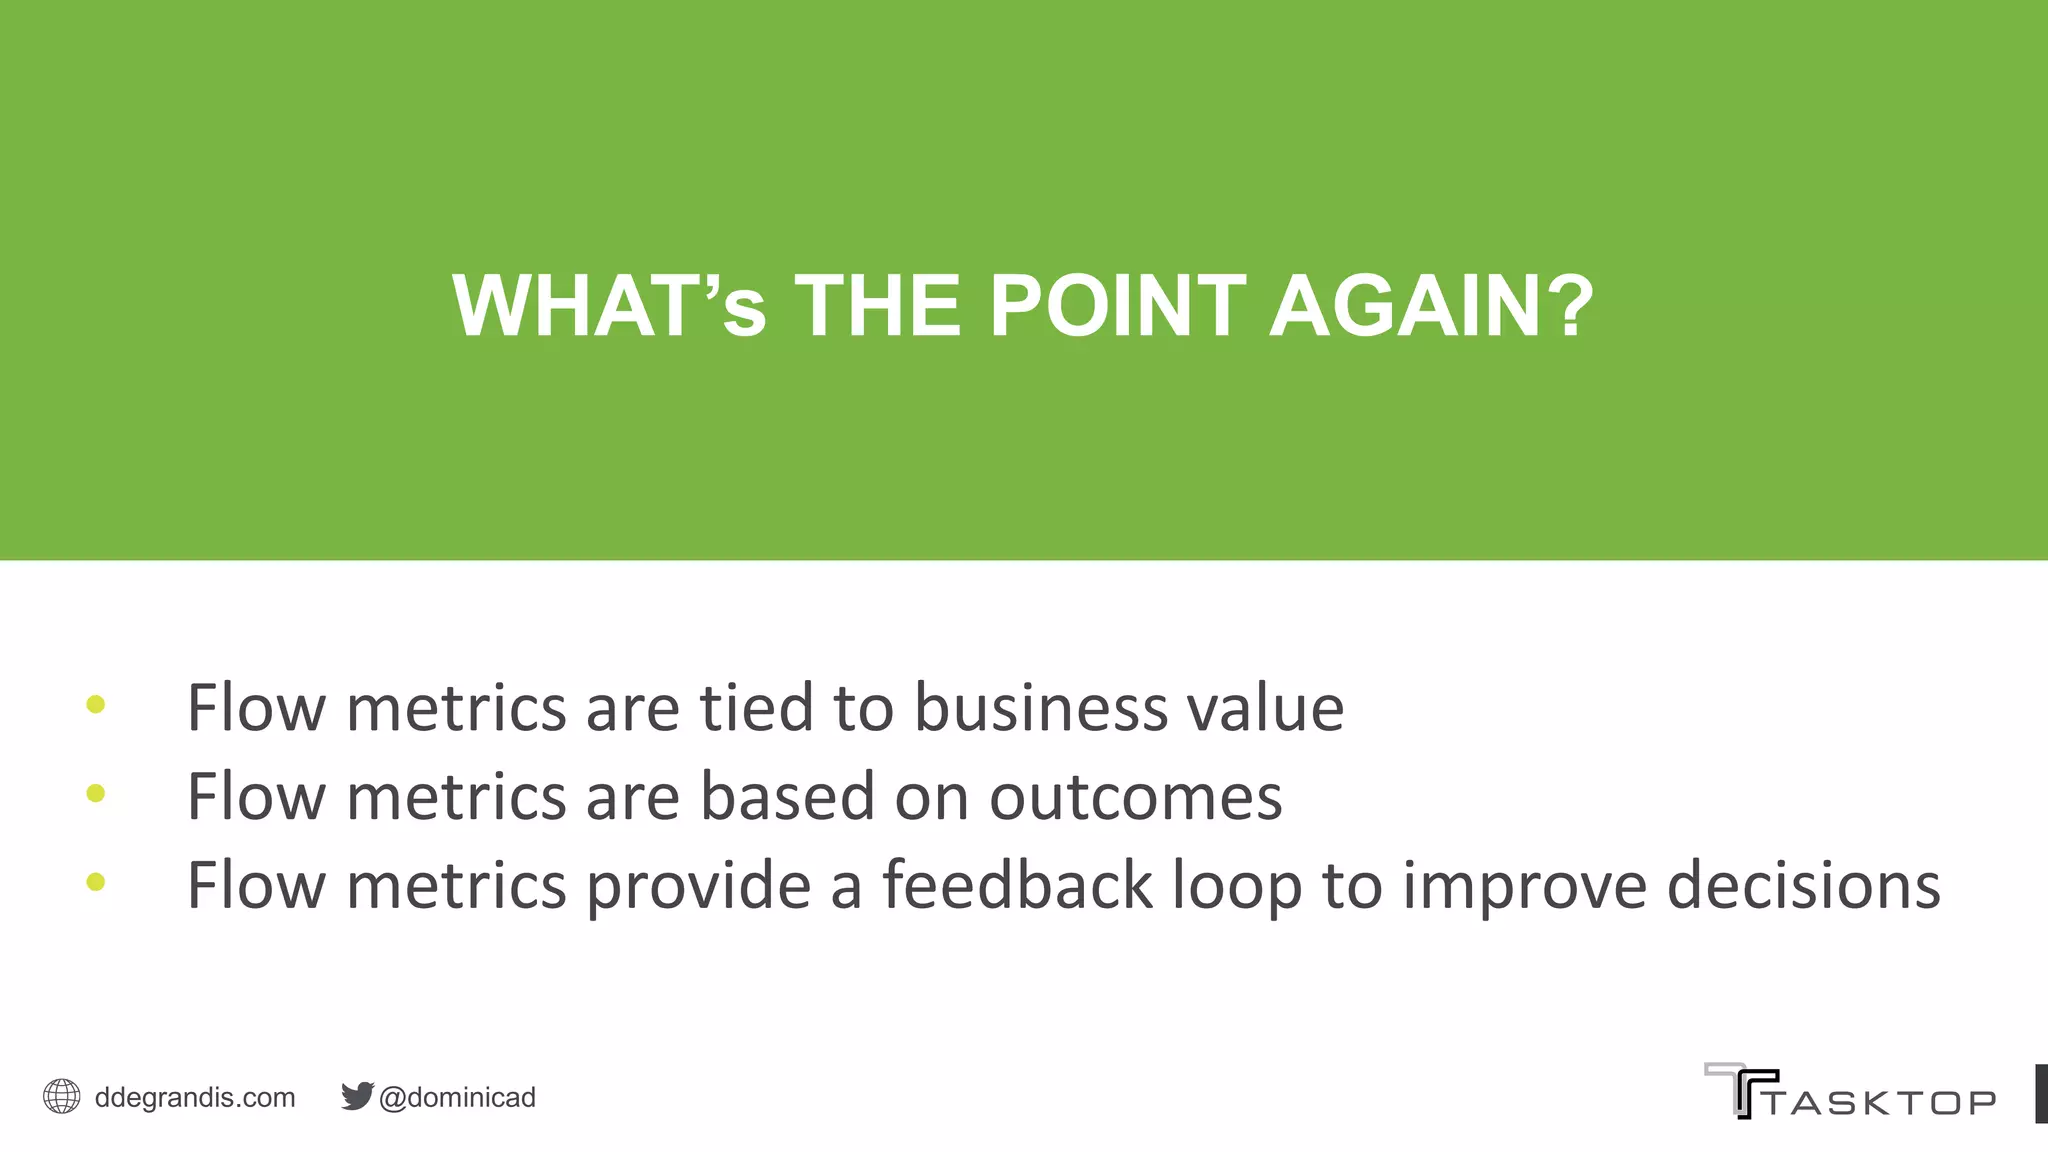
When it comes to assessing an IT transformation (such as Agile and DevOps), performance metrics have come under intense scrutiny. Traditional performance metrics, such as counting the number of lines of code and the number of software bugs should be used with caution, because there are bugs that are not worth fixing and code that is not worth maintaining. These old-school performance metrics represent activities, not outcomes. To visualize and optimize the business value of your software delivery, you need to find a way to measure business outcomes. To do that, we need flow metrics.
During this on-demand webinar, Dominica DeGrandis presents five key flow metrics that reveal trends on desirable business outcomes – such as faster time-to-market, responsiveness to customers, and predictable release timeframes – and explains how to implement them at your organization to measure and improve the impact and value of software products on your business.
XBOSoft runs through the Top 10 Agile Metrics revealing the most fundamental data points Agile methodology requires to work effectively, and will put you on the highly targeted path to successful implementation of your Agile processes.
XBOSoft and Go2Group run through the top data points you should be measuring in your Agile Workflow. We’ll show you what to track, when and how often, and most importantly – why. Many believe that metrics are useless, but unless you measure, how can you systematically improve or know how you are doing? And with velocity as an overarching objective in agile, you should be tracking other things so that you know what else you could be impacting by going faster. But, with all the metrics so readily available to us today, how do we filter through to the most meaningful?
Align, Inform, Inspire: Measuring Business Agility and SAFe® with Flow MetricsTasktop
During this on-demand webinar, Scaled Agile Principal Consultant and Framework team member, Andrew Sales, and Tasktop Sr. Value Stream Architect, Lee Reid, discuss how the three measurement domains of SAFe—Outcomes, Flow, and Competency—provide a comprehensive, yet simple, model for measuring business agility at every level of the enterprise and view data from an actual product value stream to demonstrate how Flow Metrics can enable productive conversations with the business about prioritizing work, while still maintaining the taxonomy of SAFe for teams to implement and improve.
Immer mehr Organisationen setzen Flight Levels als ein Denkmodell ein, damit das Unternehmen agil am Markt agieren kann. Dafür braucht es sehr viel mehr, als einfach nur ein paar Teams zu agilisieren. In diesem Vortrag werde ich anhand eines Unternehmens zeigen, wie Flight Levels dafür verwendet werden, teamübergreifende Business Agilität zu erreichen. Ich werde auch darauf eingehen, welche Boards gebaut wurden, um agile Interaktionen zwischen den Teams zu etablieren und wie sich die Arbeit über die Boards bewegt, damit strategisches Alignment in der gesamten Organisation erreicht wird.
Presenter:
Dr. Gail Ferreira, Agile Practice Leader, MATRIX Resources, San Francisco Center of Excellence
Rapid scale directly impacts all levels of decision-making, planning, execution, culture, and communications for executives in hypergrowth companies. In this session, we will discuss how to organize, support, and tailor agile practices for teams and sub-teams in companies with a rapid growth cycle. We will share contemporary case studies of hypergrowth companies who have delivered agile at scale.
Topics will include:
• Basic agile and lean methods
• Scrum of Scrums
• SAFe
• Disciplined Agile Delivery (DAD)
• Agility at Scale (Ambler/Lines)
• Spotify model (Tribes, Squads, Chapters & Guilds, DSDM).
10 steps to a successsful enterprise agile transformation global scrum 2018Agile Velocity
Presented at Scrum Gathering Minneapolis, Senior Agile Coach and Trainer Mike Hall provides leaders and managers 10 steps to a successful enterprise Agile transformation.
Actionable Agile Metrics for Predictability - Daniel VacantiAgile Montréal
Actionable Agile Metrics for Predictability
“When will it be done?” That's the first question customers ask once work is started. Your predictability is judged by the accuracy of your answer. Think about how many times you’ve been asked that question and how many times you’ve been wrong. That you’ve been wrong more times than right is not necessarily your fault. You have been taught to collect and analyze the wrong metrics. Until now.
About Daniel Vacanti
Daniel Vacanti is a 20+ year software industry veteran who has spent most of his career focusing on Lean and Agile practices. In 2007, he helped to develop the Kanban Method for knowledge work and managed the world’s first project implementation of Kanban that year. He has been conducting Lean-Agile training, coaching, and consulting ever since. In 2011 he founded ActionableAgile (previously Corporate Kanban) which provides industry-leading predictive analytics tools and services organizations that utilize Lean-Agile practices. In 2015 he published his book, “Actionable Agile Metrics for Predictability”, which is the definitive guide to flow-based metrics and analytics. Daniel holds an M.B.A. and regularly teaches a class on lean principles for software management at the University of California Berkeley.
What is the best Agile Adoption or Agile Transformation organization and team structure and the talent needed to successfully implement Agile across the company? Is there a best approach?
Team Topologies - how and why to design your teams - AllDayDevOps 2017Matthew Skelton
From the AllDayDevOps 2017 live stream https://www.youtube.com/watch?v=XqowSG2Jxqc
For effective, modern, cloud-connected software systems we need to organize our teams in certain ways. Taking account of Conway’s Law, we look to match the team structures to the required software architecture, enabling or restricting communication and collaboration for the best outcomes.
This talk will cover the basics of organization design, exploring a selection of key team topologies and how and when to use them in order to make the development and operation of your software systems as effective as possible. The talk is based on experience helping companies around the world with the design of their teams.
Takeaways:
- The implications of Conway’s Law for software teams
- Cognitive Load for teams
- Effective team topologies
- Team evolution
Introduction to SAFe, the Scaled Agile Frameworksrondal
Sans doute vous identifiez vous dans une ou plusieurs des situations suivantes:
- plusieurs équipes Scrum travaillent dans votre entreprise, parfois sur un même projet ou des projets connexes
- la coordination entre équipes Scrum n'est pas optimale
- vous-même, ou certains stakeholders, ont besoin d'une vue plus long terme sur vos projets Agile, plus que "juste le prochain sprint"
- sur base du succès de Scrum dans votre entreprise, vous voulez allez plus loin et vous voulez rendre plus agile l'entièreté de votre entreprise
Si c'est le cas, venez découvrir le framework SAFe.
Après une présentation du framework et de ses fondements, vous serez en mesure de mieux le comprendre, et de voir ce qu'il peut apporter ou non à votre entreprise.
Learn the fundamentals of Lean-Agile project portfolio management.
This is the Lean PPM part of the Lean-Agile Project Management (LeanPM®) training developed by the Lean Project Management Foundation.
Read the full chapter on www.leanpm.org.
This slide gives an excellent overview of Agile Planning and Estimation.
Will be really helpful, if presented to a Scrum/Agile Team to understand activities related to Release Planning, Sprint Planning and Estimation
We are doing Agile well..We have been Agile now.. Is it just an assumption or do we have data to support it? Do metrics add any value or they are just a fad? Good metrics affirm & reinforce Agile principles. They open up the conversation and help the teams to improve. They are not only for management, it is for everyone who wants to inspect and adapt.
So this presentation is about how metrics can be used effectively in Agile to enable transparency and improve the overall efficiency at the team/ program and portfolio level.
Metrics at Every (Flight) Level [2020 Agile Kanban Istanbul FlowConf]Matthew Philip
Slides as presented on Dec 8, 2020 at FlowConf organized by Agile Kanban Istanbul. https://www.flowconf.com/
Organizational change often stalls out at departmental boundaries, whether that is IT or another division. How do we help organizations connect vertically and horizontally to realize the outcomes that they have when undertaking large-scale change efforts?
Join this session to learn from a case study of a bank that combined flight levels and metrics to bridge their departmental boundaries and recognize gains not only in software delivery effectiveness but unifying higher-level strategy.
This is the graphics from my famous Agile in a Nutshell poster that has been downloaded over 18.000 times since October 2016. It covers both briefly the background to why we work Agile, some history and problems as well as values and principles. It also covers the difference between waterfall development and Agile in two aspects and the most common Agile practice, basic Scrum. Also I added some Lean practices to the mix to add a more advanced level to it.
On the Dandy People blog you can download the free poster in English, French, Spanish and Turkish, as well as this Power Point.
http://blog.dandypeople.com/free-kit-agile-in-a-nutshell-poster/
Flow Metrics: What They Are & Why You Need ThemSBWebinars
When it comes to assessing an IT transformation (such as Agile and DevOps), performance metrics have come under intense scrutiny. Traditional performance metrics, such as counting the number of lines of code and the number of software bugs should be used with caution, because there are bugs that are not worth fixing and code that is not worth maintaining. These old-school performance metrics represent activities, not outcomes. To visualize and optimize the business value of your software delivery, you need to find a way to measure business outcomes. To do that, we need flow metrics.
From Divided to United - Aligning Technical and Business TeamsDominica DeGrandis
This is a true story of one SaaS company's journey to gain alignment across business and technical teams by changing how four important factors were viewed: customer demand, work prioritization, team metrics, and communication etiquette.
From Divided to United - Aligning Technical and Business TeamsLeanKit
Are your technical and business teams at odds with each other? They don't have to be. Join us tomorrow to discover the secret to gaining alignment.
Dominica DeGrandis, Director of Learning and Development at LeanKit, will share how clarity on priorities, cross-functional dependencies and team metrics drive unity.
You'll learn how to:
- Balance business requests with maintenance work
- Prioritize up, down and across the hierarchy
- Get visibility on cross-functional dependencies
Dominica will share her observations while working at a SaaS company on the methods used to create clarity.
This is a true story about aligning technology and business teams. Clarity on three areas: customer demand, transparency, and communication are presented.
2021 Chrome Dev Summit: Web Performance 101Tammy Everts
What do we mean when we talk about "web performance"? Why should you care about it? How can measure it? How do you get other people in your organization to care? In this workshop at the 2021 Chrome Dev Summit, I covered these questions – including an overview of the history of performance metrics, up to Core Web Vitals.
DevOps Deep Dive Webinar: Building a business case for agile and devopsBasis Technologies
You may have heard about DevOps buzz. But what do you need to know to convince your boss to build a business case ? Why should your organization invest in the changes required to adopt DevOps and Agile methods?
For many companies, DevOps and Agile is a part of this digital transformation puzzle, giving them the agility and operational benefits needed to change IT systems fast.
Download this webinar recording where we’ll explain the technical and business advantage of implementing DevOps and Agile practices in your organization, and how to go about doing it.
Just go to: http://www.basistechnologies.com/Building-a-business-case-for-DevOps-and-Agile-for-SAP-webinar
This presentation dives into our recent survey, Blind Sweat & Tears: A Study Into Client Project Management Practices Across the Professional Services Sector, where you'll hear the key findings and learnings of the white paper, including special additional insights that will prove valuable for anyone who manages client projects. It also focuses on the latest insights into project management practices across the professional services sector and the potential risks associated with poorly managed projects. To watch the webinar visit: https://www.affinitylive.com/resources/blog/how-professionals-manage-client-projects-watch-the-webinar-video/
5 Key Elements of IT Project ManagementOrangescrum
The wide range of project management, productivity, collaboration and time tracking tools in the market are testimony to it. Providing the teams with a centralized collaborative platform motivates them to deliver faster and with quality. https://blog.orangescrum.com/
This talk was presented at AgileDC2018
Abstract:
Is your team constantly missing delivery dates? Is the velocity decreasing from sprint to sprint while the development costs are rising? Are customers complaining about the increasing number of bugs and the long time it takes to add new features? These are all signs that you are mired in technical debt and probably on your way to bankruptcy or a complete system rewrite. Technical debt is inevitable, whether intentional or unintentional. However, not managing technical debt can paralyze your organization. Fadi Stephan expands on the technical debt metaphor and introduces a technical debt management plan that enables executives and teams to make prudent decisions on code quality and technical debt. Come learn how to measure the quality of your code base and determine the amount of your debt.
Key note - Lean Kanban Central Europe 2012 - Managing a Risky Business - Unde...David Anderson
Using Kanban to improve Risk Management inside creative knowledge worker industries. This talk takes a first look kanban system liquidity as a measure of predictability and reliability of service delivery. [The liquidity section of this talk was updated and improved at Lean Kanban North America 2013]
Managers, responsible for leading change in organizations are struggling to adapt. Many are failing. Individual workers need and deserve better support to be productive. This talk addresses how to use a Lean DevOps philosophy to influence change to salvage ITOps reputations.
Similar to Flow Metrics: What They Are & Why You Need Them (20)
The Inextricable Link Between Value Streams and Resource Capacity PlanningTasktop
During this on-demand webinar, Tasktop President and COO, Neelan Choksi, and guest speaker, Forrester Vice President and Principal Analyst, Margo Visitacion, discuss why product value streams are the key to better capacity planning.
Webinar featuring Forrester TEI study: Driving 496% ROI with Tasktop VizTasktop
Business and IT leaders are under constant pressure to deliver outstanding customer experiences, fueled by technology and innovation, at the speed of the market and at a competitive cost.
To better understand how Tasktop Viz™ can connect enterprise transformation initiatives with financial benefits, Tasktop commissioned Forrester Consulting to conduct a Total Economic Impact™ (TEI) study and examine the potential ROI enterprises may benefit from by deploying the Tasktop Viz value stream management solution. What the study found was significant, with Tasktop Viz users experiencing up to 496% ROI over three years.
In this on-demand webinar, Tasktop CPO, Nicole Bryan, and guest speaker, Forrester Senior Consultant, Sam Conway, discuss the findings of the TEI study and what implementing Tasktop Viz could mean for your business.
Prove Your Transformation ROI with Value Stream ManagementTasktop
2020 elevated IT into the spotlight, opening up a window of unprecedented support for accelerating digital innovation and emerging technologies. But even with increased buy-in for investment and adoption, will anything be different this year?
Without the ability to measure and place value on specific transformation initiatives, many organizations are still shooting in the dark, either working on new features without aligning to business strategy, or putting them on the back-burner to concentrate on things that are easier to cross off a list.
In this on-demand webinar, Tasktop Sr. Flow Advisor, Paninya Masrangsan, provides actionable insights on how to prove your transformation ROI with value stream management.
Let It Flow: Using Flow Metrics to Combat Cognitive OverloadTasktop
Do conflicting priorities and interruptions disrupt your week? Is your calendar crammed with back-to-back meetings? If you are already overloaded and continue to take on more work, it’s likely you’re stressed. Stress impacts cognitive functioning - making it onerous to focus on and complete important work. While cognitive overload is difficult to measure, the impact is huge.
How can the impacts of stress be measured--and communicated? In this on-demand webinar, Tasktop Principal Flow Advisor, Dominica DeGrandis, presents actionable takeaways to address cognitive overload including:
- How to enable discussion for improvements using Flow Distribution and Flow Load
- How to allocate capacity for debt work by initiating “Flow Protection Time”
- How to put conditions in place for data-driven experimentation
Leveraging Validation Lifecycle Data to Drive Actionable Business InsightsTasktop
In this on-demand webinar, Tasktop Sr. Value Stream Architect, Dan Feminella, Tx3 Services Co-founder and CRO, Eric Toburen, and Merck & Co. Test Tool Specialist, Petr Srajb, present n how organizations can start making data-driven decisions while maintaining compliance and traceability by:
- Automating the flow of Computer Systems Validation (CSV) Lifecycle data to eliminate duplicate entry and boost productivity.
- Providing real-time visibility into the health of your product value streams to see how business value is flowing—not just work
- Generating Flow Metrics to spot bottlenecks and identify opportunities where investment is needed to maximize business results.
Driving Digital Transformation Insights with Value Stream ManagementTasktop
Many organizations have been on the road to AD&D transformation, making significant investments in CI/CD and release automation, yet they still have nagging issues such as siloed teams and lack of actionable data--and the new reality of working from home has made gaining the insights needed to master software at scale even more difficult. Value Stream Management (VSM) is helping enterprises to align and make better decisions, but there is still work to be done.
In this webinar, guest speaker Forrester Principal Analyst, Chris Condo and Tasktop CEO, Dr. Mik Kersten deliver an overview of Value Stream Management—a technology and methodology for gaining insight into software delivery processes that enables dev leaders to capture data that represents the actual state of processes—and discuss how Flow Metrics provide the analytics to help organizations better balance workloads, visualize bottlenecks and provide leaders with the data they need to make continuous improvements.
7 Must-Have Value Stream Management Capabilities to Maximize ROITasktop
The transition from project to product in Enterprise IT has the potential to drastically improve market response. Product line leaders can shift resources and funds up to 90% faster than in a project model.1 But that agility and authority is wasted if inadequate data and analytics on end-to-end flow are impeding IT from accelerating business growth.
Join Tasktop Sr. Director of Product, Naomi Lurie, and Principal Value Stream Architect, Mara Puisite for a webinar demonstrating how your organization can maximize business ROI with Value Stream Management and Flow Metrics by:
Measuring the rate of value delivery across software products and services
Capturing actionable insights into the bottlenecks impeding business value delivery
Providing a unified executive view of software delivery productivity and its correlation to business results like growth
Making informed data-driven decisions about future investments in a product line
From Factories To Flow: Streamlining Software Delivery at Cubic CorporationTasktop
Cubic Corporation is a technology-driven, market-leading solutions provider that has been innovating in the public transportation and defense industry for nearly seven decades – having revolutionized elevators, global positioning, public transit fare payments and military training. With a strong foundation of software delivery through solutions such as the “Top Gun” air combat training system as well as the fare payment systems for public transportation platforms in many US and European cities, Cubic set out on a journey to double down on software innovation. A key to that transformation was shifting to a product mindset to accelerate delivery through its highly complex value streams.
During this webinar, Tasktop CEO and founder, Dr. Mik Kersten interviews Jim Colson, CTO of Cubic Corporation on how their transformation is unfolding and lessons learned along the way. We cover Cubic’s use of the Flow Framework®, SAFe® and other industry standards and view some of the flow diagnostics identified by Tasktop Viz, where Cubic was able to accelerate the pace and velocity of delivery.
Power to the People! Shifting from Project to Product with Tasktop VizTasktop
If your executive leadership has begun planning a shift from project to product, it’s time to talk about how it impacts and benefits you.
Product Managers, Engineering Managers, Scrum Masters, and Agile Coaches are invited to join this webinar to learn about:
* Measuring what matters: What to measure when you shift to product.
* Getting to product metrics fast: How to measure product value streams in a traditionally project-oriented organization.
* Aligning with the business: How to focus teams on generating new business value while negotiating priorities like tech debt.
* Empowering teams: How to motivate teams in new product structures to identify and overcome their constraints and dependencies.
Your Tasktop co-hosts—Nicole Bryan, VP Product Development, and Naomi Lurie, Sr Director of Product Marketing—will share real-life stories from enterprises using Tasktop Viz to make the shift to product. They’ll also share best practices on how to get started and literally get insights within days.
How to Drive Maximum Business Value from IT Investments with the Flow FrameworkTasktop
When organizations connect and measure the impact of their IT investments on the business’ strategy, business and technology leaders are able to partner more effectively and accelerate the delivery of real business value.
But to do so, these teams must be seamlessly aligned throughout the delivery pipeline, able to quickly identify and resolve bottlenecks, and work together to optimize their processes end-to-end. Flow Metrics enable organizations to measure what matters in software delivery, optimizing the flow of business value from ideation to operation and turning IT from a project-oriented cost center to a profit-generating product operating model.
Key Takeaways:
Discover how to align business and IT leaders to optimize value delivery using the Flow Framework™
Learn how to use Flow Metrics to expose bottlenecks and reveal opportunities to improve time-to-market, responsiveness to customers, and quality
Understand how to create a seamless end-to-end flow of business value in large-scale application delivery using Blueprint Storyteller and Tasktop Hub
Enable High-performance and Strategic Capabilities with Flow MetricsTasktop
To remain relevant amid increasing market disruption, organizations have no choice but to compress their software delivery timelines to deliver features customers want, faster.
Frequently, tactical decisions are made to add people, invest in more tools, and increase the amount of work in teams’ backlogs without achieving the desired results. Agile transformations introduce methodologies and frameworks without the appropriate support mechanisms for success. To enable high performance and inform strategic decisions, organizations need a new foundation.
During this on-demand webinar, Tasktop Flow Framework Engagement Manager, Kristen Biddulph, presents how Flow Metrics provide that foundation, irrespective of methodology or framework, by surfacing end-to-end data on an organization’s flow of work, providing insights that will help them meet their goals.
Flow Metrics: An MRI of your Product Value StreamsTasktop
IT within large enterprises can span vast and complex business portfolios, with numerous external and internal-facing products and their domains. The delivery and maintenance of these products is supported by a network of tools, teams, technologies and processes, all with their own unique variants. The primary goal of the shift to a product-oriented model is to increase business agility and to satisfy the diverse and ever-changing needs of the customer. Organizations must react quickly to customer needs to accelerate the flow of business value from ideation to operation. However, the way the work is traced and measured is slowing down the time to value.
This lack of visibility makes it impossible to know if value is accelerating, time-to-value is getting shorter, waste is decreasing, value work is prioritized and whether demand is outweighing capacity. By automating and visualizing the flow of work and abstracting the end-to-end data across the toolchain underpinning your product value streams, you can get an MRI of your product’s health to help answer those questions and take informed action before it’s too late.
During this on-demand webinar, Tasktop Senior Flow Advisor, Laksh Ranganathan, presents how the Flow Framework™ and Flow Metrics can help organizations make work within product value streams visible and create a data-driven blueprint for scaled success across a portfolio of products.
Project To Product: How we transitioned to product-aligned value streamsTasktop
The project to product movement is quickly gathering speed - a recent Gartner report found that 85% of respondents are shifting to a product-centric mentality. However, the complexity and uncertainty of software delivery at scale, coupled with the sheer number of people involved in the process, is too much for traditional project management techniques. Motivation is not enough to achieve a successful transformation—the product-centric model requires new skill sets, different investments and a change in culture.
What does the shift away from project-thinking really look like?
During this webinar, Tasktop VP of Product Development, Nicole Bryan, combines our own journey with the experience of working with our enterprise customers, to paint a clear picture of the cross-organizational challenges in store - and how you can address them by:
- Adopting a “customer-first” mindset
- Appointing a Product Value Stream Lead and a Product Manager
- Implementing the Flow Framework™ to align the language of IT with the language of the business
Value Stream Architecture: What it is and how it can helpTasktop
Modern enterprises increasingly rely on software to keep the lights on and lay the foundations for long-term sustainable growth. Among many things, IT leaders are tasked with accelerating the time to value of their software delivery value streams.
But when asked, “Do you know what is slowing your software delivery teams down?”, why do IT leaders typically not know the answer?
Methodologies such as Agile and DevOps have been adopted to accelerate the time between build to deploy, yet the benefits are often only felt at a localized level (more sprints completed, higher number of deployments etc.) without a tangible link to business outcomes. Enter Value Stream Architecture.
During this webinar, Senior Value Stream Architect, Dan Feminella, presents:
- The business case for Value Stream Architecture
- Why your organization needs it in order to scale Agile and DevOps
- How to architect for end-to-end flow of business value from customer request to delivery and back through the customer feedback loop
Why Digital Transformations are Failing at ScaleTasktop
During this webinar guest speaker, Forrester VP, Principal Analyst, Diego Lo Giudice, and Tasktop CEO, Dr. Mik Kersten, present their research on why transformations are failing at scale and how a product value stream approach enables organizations to survive and thrive in the age of digital disruption.
How to Integrate Multiple Jira Instances to Improve Collaboration, Visibility...Tasktop
There is no denying that Jira has taken over the developer space. Most developers only want to use Jira, and many organizations are taking advantage of the flexibility of Jira by making it their single source of truth for all software delivery teams.
If Jira is your single source of truth, it’s easy to believe you don’t need to connect to the rest of your value stream. But what about when you have multiple Jira instances across Jira, Jira Cloud and Data Center? The truth is, in order to ensure cross-team visibility, traceability and overarching reporting, you don’t need to look past Jira for the need to integrate.
This on-demand webinar discusses and demonstrates why you need to integrate your Jira instances to:
- Increase collaboration and reduce informal handovers
- Automate information flow to enable traceability across multiple Jira system
- Seamlessly accommodate organization change (mergers, acquisitions, reorgs), minimizing team disruptions
- Centralize fragmented data in a reporting database to identify bottlenecks
Future proof your jira integrations and avoid api change panicTasktop
Does the Jira API change leave you vulnerable to disruption?
If you’re connecting Jira to the rest of your software delivery toolchain, Atlassian’s new approach to user identification could mean a major headache. What happens to all of the integrations you’ve set up when the API change goes into effect on April 29th?
Join Tasktop to learn more about what’s changing and see how you can keep product-critical data flowing between teams with Value Stream Integration.
Making Connections Visible: How to Defrag your Value Stream | Tasktop Connect...Tasktop
How many different siloes is your organization at the mercy of? How much time theft occurs from chasing down data in separate systems? Measuring performance is a challenge when work is disconnected.
Connecting missing links in the flow of work reveals the elusive big picture. This talk addresses the challenges of a fragmented value stream and provides guidance on how to improve your organizations performance with connectivity.
Dominica DeGrandis
Director, Digital Transformation - Tasktop
Dominica DeGrandis is Director of Digital Transformation at Tasktop, where she helps customers improve the flow of work across value streams. Responsible for introducing customers to flow-based aspects of digital transformation, she guides IT teams and business teams to understand and adopt new ways of working to improve performance.
Dominica is the author of “Making Work Visible: Exposing Time Theft to Optimize Work & Flow.” She is a huge fan of using visual cues to inspire change and spur alignment across organizations. She lives in Seattle with her husband and extended family. She blogs at tasktop.com and ddegrandis.com. Follow her on twitter @dominicad
Tasktop Connect 2018
connect.tasktop.com
www.tasktop.com
First Line Of Defense: How contractors can become software factories to suppo...Tasktop
2018 was a big year for the Department of Defense. The DoD Science Board put out a report with recommendations that represented a pivot in how the government wants to do business in the future. The goal is to get products and services out faster to the war fighter without sacrificing quality or increasing cost. Based on government research into successful programs they recommended the following:
Software Factory
Continuous Iterative Development
Risk Reduction and Metrics for new programs
Task PM’s with programs in dev, prod, and sustainment to transition
Build workforce competency
Software is Immortal specify software frameworks
Independent Verification & Validation for Machine Learning
Robin Yeman and Suzette Johnson will discuss how government contractors are getting ready to support the DoD in their mission. The development of the Software Factory will be key to success.
Robin Yeman, Lockheed Martin Fellow - Lockheed Martin
Suzette Johnson, NG Fellow - Northrop Grumman
Making Work Product-Centric: A Journey at Nationwide Insurance | Tasktop Conn...Tasktop
Over the last 18 months, Enterprise Digital at Nationwide Insurance experimented with an end to end agile approach to better integrate IT delivery and business activities in the commercial and mobile spaces. Customers are demanding products quicker, and we as a company must find ways to compress the timeline required to deliver the features customers seek to remain competitive. At the end of the second phase of this transition, which comprised just one team, we found a 64% decrease in lead time from discovery to analysis and a 20% decrease in lead time from analysis to implementation. This end to end model stressed co-location of business and IT and working together as one cross-functional team to continuously plan, integrate, and deliver value to our customers. We made the value stream work visible from idea to implementation and organized it in product-centric value streams with the goal of standardizing customer experiences regardless of whether the customer is interacting with our company via web or mobile. This standardization allowed for maximum reusability of requirements, code, and automation, and decreased variances with and the frequency of estimating. In the end to end model, poly-skilling was stressed across both roles and technologies so that all team members had the flexibility to pick up and work on any card at any point in the flow. This, coupled with the team’s use of the tools necessary to implement dev ops capabilities, allowed us to be more responsive to the customer.
Kristen Biddulph
Scrum Master, CSM, CSPO, CAL1 - Nationwide Insurance
Kristen has led software delivery teams over the last 4 years across Nationwide’s Digital assets for Sales, Identity Management, Servicing, and Mobile. Her current focus is on providing solutions to aid high performance teams in their product-centric journeys.
Tasktop Connect 2018
connect.tasktop.com
www.tasktop.com
Climate Science Flows: Enabling Petabyte-Scale Climate Analysis with the Eart...Globus
The Earth System Grid Federation (ESGF) is a global network of data servers that archives and distributes the planet’s largest collection of Earth system model output for thousands of climate and environmental scientists worldwide. Many of these petabyte-scale data archives are located in proximity to large high-performance computing (HPC) or cloud computing resources, but the primary workflow for data users consists of transferring data, and applying computations on a different system. As a part of the ESGF 2.0 US project (funded by the United States Department of Energy Office of Science), we developed pre-defined data workflows, which can be run on-demand, capable of applying many data reduction and data analysis to the large ESGF data archives, transferring only the resultant analysis (ex. visualizations, smaller data files). In this talk, we will showcase a few of these workflows, highlighting how Globus Flows can be used for petabyte-scale climate analysis.
Check out the webinar slides to learn more about how XfilesPro transforms Salesforce document management by leveraging its world-class applications. For more details, please connect with sales@xfilespro.com
If you want to watch the on-demand webinar, please click here: https://www.xfilespro.com/webinars/salesforce-document-management-2-0-smarter-faster-better/
top nidhi software solution freedownloadvrstrong314
This presentation emphasizes the importance of data security and legal compliance for Nidhi companies in India. It highlights how online Nidhi software solutions, like Vector Nidhi Software, offer advanced features tailored to these needs. Key aspects include encryption, access controls, and audit trails to ensure data security. The software complies with regulatory guidelines from the MCA and RBI and adheres to Nidhi Rules, 2014. With customizable, user-friendly interfaces and real-time features, these Nidhi software solutions enhance efficiency, support growth, and provide exceptional member services. The presentation concludes with contact information for further inquiries.
In software engineering, the right architecture is essential for robust, scalable platforms. Wix has undergone a pivotal shift from event sourcing to a CRUD-based model for its microservices. This talk will chart the course of this pivotal journey.
Event sourcing, which records state changes as immutable events, provided robust auditing and "time travel" debugging for Wix Stores' microservices. Despite its benefits, the complexity it introduced in state management slowed development. Wix responded by adopting a simpler, unified CRUD model. This talk will explore the challenges of event sourcing and the advantages of Wix's new "CRUD on steroids" approach, which streamlines API integration and domain event management while preserving data integrity and system resilience.
Participants will gain valuable insights into Wix's strategies for ensuring atomicity in database updates and event production, as well as caching, materialization, and performance optimization techniques within a distributed system.
Join us to discover how Wix has mastered the art of balancing simplicity and extensibility, and learn how the re-adoption of the modest CRUD has turbocharged their development velocity, resilience, and scalability in a high-growth environment.
First Steps with Globus Compute Multi-User EndpointsGlobus
In this presentation we will share our experiences around getting started with the Globus Compute multi-user endpoint. Working with the Pharmacology group at the University of Auckland, we have previously written an application using Globus Compute that can offload computationally expensive steps in the researcher's workflows, which they wish to manage from their familiar Windows environments, onto the NeSI (New Zealand eScience Infrastructure) cluster. Some of the challenges we have encountered were that each researcher had to set up and manage their own single-user globus compute endpoint and that the workloads had varying resource requirements (CPUs, memory and wall time) between different runs. We hope that the multi-user endpoint will help to address these challenges and share an update on our progress here.
Enterprise Resource Planning System includes various modules that reduce any business's workload. Additionally, it organizes the workflows, which drives towards enhancing productivity. Here are a detailed explanation of the ERP modules. Going through the points will help you understand how the software is changing the work dynamics.
To know more details here: https://blogs.nyggs.com/nyggs/enterprise-resource-planning-erp-system-modules/
Providing Globus Services to Users of JASMIN for Environmental Data AnalysisGlobus
JASMIN is the UK’s high-performance data analysis platform for environmental science, operated by STFC on behalf of the UK Natural Environment Research Council (NERC). In addition to its role in hosting the CEDA Archive (NERC’s long-term repository for climate, atmospheric science & Earth observation data in the UK), JASMIN provides a collaborative platform to a community of around 2,000 scientists in the UK and beyond, providing nearly 400 environmental science projects with working space, compute resources and tools to facilitate their work. High-performance data transfer into and out of JASMIN has always been a key feature, with many scientists bringing model outputs from supercomputers elsewhere in the UK, to analyse against observational or other model data in the CEDA Archive. A growing number of JASMIN users are now realising the benefits of using the Globus service to provide reliable and efficient data movement and other tasks in this and other contexts. Further use cases involve long-distance (intercontinental) transfers to and from JASMIN, and collecting results from a mobile atmospheric radar system, pushing data to JASMIN via a lightweight Globus deployment. We provide details of how Globus fits into our current infrastructure, our experience of the recent migration to GCSv5.4, and of our interest in developing use of the wider ecosystem of Globus services for the benefit of our user community.
Top Features to Include in Your Winzo Clone App for Business Growth (4).pptxrickgrimesss22
Discover the essential features to incorporate in your Winzo clone app to boost business growth, enhance user engagement, and drive revenue. Learn how to create a compelling gaming experience that stands out in the competitive market.
Navigating the Metaverse: A Journey into Virtual Evolution"Donna Lenk
Join us for an exploration of the Metaverse's evolution, where innovation meets imagination. Discover new dimensions of virtual events, engage with thought-provoking discussions, and witness the transformative power of digital realms."
Into the Box Keynote Day 2: Unveiling amazing updates and announcements for modern CFML developers! Get ready for exciting releases and updates on Ortus tools and products. Stay tuned for cutting-edge innovations designed to boost your productivity.
Listen to the keynote address and hear about the latest developments from Rachana Ananthakrishnan and Ian Foster who review the updates to the Globus Platform and Service, and the relevance of Globus to the scientific community as an automation platform to accelerate scientific discovery.
SOCRadar Research Team: Latest Activities of IntelBrokerSOCRadar
The European Union Agency for Law Enforcement Cooperation (Europol) has suffered an alleged data breach after a notorious threat actor claimed to have exfiltrated data from its systems. Infamous data leaker IntelBroker posted on the even more infamous BreachForums hacking forum, saying that Europol suffered a data breach this month.
The alleged breach affected Europol agencies CCSE, EC3, Europol Platform for Experts, Law Enforcement Forum, and SIRIUS. Infiltration of these entities can disrupt ongoing investigations and compromise sensitive intelligence shared among international law enforcement agencies.
However, this is neither the first nor the last activity of IntekBroker. We have compiled for you what happened in the last few days. To track such hacker activities on dark web sources like hacker forums, private Telegram channels, and other hidden platforms where cyber threats often originate, you can check SOCRadar’s Dark Web News.
Stay Informed on Threat Actors’ Activity on the Dark Web with SOCRadar!
Software Engineering, Software Consulting, Tech Lead.
Spring Boot, Spring Cloud, Spring Core, Spring JDBC, Spring Security,
Spring Transaction, Spring MVC,
Log4j, REST/SOAP WEB-SERVICES.
TROUBLESHOOTING 9 TYPES OF OUTOFMEMORYERRORTier1 app
Even though at surface level ‘java.lang.OutOfMemoryError’ appears as one single error; underlyingly there are 9 types of OutOfMemoryError. Each type of OutOfMemoryError has different causes, diagnosis approaches and solutions. This session equips you with the knowledge, tools, and techniques needed to troubleshoot and conquer OutOfMemoryError in all its forms, ensuring smoother, more efficient Java applications.
In 2015, I used to write extensions for Joomla, WordPress, phpBB3, etc and I ...Juraj Vysvader
In 2015, I used to write extensions for Joomla, WordPress, phpBB3, etc and I didn't get rich from it but it did have 63K downloads (powered possible tens of thousands of websites).
2. ddegrandis.com @dominicad
• Flow metrics are tied to business value
• Flow metrics are based on outcomes
• Flow metrics provide a feedback loop to improve decisions
WHAT’s THE POINT?
3. ddegrandis.com @dominicad
1. Flow Time – a measure of speed
Flow Time:
The duration
from when work
enters the value
stream to its
completion.
4. ddegrandis.com @dominicad
90th percentile filtered
on business requests
Measuring Flow Time helps with predictability
date
Percentiles
answers Q:
“What’s the
probability of
completing
work in x
days?”
Inspired by Troy Magennis http://focusedobjective.com/team-metrics-right/
5. ddegrandis.com @dominicad
Look at Flow time
How fast? Flow Time
date
Unplanned
work delays
Planned
work
Inspired by Troy Magennis http://focusedobjective.com/team-metrics-right/
.
What we
measure
impacts people
b/c people
value what is
measured.
6. ddegrandis.com @dominicad date
2. Flow Velocity – a measure of productivity
Flow Velocity:
The number of
items
completed
during a given
time frame.
7. ddegrandis.com @dominicad date
FV trend over time provides data for teams to see delivery rates
Question:
Does Flow
Velocity
improve
with faster
Flow Time?
8. ddegrandis.com @dominicad
Dominica DeGrandis
Thief Unplanned Work
Transaction costs:
Low for a one-time 6 month supply
High for a one day supply.
Knowledge work is perishable
Consider Reducing Batch Size
9. ddegrandis.com @dominicad
Dominica DeGrandis
Thief Unplanned Work
Unplanned Work: Interruptions that prevent you
from finishing something or from stopping at a
better breaking point.
Unplanned Work is a time thief b/c
unplanned work usurps planned work
@dominicad
While economies of scale can reduce costs in manufacturing,
software is a different story.
Two things to consider:
• Transaction cost
• Holding cost
10. ddegrandis.com @dominicad
3. Flow Efficiency - a measure to expose wait time
Flow Efficiency:
The percentage
of time where
work is in an
active state vs. a
wait state.
13. ddegrandis.com @dominicad
“Things take too long” is a universal problem
work request
How many get work intake
requests via email?
Disconnects in communication
interferes with collaboration
& delays delivery
14. ddegrandis.com @dominicad
4. Flow Load – a measure to balance demand & capacity
Flow Load:
All the partially
completed work.
All the work-in-
progress (WIP)
in the value
stream
16. ddegrandis.com @dominicad
Dominica DeGrandis
Thief Too much Work-in-progress (WIP)
High WIP means that
other items sit waiting for
service longer.
The single most important
factor that affects queue
size is capacity utilization.
17. ddegrandis.com @dominicad
Dominica DeGrandis
Thief Too much Work-in-progress (WIP)
Queuing Theory allows us to
quantify the relationship between
wait times and capacity utilization.
Wait times increase exponentially
as utilization approaches 100%.
Queuing Theory: Applied statistics that studies waiting lines
If the goal is speed,
consider managing work by queues.
http://reinertsenassociates.com/books/
18. ddegrandis.com @dominicad
Dominica DeGrandis
Projects and tasks that compete with
each other.
Conflicting Priorities is a time thief b/c
people take on too much WIP when
priorities are unclear.
• Visualize WIP
• WIP limit as enabling
constraint
• Primary factor of speed
is the amount of WIP
Set WIP Limits to balance demand against capacity
19. ddegrandis.com @dominicad
5. Flow Distribution: a measure to make tradeoffs clear
A decision to do one thing is a decision to delay something else.
The proportion of
work items in a
value stream,
adjusted depending
on the need to
maximize business
value.
21. ddegrandis.com @dominicad
Sample Value Stream Dashboard
Project to Product: How Value Stream Networks Will Transform IT & Business
(Mik Kersten) https://itrevolution.com/book/project-to-product/
https://go.tasktop.com/DevOps-Enterprise-Summit-Las-Vegas-Speaker-Presentations.html
23. ddegrandis.com @dominicad
6. A metric to gage happiness
“How likely are you to recommend working for this company to a friend?”
Safety Example Q’s:
• On my team, failure causes inquiry and not blame.
• Our leadership is open to hearing bad news.
• In my org, failures are learning opportunities and messengers are not punished.
@nicolefv https://www.youtube.com/watch?v=avauW5FAWCw
promoterspassivesdetractors
25. ddegrandis.com @dominicad
7. Change Failure Rate (CFR)
Answers the Q: What % of changes to prod fail?
CFR = # of failures / total # of work items completed
Ex: 60 items completed in
Dec, 20 of them resulted in
a defect. Dec CFR is 33 %.
Failure - a change resulting in an
outage or degraded service where
hotfix, rollback or patch required.
27. ddegrandis.com @dominicad
Change Failure Rate – a measure of Quality
Change Failure Rate
# Failures
# total done items
date
Oh - ok – I
see what
you mean!!!
What we
measure
impacts people
b/c people
value what is
measured.
28. ddegrandis.com @dominicad
53,308 security incidents, 2,216 data breaches,
2,216
https://www.verizonenterprise.com/resources/report
s/rp_DBIR_2018_Report_execsummary_en_xg.pdf
Allocate
capacity
for
security
29. ddegrandis.com @dominicad
WHAT’s THE POINT AGAIN?
• Flow metrics are tied to business value
• Flow metrics are based on outcomes
• Flow metrics provide a feedback loop to improve decisions
30. ddegrandis.com @dominicad
MIK KERSTEN
CEO & Co-Founder
Tasktop
SUZETTE JOHNSON
Agile Center of Excellence Lead
Northrop Grumman
ROBIN YEMAN
Lockheed Martin Fellow
Lockheed Martin
MARK FORD
Lead Developer, TIAA
Community Director, Vivit
KRISTEN BIDDULPH
Certified Agile Leader
Nationwide Insurance
KYLE WILLIAMS
Manager
Deloitte
DAVE WEST
CEO
Scrum.org
DOMINICA DEGRANDIS
Director, Digital Transformation
Tasktop
JEFF ZAHORCHAK
Manager, Enterprise Applications
Select Medical
NICOLE BRYAN
VP, Product
Tasktop
FABIO ECHAVARRIA
Senior Consultant
Deloitte
CARMEN DEARDO
Senior VSM Strategist
Tasktop
Register at:
connect.tasktop.com
31. ddegrandis.com @dominicad
Email: dominica@SendYourSlides.com
Subject: flow
To receive:
• copy of this presentation deck
• excerpts of Making Work Visible
• Tasktop video on JIRA/SN tool
integration
• Forrester article: Agile-Plus-DevOps
With Value Stream Management
• IT Rev paper: Overcoming
inefficiencies in work mgmt. systems
Editor's Notes
Today – going to describe, explain, clarify 5 flow metrics – what they are, why they matter, how you measure them, how you game them and what benefits they can offer you.
_______________________
When it comes to assessing an IT transformation (such as Agile and DevOps), performance metrics have come under intense scrutiny. Traditional performance metrics, such as counting the number of lines of code and the number of software bugs should be used with caution, because there are bugs that are not worth fixing and code that is not worth maintaining. These old-school performance metrics represent activities, not outcomes. To visualize and optimize the business value of your software delivery, you need to find a way to measure business outcomes. To do that, we need flow metrics.
During this webinar, Dominica DeGrandis will present five key flow metrics that reveal trends on desirable business outcomes – such as faster time-to-market, responsiveness to customers, and predictable release timeframes – and explain how to implement them at your organization to measure and improve the impact and value of software products on your business.
We have no lack of data collection & info visualization approaches at our disposal.
The problem is that at the biz level, there’s no compelling set of abstractions for what to visualize.
Contrast this avail telemetry w/ teams practicing DevOps – they know their MTTR & Chg success rates that helps them to identify opportunities to improve.
Look at dev teams, using scrum/kanban boards – they can make their WIP visible across the entire team, to help them see if teams are overloaded or not.
It’s the biz-level visibility that orgs lack. This is what flow metrics provide, b/c tied to biz value.
Flow metrics bring visibility to outcomes. Ex: Oh - only feature work got done last month – didn’t fix any tech debt.
Oh - and that feature was delivered 1 week later than big customer expected.
Outcome-based metrics provide a feedback loop to improve decisions.
Should we allocate more capacity to fix tech debt next month?
Or should we continue to allocate teams to do more features? Don’t know – depends on the strategy and context of the org.
But these are the kinds of important Q’s that Flow metrics provoke.
IT can provide biz leaders w/ metrics to better understand the tradeoffs from decisions they make.
If we go another release w/o fixing any tech tebt, what might that do to the happiness factor of our employees?
It’s important to note that Flow metrics use language that both IT and biz ppl can understand.
TRANS: Like time – “When can big customer use this feature?” That’s a speed Q.
Which brings us to our 1st flow metric – flow time.
__________________
Flow time is a measure of speed.
Flow time is the duration, the elapsed time it takes from when work enters the VS to when it’s considered done, which might be diff between different VSs. 1 team might consider something done when it’s delivered to the customer. Another team might not consider it done until the value derived from the change is determined 3 months later. It depends.
This viz shows 3 diff types of speed measures, DLT, FL, LT.
LT is measured from when a customer 1st made a request. This is the time customers care abt.
DLT is measured from code commit to done – this is the time metric you’ll find in the Accelerate book by Nicole Forsgren and company. A good measure to see how your delivery pipeline automation is improving (or not). It measures the right side of the VS.
FT is a term I started using 3-4 yrs ago? I didn’t make it up – it’s been around since John Little proofed out Little’s Law, in 1960’s.
I just got tired of hearing people go to war over twitter & at the Lean kanban conferences on CT & LT.
CT is an ambiguous term. Has multiple definitions depending on context (manufacturing or software).
So, in my workshops while helping ppl MWV, find bottlenecks & optimize their workflow, I thought, just start the clock where it makes sense to in your context. This is your VS – at what point do you want to the clock to start? Learned that many Product Owners /biz ppl were interested in how long it took to do something once they decided that it would be a good thing to do.
Which is what you see in this illustration – Once ppl decide, Yes, let’s do this!
So, that’s why I started using Flow Time when talking abt speed metrics in general, b/c it starts the discussion on what timeframe is most important to measure for your org. Also, Flow is attuned with Lean & kanban –I’m a big kanban fan. Flow is a pillar of Lean.
Define FLOW: Flow is value pulled thru a VS smoothly & predictably. Flow is 1st way of DevOps “DevOps relies on bodies of knowledge from Lean, Theory of Constraints (study of bottlenecks)
Enough abt what Flow time is. Why do we measure it?
__________________________
“DevOps relies on bodies of knowledge from Lean, Theory of Constraints, the Toyota Production System, resilience engineering, learning organizations, & human factors.”
For a number of reasons. 1. B/c ppl complain that things take too long. If want to improve that, then measure to see how long, and if indeed way too long, measuring Flow time trends over time shows you if things are improving (or not).
It’s useful to test opinions against data.
This is a run time chart used to capture flow time. Vertical axis is # of days to complete a work item. Horizontal axis is date work completed. 4 week ins Sep. Legend on right. The charts shows flow time of rev gen work – features completed. Also shows which items generated some failure – call that failure demand. Can see that the 1st two weeks of Sept, work completed in 10 days or less. Then in week 3, FT increases to 15 days. Wk 4 FT jumps up to 20 days.
So seeing this data, should prompt discussion on why things took longer to complete toward end of the month.
We don’t know why from looking at this data – but it’s prompts the Q, “What happened?” to start learning more.
It also helps set expectations for how long things might take next month. This small blue dots show the 90th percentile.
In other words, based on this Sep data, 90% of the time (9 times out of 10) feature requests take no longer than 20 days.
If you use the 50th percentile, you get the avg, which makes your estimates wrong – at least 50% of the time.
Book called “The Flaw of averages” – opening cartoon is picture of 6 ft tall statistician drowning in lake with an average depth of 3 ft.
Percentiles answer Q…… Well, FT metrics shows you just that. Depending on your tool functionality, configure settings or filter on different percentiles to help you be more predictable.
Trying to be approx. right instead of exactly wrong.
TRANS: We don’t have the whole story here. There’s something else going on.
______________________________
Focus on capabilities, not maturity levels
Ppl said things take too long – useful when ppl complain [..]
As bld engr, used to rant, no auto testing! But then measured CT.
Blew me away. Ppl listened, budget, headcount, empathy,
And that’s unplanned work (yellow trianges) & revenue protection work dots inside circles (security vulnerabilities, patches, maintenance, KLO)
If 3 emergencies pop-up 1 week, then planned work likely delayed. Thief Unplanned work sneaks in and steals time away from planned work – purple arrow.
If tracking unplanned work, then it will show up in this chart.
Keep in mind that “What we measure impacts ppl, b/c…..” Tell me how you measure me….
Merit review is based on LT target. Trying to game metrics by excluding weekends.
How gamed? 1. Exclude weekends 2. Only pull small simple work items into WIP.
Have discussions with your teams on how ppl will game your metrics – useful, interesting exercise to bring transparency to the reality of the situation.
To sum up FT benefits, b4 moving on, FT
helps ppl understand why work was delayed, can see what else competes w/ planned work.
Helps ppl understand time-to-market for completing items, and look for ways to reduce unnecessary steps & waste.
TRANS: This chart btw is part of an exercise I created and will give you a link to. It wasInspired by Troy Magennis/Larry Maccherone, “Doing Team Metrics Right,” Focused Objective
blog
TP – how measured, why measured (productivity measure)
This is your TP. Answers Q , “How many WI’s got done?” TP totaled at the top of the chart in green.
Here 7 WI’s finished 1st week, 3 on wk 2, 3 on wk 3 and 4 on wk 4.
Why do we measure it?
TRANS: Tracking FV trend over time provides historical data for teams to see delivery rates.
This can help teams improve estimates/forecasting how much work they can deliver.
FV gets gamed by breaking down work into smaller bits – which may not be a bad thing – show you why in a min.
You can experiment w/ the relationship between FT & FV. Q…””? Or does FV diminish when FT increases?
If capturing & visualizing these flow metrics, then can see possible correlation. We only delivered 3 feature work items this week and it took 5 days longer than previous week. It’s not so easy to detect this kind of info in a spreadsheet. Leave the spreadsheets to the accountants and start making your metrics visible in a way that is easy for the human eye to comprehend.
TRANS: Here’s why breaking down work items into smaller bits may not be a problem. In fact, why you may want to consider reducing batch size.
______________________________
Bringing visibility of problems & risks to the table provokes necessary conversations that enable change.
Imagine shopping for bananas.
If you buy 6 mon supply of bananas, transaction cost is low, but most of the bananas will be rotten within 10 days, so waste money.
If you buy 1-day supply of bananas, they won’t rot, but transaction costs are high b/c have to go grocery store every day.
TRANS: Somewhere in between is the right batch size.
2 things to consider. Transaction costs & holding costs.
In knowledge work, holding costs go up w/ lg batch sizes b/c delays fr dependencies, late feedback, code merges.
Lg deployments have high holding costs b/c software not realizing value yet. Corn flakes still sitting on the shelf.
It’s diff w/ manufacturing. Transaction costs go down w/ large batch-size projects like book publishing – don’t print just 1 book.
Assumptions abt economies of scale rarely apply to software dev.
TRANS: A small quick deploy goes a long way toward a speedy recovery, which is why managing by VS is the better way to go. Project oriented management models incentivize lg batch size b/c of the capitalization of software development.
How measured – see equation
Why we measure it - b/c helps team see just how much wait time in the system & make decisions to do something abt it.
Much of flow time is simply wait time. You are lucky if your FE is > 15%. 5% is common.
Often, the emphasis is on estimating how long things will take – assuming no interruptions or dependencies..
Flow efficiency needs wait states in your workflow design – otherwise very hard to track them.
For ex: walk thru this board…..backlog (options), might do them, might not – 1 reason start FT clock later – b/c might not ever get to stuff in the backlog. Then investigate – How much design capacity there is?, what’s the capacity of design team? prioritize it against the other 100 requests, before it moves into Dev. Whatever the states in your VS, FE requires you to identify when work sits idle – waiting. This is a challenge for a lot of tools – except for real kanban tools.
_____________________________________
In Viz – in jira – if take a jira item, if card is in new or in progress, tt will record that. In Viz, can say that something is an active state.
We can map their wait states to Viz.
In Hub, would need to do some ETL to do the same thing.
Same as LK functionality – where wait states are aggregated to calc FE
Some tools allow you to set a work item to blocked, but it throws all blocked items into one queue to the right of the board, so you lose visibility of which state the work was in when it got blocked. It’s better than nothing, at least ppl know work is in a wait state.
“Blocked” word reaction….
If wait state is one common area – then can’t measure individual start & finish dates for each queue. (CT).
So – consider when you design your kanban boards – Where is your bottleneck – it will likely have a big wait queue in front of it – but if all the work in waiting is moved to the right, then diminishes the benefit of visualizing the bottleneck.
Benefit of FE: helps team see the wait in the system & where work get stuck. Can visualize bottlenecks and so you can do something abt it.
And don’t fret if you or your friend are the bottleneck – you can begin to get the help you need. When I managed the build & release team at Corbis, we didn’t have automated testing and it took a long time to do manual smoke tests – especially when functionality was broken. Once I shared metrics with mgmt., I got budget & headcount.
The handoffs aren’t as clear or clean as they should be.
Details lost in email. “impacts communication & collaboration & delays delivery.
Things take too long is a problem every company grumbles abt.
How measured – All the partially completed work – all work in system, in paper post-it notes, unplanned work.
Why measured? – WIP is the primary factor of all speed metrics. FT = WIP /TP (FV) – little’s btw.
WIP is a leading indicator.
_____________________
WIP balance of demand vs. capacity
MTTR, velocity LT, CT, TP – all trailing indicators.
High WIP levels means that other work items sit waiting for service longer, like this freeway.
Only so many vehicles fit on the road.
Freeways clog up & slow way down when at full capacity.
The more cars, the longer the commute.
Same thing with Computers - stop responding..
Loading ppl to 100% capacity..
The higher the utilization, the longer the wait – esp in areas of high variability areas - like IT – so much unplanned work, and conflicting priorities and dependencies – all the time thieves.
TRANS: THE SINGLE MOST IMPORTANT Factor that affects wait time (queue size) is WIP.
When we look at the math, can see that wait times increase exponentially when utilization approaches 100%.
QT is what allows us to quantify relationship between [..] Something that Gantt charts aren’t especially good at, b/c don’t consider the wait & blocked times that occur when ppl are allocated at high levels.
Keeping ppl busy all the time isn’t efficient or effective – b/c CP - ppl overbooked.
TRANS: This is the problem with high utilization levels —important work takes longer & flow time increases because people aren't avail.
Teams rarely work in isolation. If a skillset is needed from a different team, then hand-offs between the two teams occur. A developer wonders, “Are there unknown vulnerabilities in this code?” while waiting on feedback from a security expert. But the security expert is busy discovering how someone hacked into the now unsecure database. A question waits on input from a database architect: “Is the data in the test environment wrong? Can they please check it out?” But the database architect is busy helping the security expert. When you are the only one on the team with a special skill set, you can be a bottleneck pulled in many conflicting directions. Expert skills in high demand are often unavailable when you need them.
When look at work like this, can see million incoming requests.
Can see competing work items - can see security vulnerability fix not done.
How WIP is gamed – work done under the table – invisible work – really not done cause going to finish it over the weekend.
Benefit – WIP limit is enabling constraint.
How measured, Why measured – balance necessary work.
A decision to do one thing is a decision to delay….
Benefit can begin to see how work is allocated.
How gamed – see “More on Flow distribution”
Depending on context, may want to chg it up.
If you do more feature work, you can’t expect that it won’t take away from doing risk work.
Biz and IT need to understand this.
TRANS: If categorize work items, can visualize them in progress, use WIP limits to allocate capacity.
Make tradeoffs clear – set strategic direction with Flow Distribution
Could show diff WIP by work type distribution
In this example, WIP limits are used to allocated capacity to fix debts. Can have 3 team improvements and where on the board.
If team has capacity to work on 14 things at a time, and situation prioritizes fixing debt & defects, then feature & risk work should be reduced. If keep working on features, then you put defects and debt work at risk.
TRANS: A decision to one thing is a decision to delay something else. Help others see the impacts of conflicting priorities across Team/org.
___________
Diff schools of thought on def of defect
In my experience, metrics have been invaluable to get leadership agreement & buy-in, I used to rant. Then I showed metrics and got budget and headcount. If you want to convince others suffering from misconception, useful to test their opinion against the data. Ppl listen to data – it helps with credibility.
They help you become the voice of reason in the org. Someone is going to influence boss.
If measure an activity metrics like LoC, then ppl write a lot of code, when maybe a 10-line solution is better than 1000-lines. Ideally, we should reward devs for solving biz probs w/ min amt of code – or no code! Rewarding devs for writing LoC leads to bloated software that incurs high maint costs & high costs to change.
The standard statement for NPS is normally, “How likely are you to recommend working for this company to a friend?”
We use it measure employee happiness at Tasktop. Not customer happiness, but employee happiness.
Also used from a DevOps perspective to measure safety
Examples:
On my team, failure causes inquiry and not blame.
Our leadership is open to hearing bad news.
In my org, failures are learning opportunities and messengers are not punished.
People on our team trust one another
Query your ticketing tool or work flow process system – show all …for 30 days
Turn this into leading indicator by comparing age of work with avg age of that work type distribution
Diff schools of thought on def of defect. Why “Failure”.
Quality is difficult to measure. CFR takes a decent stab at it. It answers Q… It’s a ratio – calculated by dividing # of failures by the total number of work items completed. Failure defined as a change that caused an outage where hotfix, rollback or patch needed, or some degraded service. In this example [..]
TRANS: CFR matters b/c DevOps is shooting for “world-class quality”.
Here are some failures on the right side of the screen. Might recognize some of these companies.
For ea event celebrated in the press, 100’s more that we don’t hear abt.
It’s not surprising that your systems sometimes fails. Dr. Richard Cook (works in area of resilience engineering, say’s that it’s surprising our systems work at all.
TRANS: Failures are inevitable.
Easy to calc once you have TP. Note failure demand in pink. FD is work done b/c of error (degrated service, SQL server went down)
Now, this begins to tell story. CFR trending up, TP up, FT increasing? The experiment provides link between seeing & relating that opens the door to new understanding. Looking at this diagram is less threatening – “Oh, I see where you’re coming from”
The data becomes the thing to change, not “Them”.
TRANS: Licensed under Creative Commons Attribution share alike.
.
complicated threat landscape
Medical info worth > credit card #s b/c can buy pharmaceuticals, make claims, takes time to discover…
"Teams are not paid to deliver software, they are paid to deliver impact from which value can be derived." https://hamletarable.com/2018/10/06/impactmetrics/ … @hamletarable Paul Shepheard
Flow metrics bring visibility to biz outcomes. Are we more predictable this qtr than last qtr?
What’s the probability of delivering a new feature when needed?
There’s a desire to look at real biz outcomes over activity based metrics such as # LoC
Biz ppl don’t care abt Story points or containers or kubernetes.
They care abt – did customers get the changes they needed when it was promised to them? Is this change going to generate revenue or protect revenue? How can we be more predictable?
Tasktop Connect is the best place to connect with software delivery pros.
Speaker lineup includes Lockheed Martin, Northrup Grunman, Nationwide,
TIAA, Deloitte, Select Medical, Scrum.org and Tasktop.
Tasktop Connect 2018 - Tasktop's 2nd annual conference on Thursday, Dec 6th at the Knight Conference Center at the Newseum in Washington DC.
There will be talks from Tasktop customers (Lockheed Martin, Nationwide, Select Medical, TIAA, and others) on their transformations - how they scale initiatives across their value streams.
Other talks:
Mik on Flow Framework
Carmen on how to Apply Flow Framework to your Value Streams
Yours truly on Flow Metrics.
It's a way to meet & talk with other enterprise IT leaders, and we'd love to see you there.