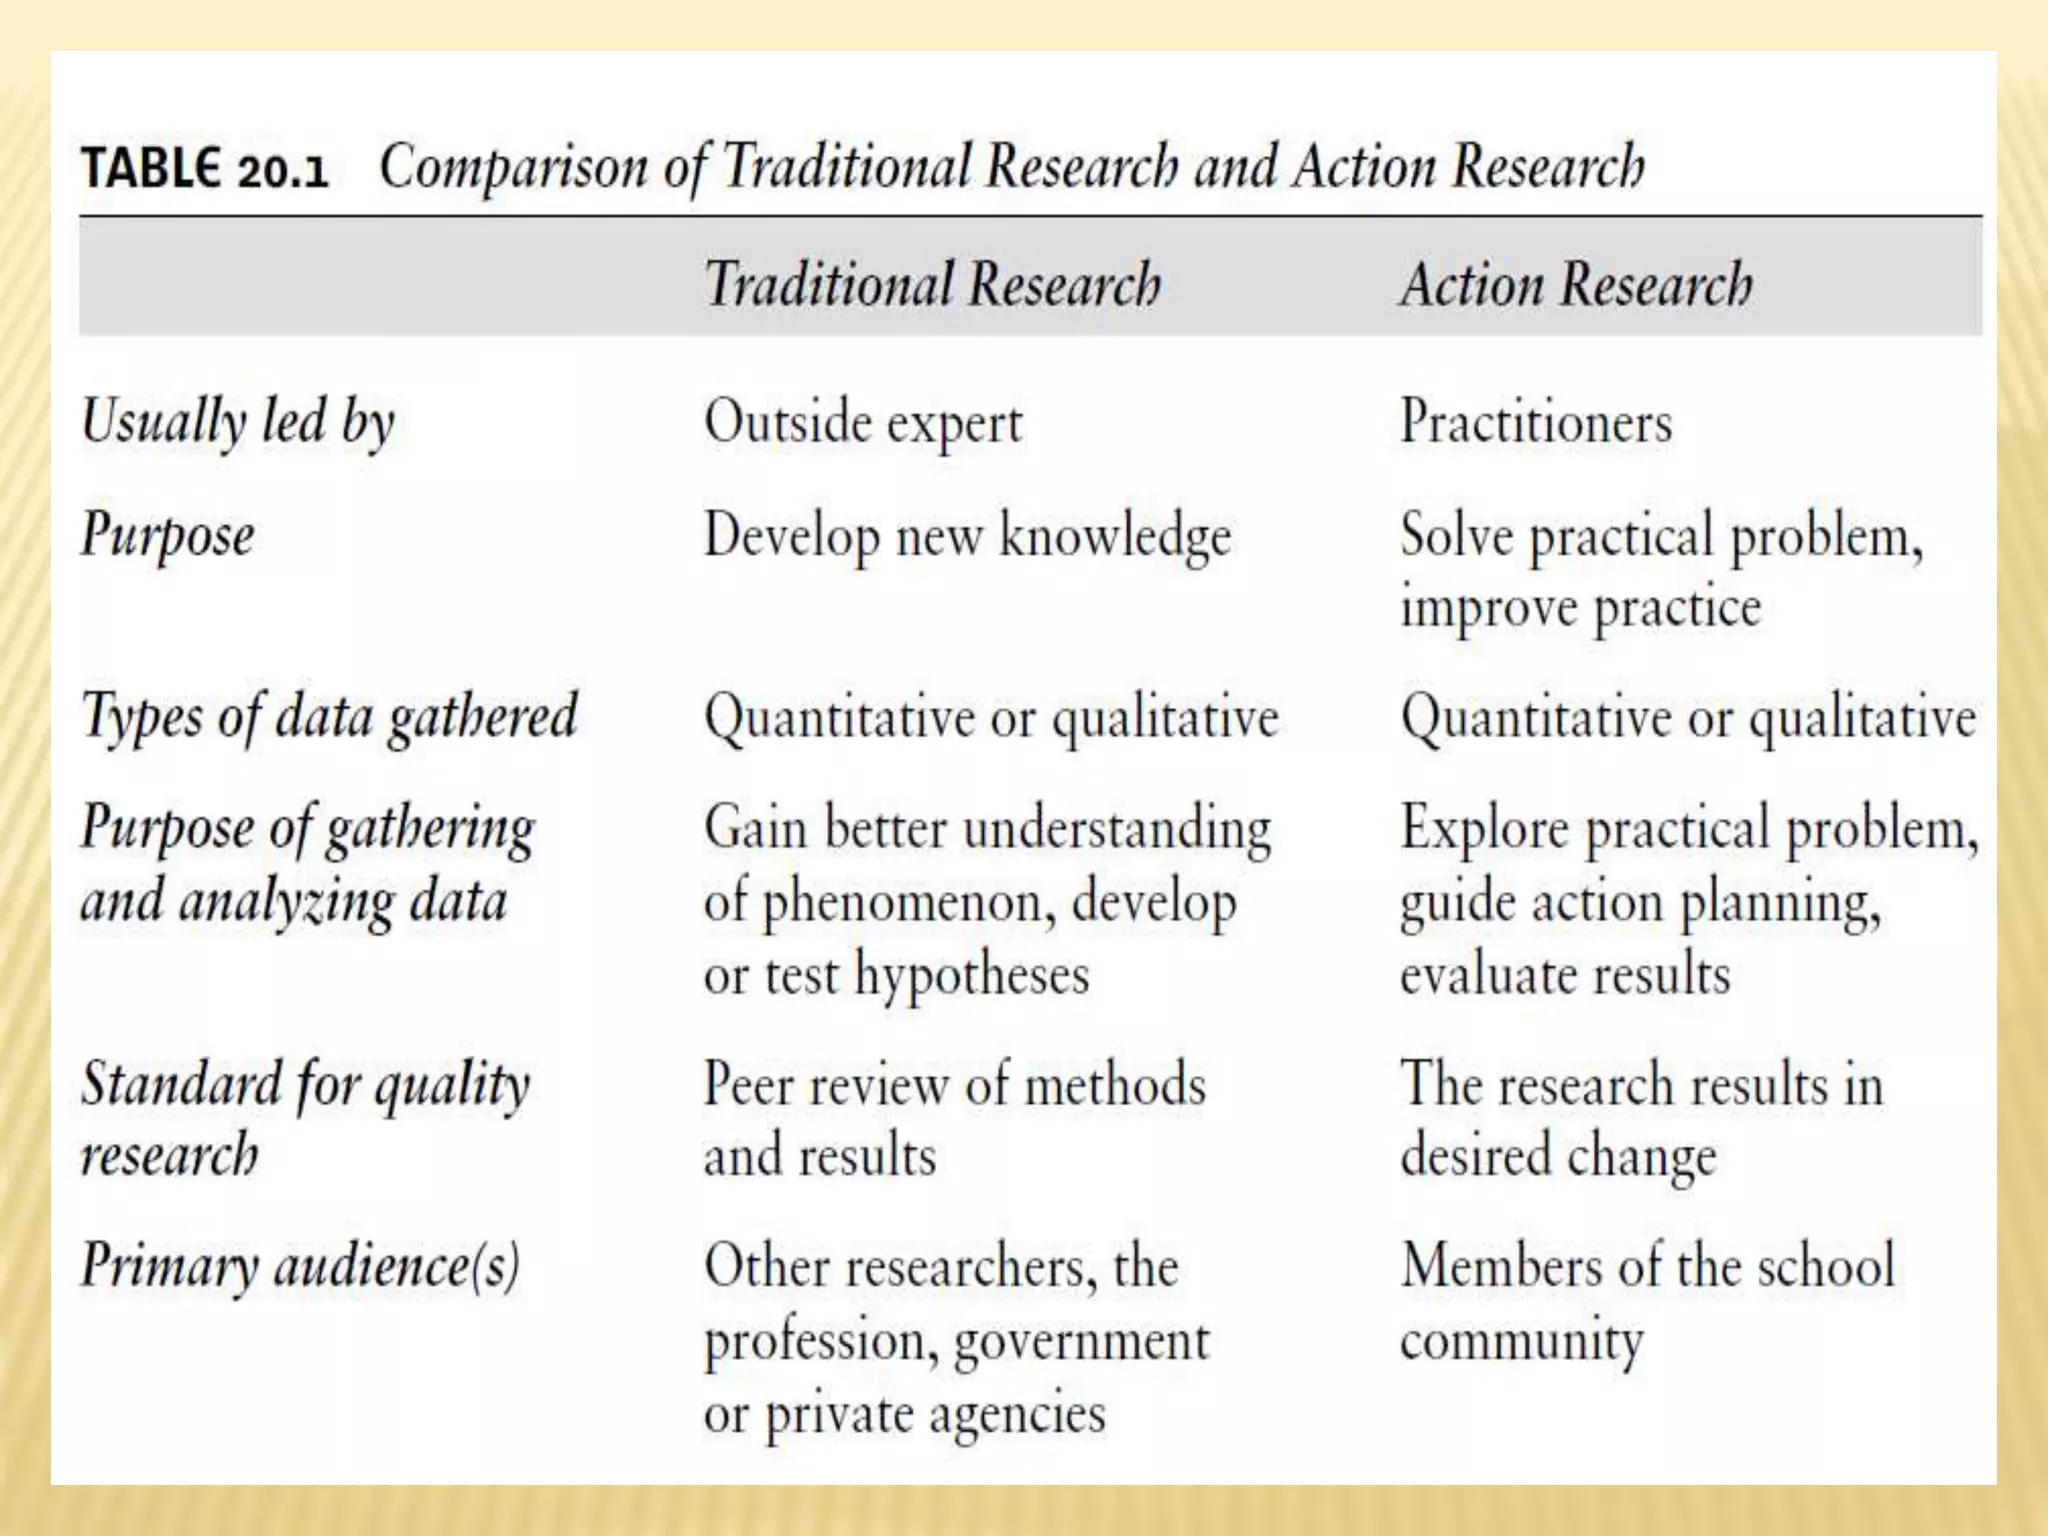
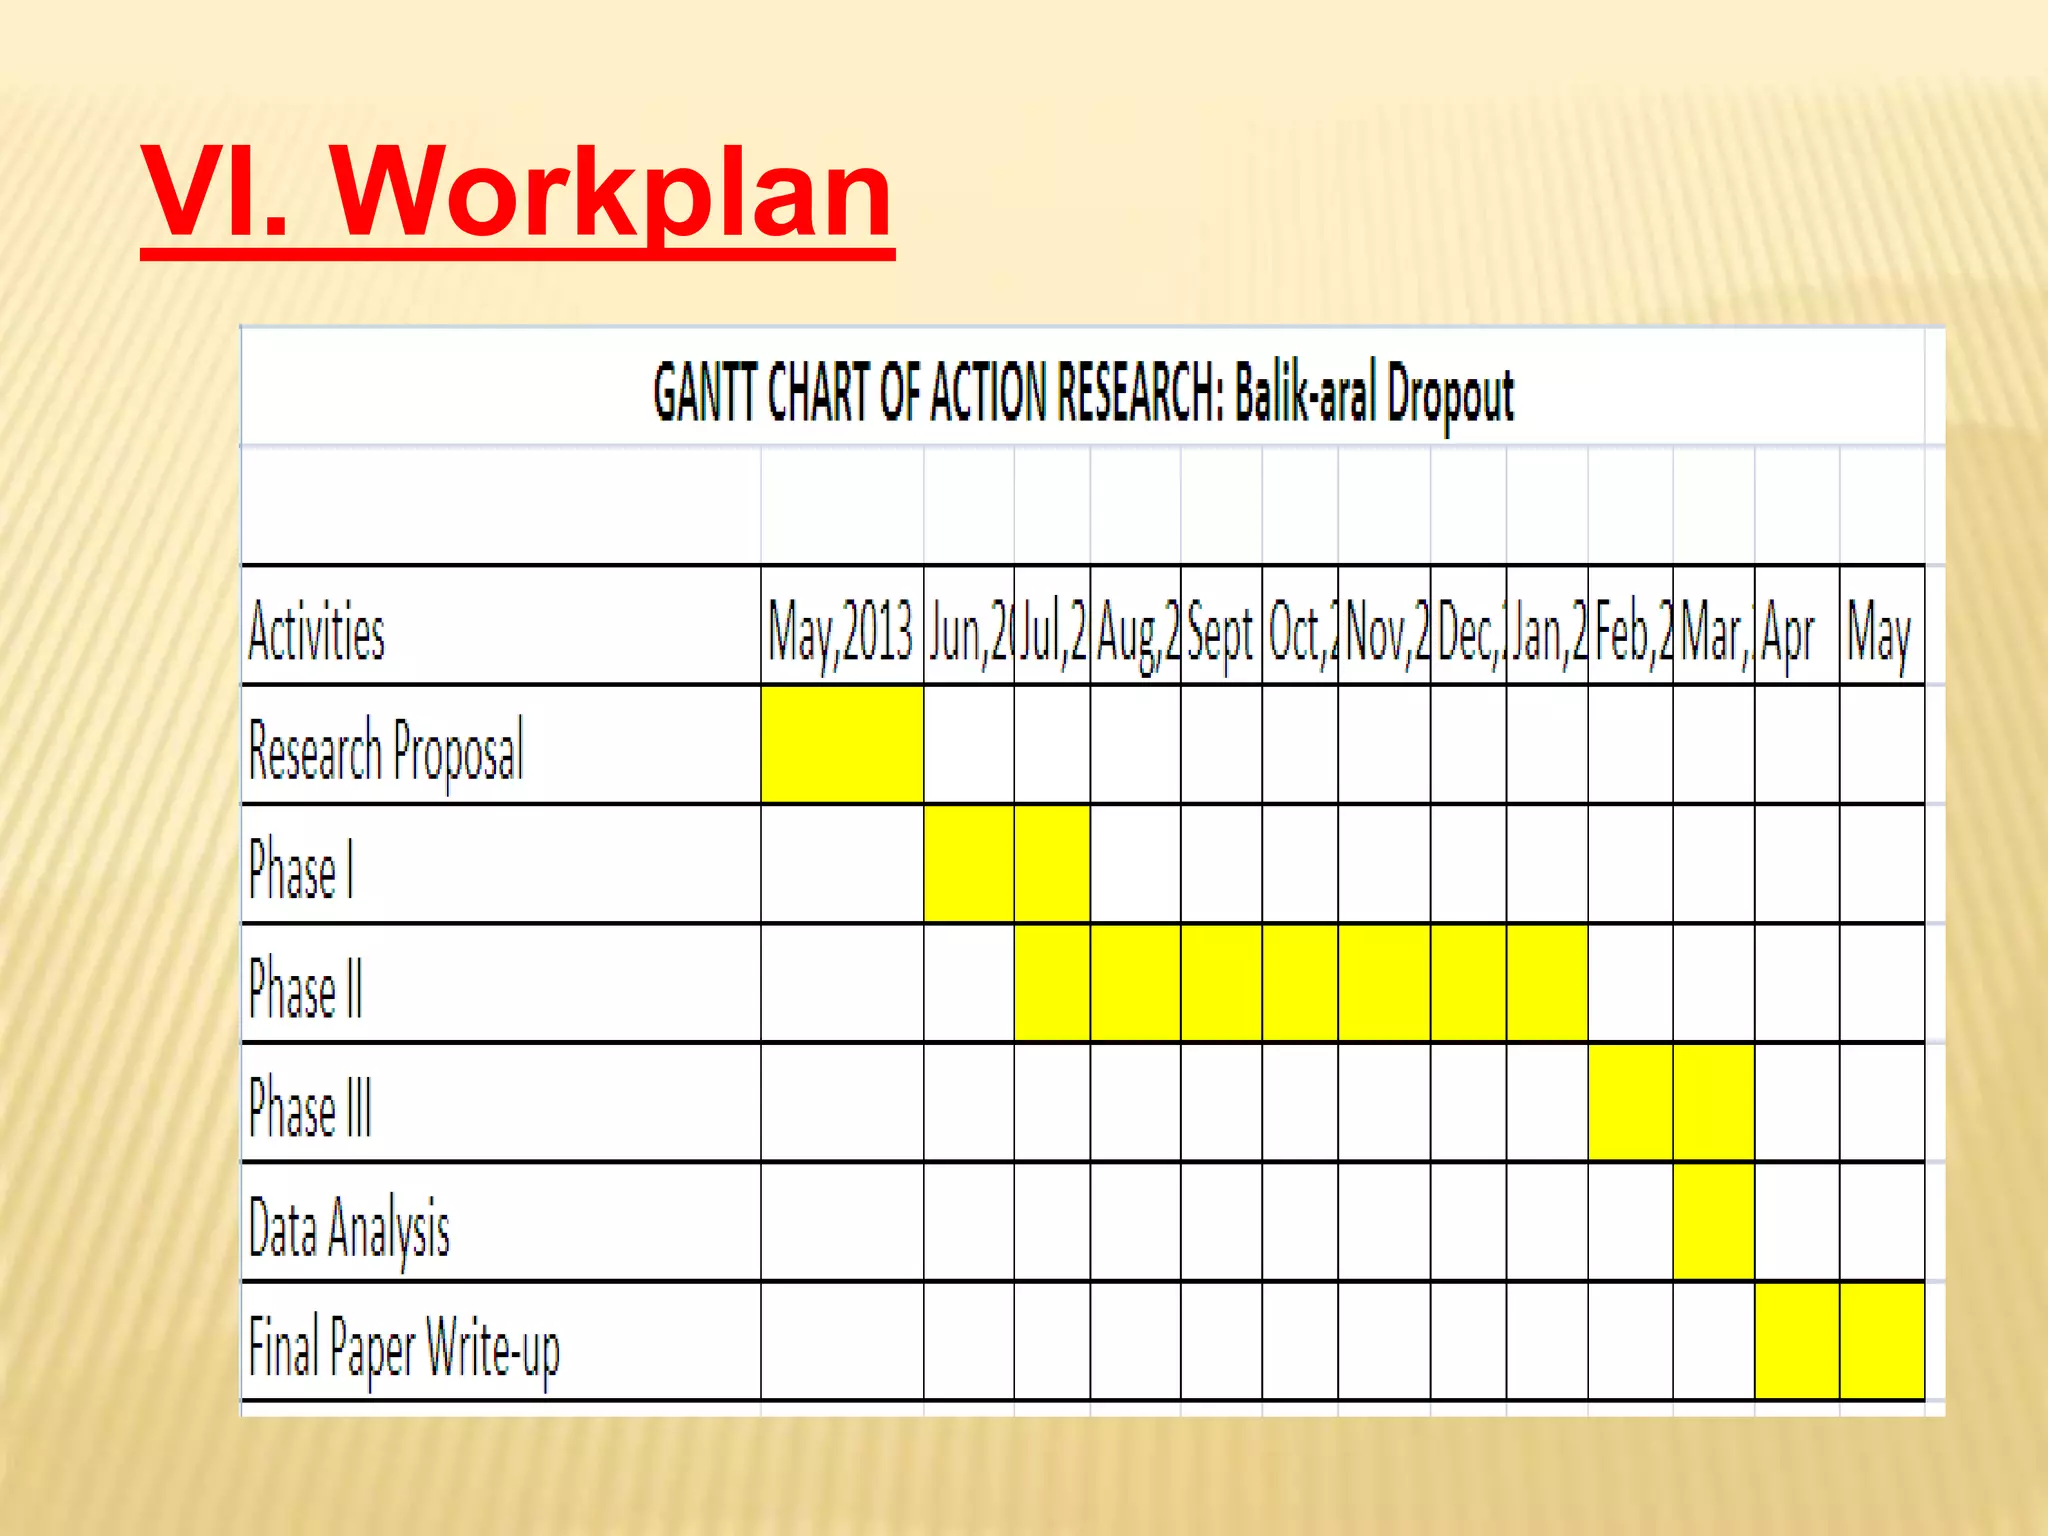
Adapting to Educational
Challenges through
Action
ResearchJohn Lou S.
Lucenario
SIMPLE EXPERIMENT: HOLD ANYTHING AS
YOUR CELLPHONE, AND ACT AS IF YOU’RE
CALLING SOMEONE.
Republic Act 9155, Chapter I,
section 7, states that
Department of Education
(DepEd) is mandated to
“undertake national research
and studies” as basis for vital
policies for economic
development.
BASES
• Department Order No. 24 s.
2010( Basic Education
Research Fund-BERF)
• DO No. 43, s. 2015(Revised
BERF)
• DO No. 16, s. 2017 (
Research Management
Guidelines)
BASES
Action Research
DefinedA process of
systematic inquiry to
improve educational
practices or resolve
problems in classrooms
and schools.
Why AR?
• Be a living hero
• Be heard by officials
• Present in greater audience, like
in conferences
• Higher maximum points (4%
innovation, 4% awards, 4%
research, 4% speakership and
4% authorship) than IPCRF
(35%/3=11.67)
Why
?
Analysis of Data from Returning Drop-out
High School Students: A Basis for
Implementation of Drop-out Reduction
Program
By John Lou S. Lucenario, Nelia Ong
and Jocelyn Casino
School
Factor
Culture of Research
THE RESEARCH PROCESS
•To help figure out
what works
•To provide rationale
•To pursue a study
LITERATURE REVIEW
Researchable or not?
Themes: Basic Education
Research Agenda
• Teaching and learning
process
• Governance
• Child protection
• Human resource
development
• Inclusive education
• Gender and development
EXPERIMENT
•Sustain your interest
•Within your range of
competencies
•Manageable in size
•Significant to society
THE RESEARCH PROBLEM
Guro’t Bayanihan (Teachers
Communal Unity) as (Result-based
Performance Management System)
RPMS-based Collegiate Mentoring
Approach to Improve Teacher
Competence in High School
Science
Independent Variable/Intervention
DependentVariable Respondent
Research Title
III. Research
Questions
S-Specific
M-Measurable
A- Attainable
R- Result-
oriented
T-Time-bound
Good Bad
Is there a significant
difference in problem
solving skills in Chemistry
between III- Mt. Makiling
and III- Mt. Apo?
Is III- Mt. Makiling better
than III- Mt. Apo?
Is there a positive
correlation between height
and number of leaves of a
Rose plant?
What is a Rose?
PROBLEM-QUESTIONS
1. Do the teacher respondents exposed to Guro’t
Bayanihan have higher competence after
implementation of the intervention?
2. Do the teacher respondents exposed to Guro’t
Bayanihan have higher competence than
teachers utilizing conventional approach?
Institutionalizing Performance-based
Management System (RPMS) - based
Teacher Competence Development
through “Guro’t Bayanihan”
WORKSHOP ON RESEARCH QUESTIONS
1.Using the net, find and
state at least 3 sources to
support your proposed
problem.
2.Formulate a working title.
3.Write at least two
questions about the
I. Context and Rationale
•Reason out
•Establish the problem
•Support with legal bases
•Support with statistical data
•Must be emphatic
(Tejero,
2006)
I. Context and Rationale
II. Review of Related
Literature
•Write an introductory statement
•Cite conceptual literature in a
logical manner
•Paraphrase
•Direct quotation is typed single
space/ inset
•Document sources properly
AMERICAN PSYCHOLOGICAL
ASSOCIATION (APA) STYLE
•Use of parenthetical reference
citations in the text instead of
footnotes and Latin names.
e.g. (Fonollera, 1993)
•Arial/ TNR, 12, double space, use of 3rd
person
Dorough(2003)
claimed that to
prevent students
from dropping-
out, programs should obtain the reasons
for dropping and employ preventive
measures to reach all potential drop-
outs.
PARAPHRASING
REVIEW OF RELATED LITERATURE
Paraphrase !
Plagiarism is
a crime !
WORKSHOP ON WRITING LITERATURE
IV. Scope and Delimitation
•Define the parameters and
boundaries, variables and
respondents
•Discuss the limitations and
how are these to be handled
IV. Scope and Delimitation
V. Methodology
•The Sampling
•Data Collection Procedure
•Data Analysis Procedure
•Results and Discussion
•Conclusion
The Sampling
•Describe the characteristics and
profile of the respondents
n=N/ 1+ Ne2
n= sample size
N= population size
e= margin of error (%)
(Slovin, 1960)
•30 subjects minimum (Gay, 1976)
RESEARCH DESIGN
Qualitative
Interview/focus group transcripts
Some kinds of
observational/archival data
Critical incidents methodology
Quantitative
Correlation Study
Experimental
Mixed Method
DESIGN DIAGRAMMING
 PRE-TEST POST-TEST
O1 X O2
 PRE-TEST POST-TEST WITH
CONTROL GROUP
O1 X O2
O1 O2
Data Collection Methods
•Review of records and
written documents
•Observation
•Questionnaire
•Interview
Reliability will produce results
which are accurate and
consistent
Validity will measure what it is
supposed to measure
Item Analysis- The process used to
evaluate the individual questions
contained in an Objective Test .
ITEM ANALYSIS: DIFFICULTY FACTOR
 Use the Difficulty Factor of a question
 Proportion of respondents selecting the right answer to that
item
D = c / n
D = difficulty factor
c = number of correct answers
n = number of respondents
 Optimal Level is .5
 To be able to discriminate between different levels of
achievement, the difficulty factor should be between .3 and
.7
 The HIGHER the difficulty factor – the easier the question
is, so a value of 1 would mean all the students got the
question correct and it may be too easy
WORKSHOP: TEST RELIABILITY
Using at least 5 answered
test paper (Multiple-choice only),
Identify the difficulty factor(
correct response) of each item
and using cronbach alpha (using
SSR) determine its reliability.
Data Analysis Procedure
•Presentation of
Data
•Analysis of Data
PRESENTATION OF DATA
TABLE
PRESENTATION OF DATA
GRAPH
PRESENTATION OF DATA
ARTIFACT
ANALYSIS OF DATA
SPSS ( STATISTICAL PROCEDURE FOR SOCIAL SCIENCES)
SSR(SIMPLIFIED STATISTICS FOR
RESEARCHERS) -DR. BERMUDO
T TEST: DIFFERENCE BETWEEN MEANS
ASSUMPTIONS
•Samples are taken from
normal distribution
•Random sampling is used.
•Data are either interval or
ratio
‘30 subjects minimum for parametric (Gay, 1976)
SAMPLE: INDEPENDENT SAMPLE T TEST
Is there a significant difference between the
scores of class X and Y?
Decision: Accept null hypothesis if computed
absolute t-value is less than the tabulated t
/critical value.
Conclusion: There is no significant difference
between the scores of class X and Y?
CORRELATION
DREAM OFFICERS
DREAM OFFICERS
ASSUMPTIONS
•Samples are taken from
normal distribution
•Random sampling is used.
•Data are either interval or
ratio
‘30 subjects minimum for parametric (Gay, 1976)
SAMPLE
Is there a significant relationship between the
scores of class X and Y?
SAMPLE
Is there a significant relationship between the
scores of class X and Y?
Is there a significant relationship between the
scores of class X and Y?
Is there a significant relationship between the
scores of class X and Y?
Is there a significant relationship between the
scores of class X and Y?
WORKSHOP: CORRELATION
Is there a significant relationship between
grades of students in Math and MAPEH?
Math MAPEH
78 90
79 89
80 88
81 86
82 88
83 89
85 85
Is there a significant relationship between
grades of students in Math and MAPEH?
Is there a significant relationship between
grades of students in Math and MAPEH?
THINK!
Is there a significant
relationship between the
salary level and size of
balls ( ball games being
played) among men?
ANALYSIS OF DATA
Statistics should reflect
only the test value, degree of
freedom and probability level
Claims must be supported
by findings of other
researchers
ANALYSIS OF DATA
VI. Workplan
Cost Estimate
Particulars Quant
ity
Unit Unit
Price
Total
Printing of Manuscript 200 page 1 200
Paper for manuscript 1 ream 140 140
Photocopy 50 copy 0.50 25
Snacks 40 set 50 2000
TOTAL 2365
VII. Action Plan
Systematic
recommendations
The findings of this study shall be
…
VIII. References
APA, Hanging indent
Action research workshop

Action research workshop

  • 1.
    Adapting to Educational Challengesthrough Action ResearchJohn Lou S. Lucenario
  • 2.
    SIMPLE EXPERIMENT: HOLDANYTHING AS YOUR CELLPHONE, AND ACT AS IF YOU’RE CALLING SOMEONE.
  • 5.
    Republic Act 9155,Chapter I, section 7, states that Department of Education (DepEd) is mandated to “undertake national research and studies” as basis for vital policies for economic development. BASES
  • 6.
    • Department OrderNo. 24 s. 2010( Basic Education Research Fund-BERF) • DO No. 43, s. 2015(Revised BERF) • DO No. 16, s. 2017 ( Research Management Guidelines) BASES
  • 7.
    Action Research DefinedA processof systematic inquiry to improve educational practices or resolve problems in classrooms and schools.
  • 10.
    Why AR? • Bea living hero • Be heard by officials • Present in greater audience, like in conferences • Higher maximum points (4% innovation, 4% awards, 4% research, 4% speakership and 4% authorship) than IPCRF (35%/3=11.67)
  • 11.
  • 12.
    Analysis of Datafrom Returning Drop-out High School Students: A Basis for Implementation of Drop-out Reduction Program By John Lou S. Lucenario, Nelia Ong and Jocelyn Casino School Factor
  • 13.
  • 15.
  • 16.
    •To help figureout what works •To provide rationale •To pursue a study LITERATURE REVIEW Researchable or not?
  • 19.
    Themes: Basic Education ResearchAgenda • Teaching and learning process • Governance • Child protection • Human resource development • Inclusive education • Gender and development
  • 20.
  • 22.
    •Sustain your interest •Withinyour range of competencies •Manageable in size •Significant to society THE RESEARCH PROBLEM
  • 23.
    Guro’t Bayanihan (Teachers CommunalUnity) as (Result-based Performance Management System) RPMS-based Collegiate Mentoring Approach to Improve Teacher Competence in High School Science Independent Variable/Intervention DependentVariable Respondent Research Title
  • 24.
  • 25.
    Good Bad Is therea significant difference in problem solving skills in Chemistry between III- Mt. Makiling and III- Mt. Apo? Is III- Mt. Makiling better than III- Mt. Apo? Is there a positive correlation between height and number of leaves of a Rose plant? What is a Rose?
  • 26.
    PROBLEM-QUESTIONS 1. Do theteacher respondents exposed to Guro’t Bayanihan have higher competence after implementation of the intervention? 2. Do the teacher respondents exposed to Guro’t Bayanihan have higher competence than teachers utilizing conventional approach? Institutionalizing Performance-based Management System (RPMS) - based Teacher Competence Development through “Guro’t Bayanihan”
  • 28.
    WORKSHOP ON RESEARCHQUESTIONS 1.Using the net, find and state at least 3 sources to support your proposed problem. 2.Formulate a working title. 3.Write at least two questions about the
  • 29.
    I. Context andRationale •Reason out •Establish the problem •Support with legal bases •Support with statistical data •Must be emphatic (Tejero, 2006)
  • 30.
    I. Context andRationale
  • 31.
    II. Review ofRelated Literature •Write an introductory statement •Cite conceptual literature in a logical manner •Paraphrase •Direct quotation is typed single space/ inset •Document sources properly
  • 32.
    AMERICAN PSYCHOLOGICAL ASSOCIATION (APA)STYLE •Use of parenthetical reference citations in the text instead of footnotes and Latin names. e.g. (Fonollera, 1993) •Arial/ TNR, 12, double space, use of 3rd person
  • 33.
    Dorough(2003) claimed that to preventstudents from dropping- out, programs should obtain the reasons for dropping and employ preventive measures to reach all potential drop- outs. PARAPHRASING
  • 34.
    REVIEW OF RELATEDLITERATURE Paraphrase ! Plagiarism is a crime !
  • 35.
  • 36.
    IV. Scope andDelimitation •Define the parameters and boundaries, variables and respondents •Discuss the limitations and how are these to be handled
  • 37.
    IV. Scope andDelimitation
  • 38.
    V. Methodology •The Sampling •DataCollection Procedure •Data Analysis Procedure •Results and Discussion •Conclusion
  • 39.
    The Sampling •Describe thecharacteristics and profile of the respondents n=N/ 1+ Ne2 n= sample size N= population size e= margin of error (%) (Slovin, 1960) •30 subjects minimum (Gay, 1976)
  • 40.
    RESEARCH DESIGN Qualitative Interview/focus grouptranscripts Some kinds of observational/archival data Critical incidents methodology Quantitative Correlation Study Experimental Mixed Method
  • 41.
    DESIGN DIAGRAMMING  PRE-TESTPOST-TEST O1 X O2  PRE-TEST POST-TEST WITH CONTROL GROUP O1 X O2 O1 O2
  • 42.
    Data Collection Methods •Reviewof records and written documents •Observation •Questionnaire •Interview
  • 43.
    Reliability will produceresults which are accurate and consistent Validity will measure what it is supposed to measure Item Analysis- The process used to evaluate the individual questions contained in an Objective Test .
  • 44.
    ITEM ANALYSIS: DIFFICULTYFACTOR  Use the Difficulty Factor of a question  Proportion of respondents selecting the right answer to that item D = c / n D = difficulty factor c = number of correct answers n = number of respondents  Optimal Level is .5  To be able to discriminate between different levels of achievement, the difficulty factor should be between .3 and .7  The HIGHER the difficulty factor – the easier the question is, so a value of 1 would mean all the students got the question correct and it may be too easy
  • 45.
    WORKSHOP: TEST RELIABILITY Usingat least 5 answered test paper (Multiple-choice only), Identify the difficulty factor( correct response) of each item and using cronbach alpha (using SSR) determine its reliability.
  • 48.
    Data Analysis Procedure •Presentationof Data •Analysis of Data
  • 49.
  • 50.
  • 51.
  • 52.
  • 53.
    SPSS ( STATISTICALPROCEDURE FOR SOCIAL SCIENCES)
  • 54.
  • 55.
    T TEST: DIFFERENCEBETWEEN MEANS
  • 56.
    ASSUMPTIONS •Samples are takenfrom normal distribution •Random sampling is used. •Data are either interval or ratio ‘30 subjects minimum for parametric (Gay, 1976)
  • 57.
    SAMPLE: INDEPENDENT SAMPLET TEST Is there a significant difference between the scores of class X and Y?
  • 59.
    Decision: Accept nullhypothesis if computed absolute t-value is less than the tabulated t /critical value. Conclusion: There is no significant difference between the scores of class X and Y?
  • 61.
  • 62.
  • 63.
  • 64.
    ASSUMPTIONS •Samples are takenfrom normal distribution •Random sampling is used. •Data are either interval or ratio ‘30 subjects minimum for parametric (Gay, 1976)
  • 65.
    SAMPLE Is there asignificant relationship between the scores of class X and Y?
  • 66.
    SAMPLE Is there asignificant relationship between the scores of class X and Y?
  • 67.
    Is there asignificant relationship between the scores of class X and Y?
  • 68.
    Is there asignificant relationship between the scores of class X and Y?
  • 69.
    Is there asignificant relationship between the scores of class X and Y?
  • 70.
    WORKSHOP: CORRELATION Is therea significant relationship between grades of students in Math and MAPEH? Math MAPEH 78 90 79 89 80 88 81 86 82 88 83 89 85 85
  • 71.
    Is there asignificant relationship between grades of students in Math and MAPEH?
  • 72.
    Is there asignificant relationship between grades of students in Math and MAPEH?
  • 73.
    THINK! Is there asignificant relationship between the salary level and size of balls ( ball games being played) among men?
  • 74.
    ANALYSIS OF DATA Statisticsshould reflect only the test value, degree of freedom and probability level Claims must be supported by findings of other researchers
  • 75.
  • 76.
  • 77.
    Cost Estimate Particulars Quant ity UnitUnit Price Total Printing of Manuscript 200 page 1 200 Paper for manuscript 1 ream 140 140 Photocopy 50 copy 0.50 25 Snacks 40 set 50 2000 TOTAL 2365
  • 78.
    VII. Action Plan Systematic recommendations Thefindings of this study shall be … VIII. References APA, Hanging indent