Downloaded 48 times


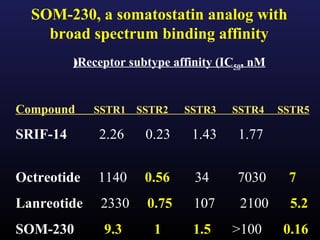
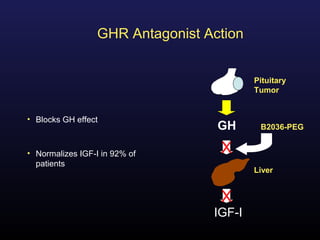
![Odds Ratio Plot
(Fixed Effects)
Mantel-Haenszel chi-square = 0.7341; P = 0.3916
Odds ratio meta-analysis plot [fixed effects]
stratum 1 French Registry 1.14 (0.62, 2.10)
stratum 2 Abe & Ludecke 0.65 (0.28, 1.48)
stratum 3 Biermasz NR 0.61 (0.12, 2.98)
stratum 4 Kristof RA 0.53 (0.07, 3.79)
stratum 5 Colao A 2.84 (0.83, 9.77)
stratum 6 5.74 (1.42, 32.93)
Stevenaert & Beckers
stratum 7 0.98 (0.29, 3.10)
combined [fixed] 1.18 (0.84, 1.66)
0.01 0.1 0.2 0.5 1 2 5 10 100
odds ratio (95% confidence interval)](https://image.slidesharecdn.com/acromegal-130310072819-phpapp02/85/Acromegal-22-320.jpg)
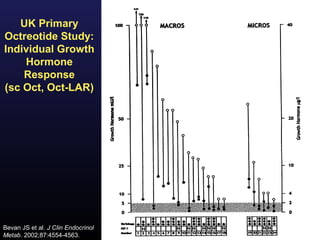


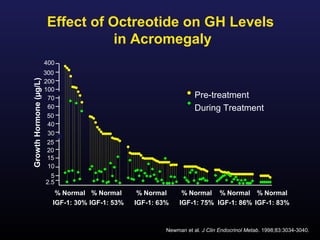

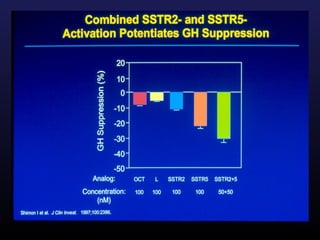


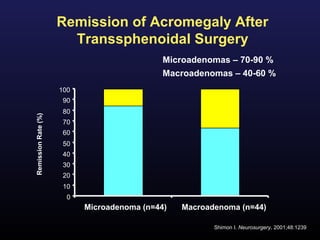
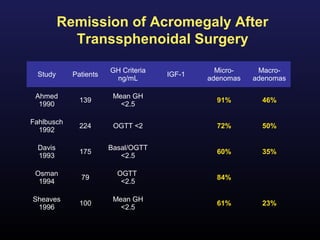
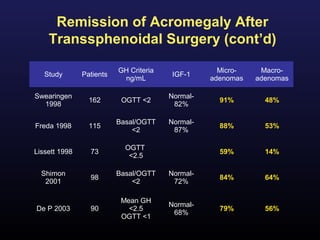
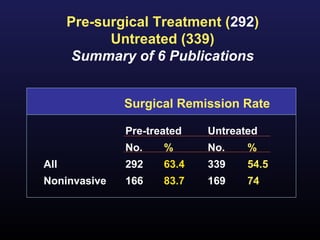
1) Acromegaly is caused by excess growth hormone production, usually from a pituitary tumor. The goals of treatment are to control symptoms, suppress hormone levels, decrease tumor size, and preserve normal pituitary function. 2) Surgical removal of the tumor via transsphenoidal surgery often results in remission, with higher rates for microadenomas versus macroadenomas. Pre-operative factors like tumor size and invasiveness affect outcomes. 3) Medical therapies like somatostatin analogs and GH receptor antagonists can help control hormone levels and symptoms in cases where surgery is not effective or possible. These medications provide alternatives or adjuncts to surgery in treating acromegaly.


