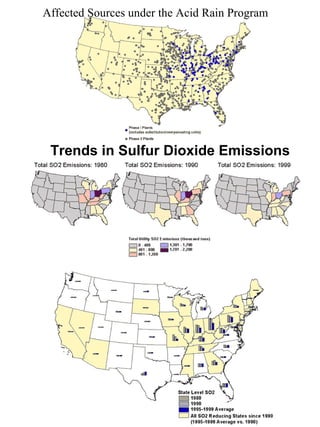
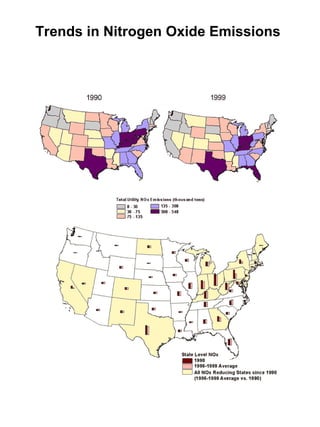
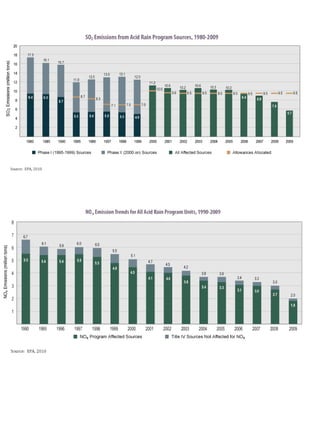
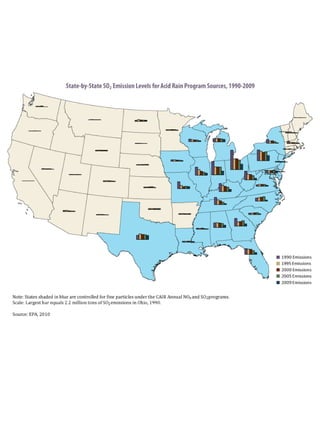
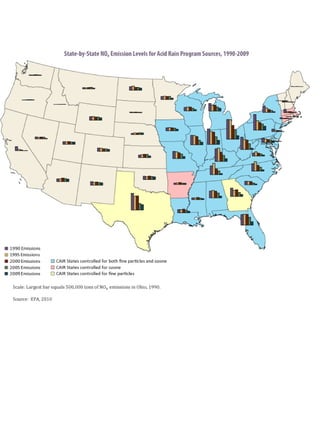
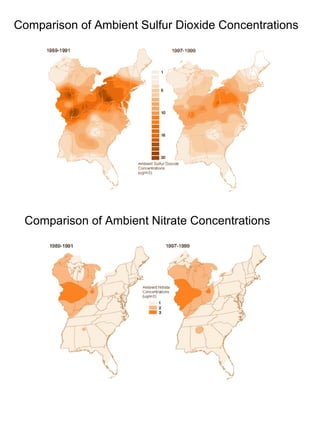
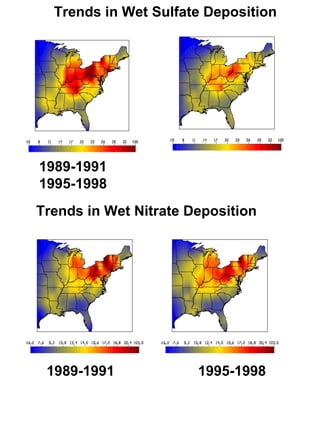
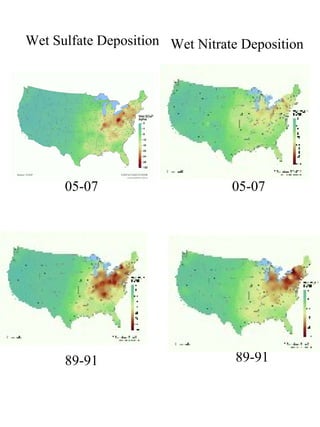
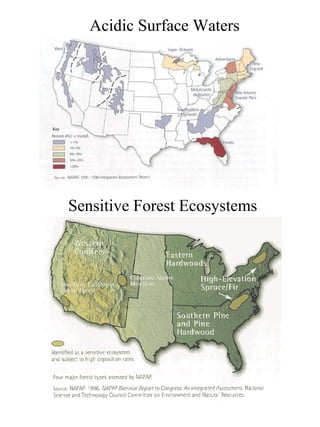
Acidic Deposition (Acid Rain)  Forms of Acidic Deposition A. Wet Deposition: Rain, Snow, Fog B. Dry Deposition: Acidic Gases and Particles 2. Causes  A. NOx (1/4 from power plants) B. SOx (2/3 from power plants) 3. Basic Chemistry A. NOx and SOx react with water, oxygen, and sunlight to form sulfuric and nitric acids B. pH scale: neutral   pH = 7,  100 times more acidic  pH = 5.  pure water  pH = 7.0   natural rainwater  pH = 5.6
4. Effects A. Surface water Lakes and Streams typically have pH between 6 and 8. Natural soil and water have buffering agents to neutralize some acidity.   Low pH affects aqueous chemistry:  High Al, Low Ca Eggs affected Different Species tolerate acidic conditions better Changes in species populations, competition Ecosystem dynamics: species highly interdependent (Nitrogen also causes eutrophication; oxygen depletion) B. Forests In higher elevations, soils are thin (little buffering) Leaf Damage Limitation of nutrients   less Ca, Mg, P - too much Al C. Materials   Corrosion of metal, deterioration of stone Disintegration of fabrics, paint, paper Automotive coatings
5. Strategies for Reducing Acid Rain Reduce Emissions from stacks and tailpipes Alternative Energy Sources Energy Conservation Environmental Restoration (e.g. liming lakes) 6. EPA's Acid Rain Program Title IV of 1990 amendments to Clean Air Act SOx and NOx emissions at power plants Objectives: a)  Achieve environmental benefits   through emission reductions b)  facilitate:   allowance trading    options to minimize compliance costs c)  promote: pollution prevention technologies    energy efficient strategies
Reductions in  SO 2  emissions (started in 1995) are facilitated through a market-based system for capping and trading—the centerpiece of EPA’s Acid Rain Program. The allowance trading system creates low-cost rules of exchange that minimize government intrusion.  Reductions in  NOx  are based on emission limits for specific types of coal-burning boilers.  The annual cost of these additional reductions will be approximately $200 million, at an average cost-effectiveness of $229 per ton of NOx removed.  The 2005  Clean Air Interstate Rule  provides states with a solution to the problem of power plant pollution that drifts from one state to another. CAIR covers 28 eastern states and the District of Columbia. The rule uses a cap and trade system to reduce the target pollutants—sulfur dioxide (SO 2 ) and nitrogen oxides (NOx)—by 70 percent.
Energy Conservation ENERGY STAR is a joint program of the U.S. Environmental Protection Agency and the U.S. Department of Energy helping us all save money and protect the environment through energy efficient products and practices.
Affected Sources under the Acid Rain Program   Trends in Sulfur Dioxide Emissions
Trends in Nitrogen Oxide Emissions


Comparison of Ambient Sulfur Dioxide Concentrations Comparison of Ambient Nitrate Concentrations
Trends in Wet Sulfate Deposition 1989-1991  1995-1998 Trends in Wet Nitrate Deposition 1989-1991  1995-1998
Wet Sulfate Deposition 05-07 89-91 05-07 89-91 Wet Nitrate Deposition
Acidic Surface Waters Sensitive Forest Ecosystems

Acid rain

  • 1.
    Acidic Deposition (AcidRain) Forms of Acidic Deposition A. Wet Deposition: Rain, Snow, Fog B. Dry Deposition: Acidic Gases and Particles 2. Causes A. NOx (1/4 from power plants) B. SOx (2/3 from power plants) 3. Basic Chemistry A. NOx and SOx react with water, oxygen, and sunlight to form sulfuric and nitric acids B. pH scale: neutral pH = 7, 100 times more acidic pH = 5. pure water pH = 7.0 natural rainwater pH = 5.6
  • 2.
    4. Effects A.Surface water Lakes and Streams typically have pH between 6 and 8. Natural soil and water have buffering agents to neutralize some acidity. Low pH affects aqueous chemistry: High Al, Low Ca Eggs affected Different Species tolerate acidic conditions better Changes in species populations, competition Ecosystem dynamics: species highly interdependent (Nitrogen also causes eutrophication; oxygen depletion) B. Forests In higher elevations, soils are thin (little buffering) Leaf Damage Limitation of nutrients less Ca, Mg, P - too much Al C. Materials Corrosion of metal, deterioration of stone Disintegration of fabrics, paint, paper Automotive coatings
  • 3.
    5. Strategies forReducing Acid Rain Reduce Emissions from stacks and tailpipes Alternative Energy Sources Energy Conservation Environmental Restoration (e.g. liming lakes) 6. EPA's Acid Rain Program Title IV of 1990 amendments to Clean Air Act SOx and NOx emissions at power plants Objectives: a) Achieve environmental benefits through emission reductions b) facilitate: allowance trading options to minimize compliance costs c) promote: pollution prevention technologies energy efficient strategies
  • 4.
    Reductions in SO 2 emissions (started in 1995) are facilitated through a market-based system for capping and trading—the centerpiece of EPA’s Acid Rain Program. The allowance trading system creates low-cost rules of exchange that minimize government intrusion. Reductions in NOx are based on emission limits for specific types of coal-burning boilers. The annual cost of these additional reductions will be approximately $200 million, at an average cost-effectiveness of $229 per ton of NOx removed. The 2005 Clean Air Interstate Rule provides states with a solution to the problem of power plant pollution that drifts from one state to another. CAIR covers 28 eastern states and the District of Columbia. The rule uses a cap and trade system to reduce the target pollutants—sulfur dioxide (SO 2 ) and nitrogen oxides (NOx)—by 70 percent.
  • 5.
    Energy Conservation ENERGYSTAR is a joint program of the U.S. Environmental Protection Agency and the U.S. Department of Energy helping us all save money and protect the environment through energy efficient products and practices.
  • 6.
    Affected Sources underthe Acid Rain Program Trends in Sulfur Dioxide Emissions
  • 7.
    Trends in NitrogenOxide Emissions
  • 8.
  • 9.
  • 10.
  • 11.
    Comparison of AmbientSulfur Dioxide Concentrations Comparison of Ambient Nitrate Concentrations
  • 12.
    Trends in WetSulfate Deposition 1989-1991 1995-1998 Trends in Wet Nitrate Deposition 1989-1991 1995-1998
  • 13.
    Wet Sulfate Deposition05-07 89-91 05-07 89-91 Wet Nitrate Deposition
  • 14.
    Acidic Surface WatersSensitive Forest Ecosystems